. 2019 Nov;24(11):1685-1695.
doi: 10.1038/s41380-018-0059-8. Epub 2018 May 8.

Differential activity of transcribed enhancers in the prefrontal cortex of 537 cases with schizophrenia and controls

Affiliations

Differential activity of transcribed enhancers in the prefrontal cortex of 537 cases with schizophrenia and controls

Mads E Hauberg et al. Mol Psychiatry. 2019 Nov.

Abstract

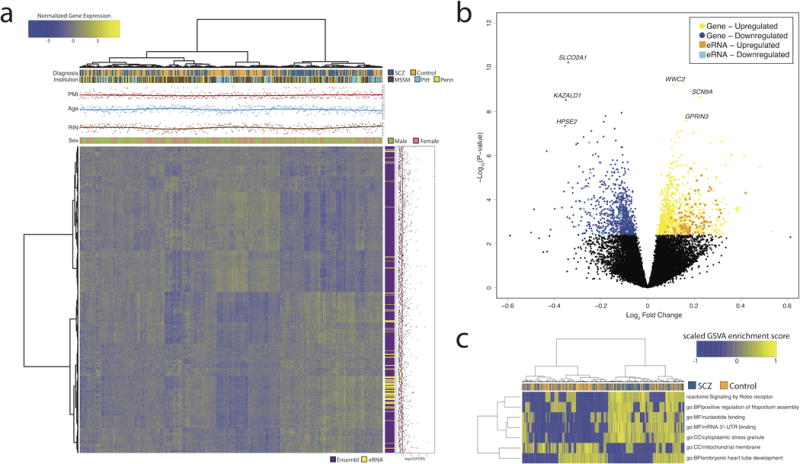
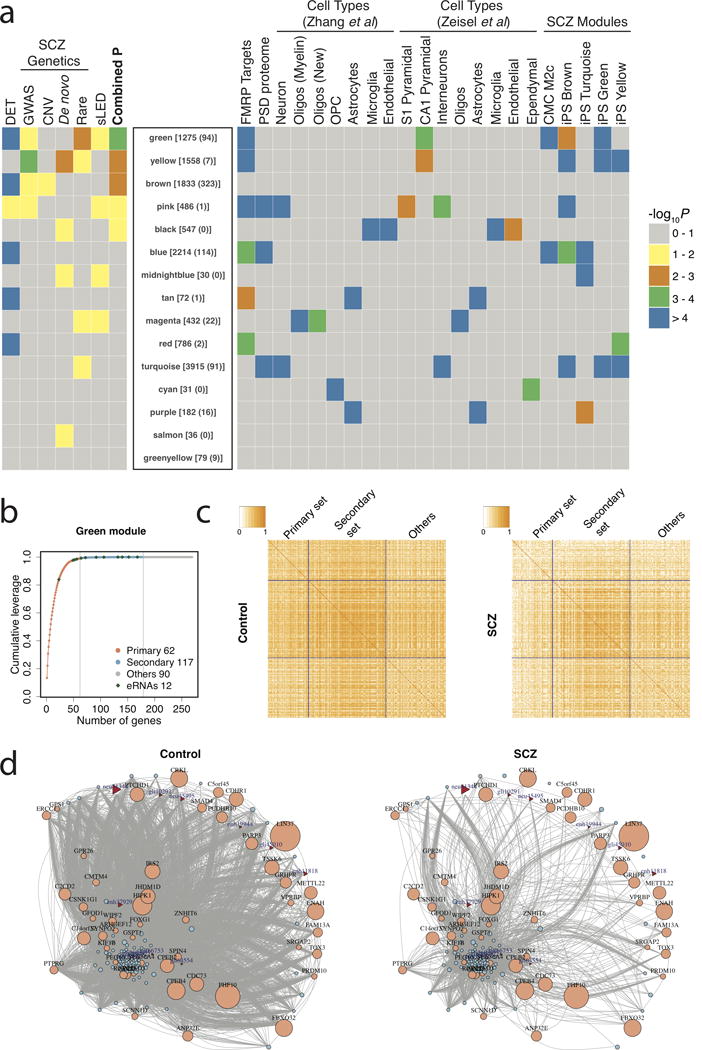
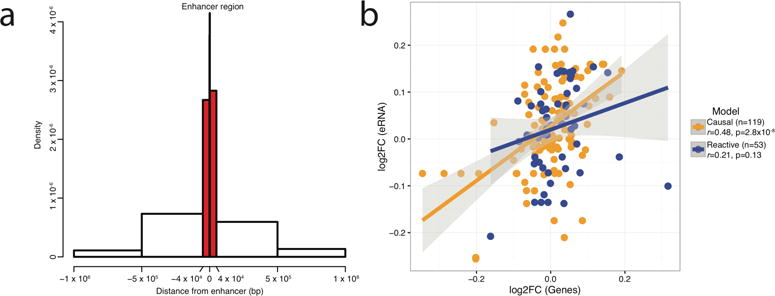
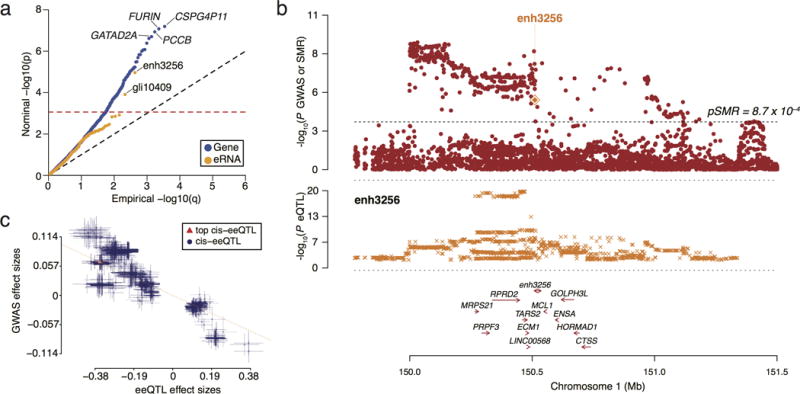
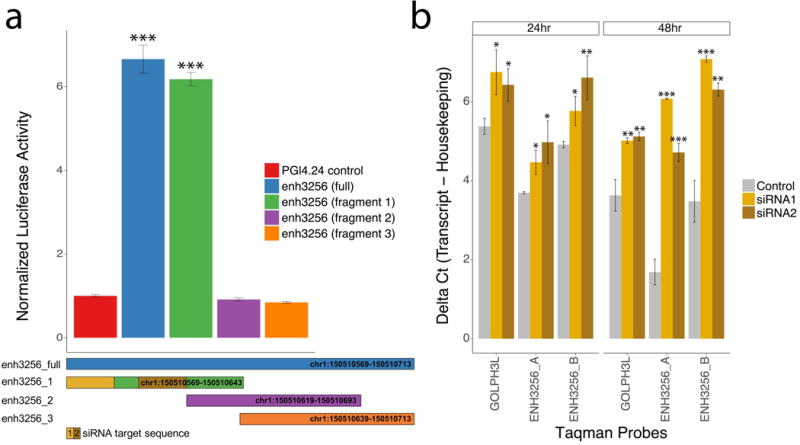
Transcription at enhancers is a widespread phenomenon which produces so-called enhancer RNA (eRNA) and occurs in an activity-dependent manner. However, the role of eRNA and its utility in exploring disease-associated changes in enhancer function, and the downstream coding transcripts that they regulate, is not well established. We used transcriptomic and epigenomic data to interrogate the relationship of eRNA transcription to disease status and how genetic variants alter enhancer transcriptional activity in the human brain. We combined RNA-seq data from 537 postmortem brain samples from the CommonMind Consortium with cap analysis of gene expression and enhancer identification, using the assay for transposase-accessible chromatin followed by sequencing (ATACseq). We find 118 differentially transcribed eRNAs in schizophrenia and identify schizophrenia-associated gene/eRNA co-expression modules. Perturbations of a key module are associated with the polygenic risk scores. Furthermore, we identify genetic variants affecting expression of 927 enhancers, which we refer to as enhancer expression quantitative loci or eeQTLs. Enhancer expression patterns are consistent across studies, including differentially expressed eRNAs and eeQTLs. Combining eeQTLs with a genome-wide association study of schizophrenia identifies a genetic variant that alters enhancer function and expression of its target gene, GOLPH3L. Our novel approach to analyzing enhancer transcription is adaptable to other large-scale, non-poly-A depleted, RNA-seq studies.


Conflict of interest statement

Conflict of Interest

The authors declare no competing financial interests.

Figures

Figure 1
Figure 1. Differential expression between schizophrenia cases and controls in the DLPFC
(a) Bivariate clustering of individuals (columns) and genes (rows) depicting the case-vs.-control differences of the 1,647 genes and 118 eRNAs that were differentially expressed. Bars and scatterplots on top show disease status, brain bank (MSSM, Mount Sinai brain bank; Pitt, University of Pittsburgh brain bank; Penn, University of Pennsylvania brain bank), postmortem interval (PMI), age at death (Age), RNA integrity number (RIN), and gender. The vertical color bar and scatter plot illustrate the transcript type and -log10(FDR) values from the differential expression analysis, respectively. (b) Volcano plot illustrating the distribution of log2 fold-changes and -log10 P-values of transcripts in the differential expression analysis. Coloring indicates differentially expressed genes and eRNAs. (c) Bivariate clustering of individuals (columns) and gene sets (rows) based on their GSVA enrichment score for the 7 significant gene sets (Bonferroni-adjusted P ≤ 0.05). The GSVA score indicates whether genes in a pathway are concordantly activated in one direction, either over-expressed (yellow) or under-expressed (blue) relative to the overall population. The color bar indicates disease status.
Figure 2
Figure 2. Co-expression network analysis
(a) Rank of modules based on a combined P-value including differentially expressed transcripts (DET), prior SCZ genetic associations (GWAS, copy number variants [CNVs], de novo mutations, rare nonsynonymous mutations), and differences in the co-regulation of transcripts among patients with SCZ and controls, using a sparse-Leading-Eigenvalue-Driven (sLED) test. The number of total transcripts and eRNAs in each module is given in brackets and parentheses, respectively. The enrichment of each module with fragile X mental retardation protein (FMRP) targets, postsynaptic density proteins, cell type-specific markers, and SCZ associated modules from prior studies, is depicted at right. (b) Scree plot of sLED leverage in the green module, in which 179 transcripts are detected to have non-zero leverage, including the primary set with 62 transcripts that account for 99% of the leverage, and the secondary set with the remaining 117 transcripts that account for 1% of the leverage. “Others” consist of 90 additional randomly selected transcripts. (c) Absolute correlation matrices among transcript categories in control and SCZ samples. (d) Gene co-expression networks of top genes in the green module in control and SCZ samples. Edges represent absolute correlation |rij| ≥ 0.5 between gene pairs. Ensembl and eRNA transcripts are indicated with circles and triangles, respectively. The size of the nodes indicates the sLED leverage of each transcript. Ensembl transcripts without annotated gene symbols and unconnected transcripts were excluded.
Figure 3
Figure 3. Association of eRNA-level QTL (enhancer expression QTL or eeQTL) with gene-level QTL (gene expression QTL or geQTL)
(a) Distribution of cis-eeQTL location relative to the center of the enhancer. The majority of eeQTL SNPs (eeSNPs) were located within the enhancer region (1.5 kb upstream or downstream from the center of the eRNA) or within 40 kb upstream or downstream from the center of the eRNA (highlighted in red). For each eRNA, only the most significant cis-eeQTL was used for this analysis. (b) Correlation scatterplot for log2 fold-changes (log2FC) among cases with SCZ and controls for eRNA-gene pairs that have support for causal (n = 119), or reactive (n = 53) interactions. The correlation was significant only for eRNA-genes that support the causal model.
Figure 4
Figure 4. Overlap of enhancer and gene expression QTLs with GWAS of schizophrenia
(a) Quantile-quantile plot of the Summary-based-results Mendelian Randomization (SMR) P-values for association of eRNA-level QTLs (eeQTL) and gene-level QTLs (geQTL) with risk variants of schizophrenia (SCZ). The dashed horizontal line indicates SMR significance at FDR < 0.05. (b) Association of enh3256 eeQTLs with SCZ. The top plot shows P-values from the SCZ and SMR P-values for enh3256 (orange diamond) that were significant at FDR < 0.05. The dashed line indicates SMR significance at FDR < 0.05. The bottom plot shows the P-values from the eeQTL analysis of enh3256. (c) The effect sizes and standard errors (error bars) of SCZ GWAS SNPs used for the HEIDI test are plotted against enh3256 eeSNPs. The dashed line represents the SMR estimate of bxy at the top cis-eeQTL (red triangle). Notice that the index eeQTL SNP (top cis-eeQTL in the legend) is associated with increased risk for SCZ and lower expression of enh3256.
Figure 5
Figure 5. Examining the enhancer activity and regulatory role of enh3256 in GOLPH3L expression
(a) Examining luciferase expression driven by full length (145 bp) and smaller, overlapping, 75 bp fragments of the enh3256 sequence in HEK293 cells. The full-length construct and fragment 1 resulted in increased luciferase activity compared to empty pGL4.24 vector and fragments 2 and 3. (b) qPCR analysis of enh3256 eRNA and GOLPH3L mRNA for HEK293 cells transfected with control and two different siRNAs targeting enh3256 (siRNA1 and siRNA2). qPCR quantification was performed using Taqman probes measuring enh3256 (ENH3256_A and ENH3256_B) and GOLPH3L, 24 and 48 hours after transfection. Higher delta Ct values indicate lower relative expression for each Taqman probe. Taqman probe expression was normalized to b-2-microglobulin in all cases. Expression of luciferase activity was normalized to Renilla Luciferase. Data represent mean ± standard deviation. Statistical significance was determined by two-tailed Student’s t-test. *P < 0.01; **P < 0.05; and ***P < 0.005 versus control.

References

    1. Roussos P, Mitchell Amanda C, Voloudakis G, Fullard John F, Pothula Venu M, Tsang J, et al. A Role for Noncoding Variation in Schizophrenia. Cell Reports. 2014;9(4):1417–1429. - PMC - PubMed
    1. Fromer M, Roussos P, Sieberts SK, Johnson JS, Kavanagh DH, Perumal TM, et al. Gene expression elucidates functional impact of polygenic risk for schizophrenia. Nature neuroscience. 2016;19(11):1442–1453. - PMC - PubMed
    1. Hauberg ME, Roussos P, Grove J, Børglum AD, Mattheisen M. Analyzing the Role of MicroRNAs in Schizophrenia in the Context of Common Genetic Risk Variants. JAMA psychiatry. 2016;73(4):369–377. - PMC - PubMed
    1. Hu J, Xu J, Pang L, Zhao H, Li F, Deng Y, et al. Systematically characterizing dysfunctional long intergenic non-coding RNAs in multiple brain regions of major psychosis. Oncotarget. 2016;7(44):71087–71098. - PMC - PubMed
    1. Kim T-K, Hemberg M, Gray JM, Costa AM, Bear DM, Wu J, et al. Widespread transcription at neuronal activity-regulated enhancers. Nature. 2010;465(7295):182–187. - PMC - PubMed

Publication types

MeSH terms