. 2018 Apr 23:8:100.
doi: 10.3389/fonc.2018.00100. eCollection 2018.

Genomic DNA Methylation-Derived Algorithm Enables Accurate Detection of Malignant Prostate Tissues

Affiliations

Genomic DNA Methylation-Derived Algorithm Enables Accurate Detection of Malignant Prostate Tissues

Erfan Aref-Eshghi et al. Front Oncol. .

Abstract

Introduction: The current methodology involving diagnosis of prostate cancer (PCa) relies on the pathology examination of prostate needle biopsies, a method with high false negative rates partly due to temporospatial, molecular, and morphological heterogeneity of prostate adenocarcinoma. It is postulated that molecular markers have a potential to assign diagnosis to a considerable portion of undetected prostate tumors. This study examines the genome-wide DNA methylation changes in PCa in search of genomic markers for the development of a diagnostic algorithm for PCa screening.

Methods: Archival PCa and normal tissues were assessed using genomic DNA methylation arrays. Differentially methylated sites and regions (DMRs) were used for functional assessment, gene-set enrichment and protein interaction analyses, and examination of transcription factor-binding patterns. Raw signal intensity data were used for identification of recurrent copy number variations (CNVs). Non-redundant fully differentiating cytosine-phosphate-guanine sites (CpGs), which did not overlap CNV segments, were used in an L1 regularized logistic regression model (LASSO) to train a classification algorithm. Validation of this algorithm was performed using a large external cohort of benign and tumor prostate arrays.

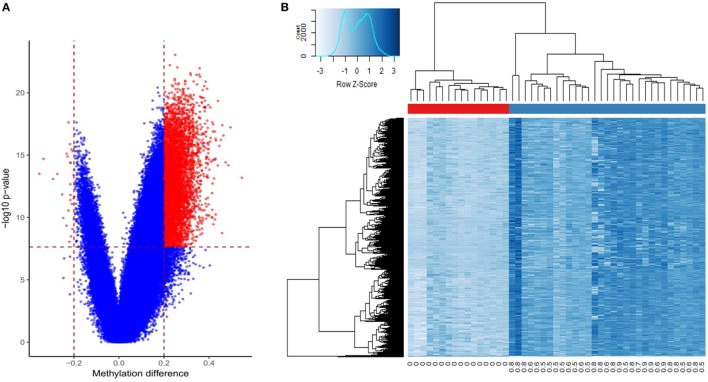
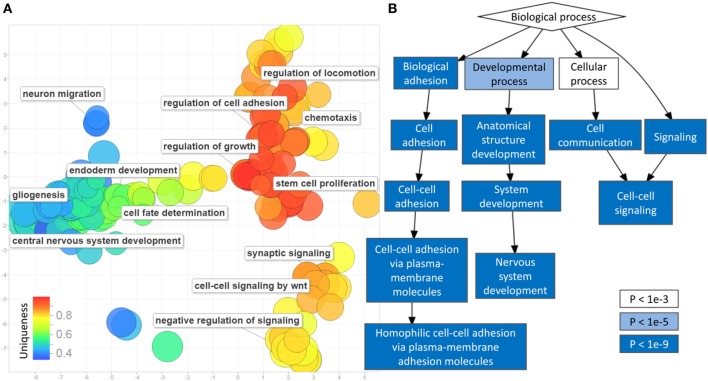
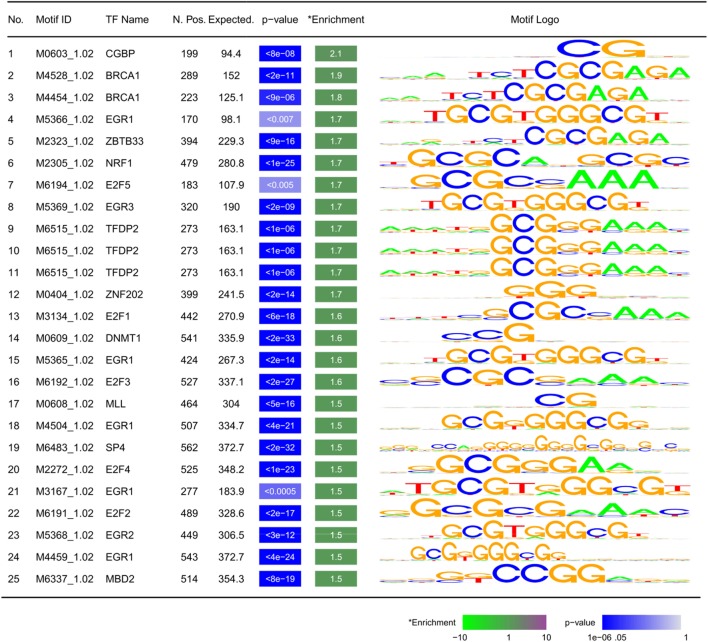
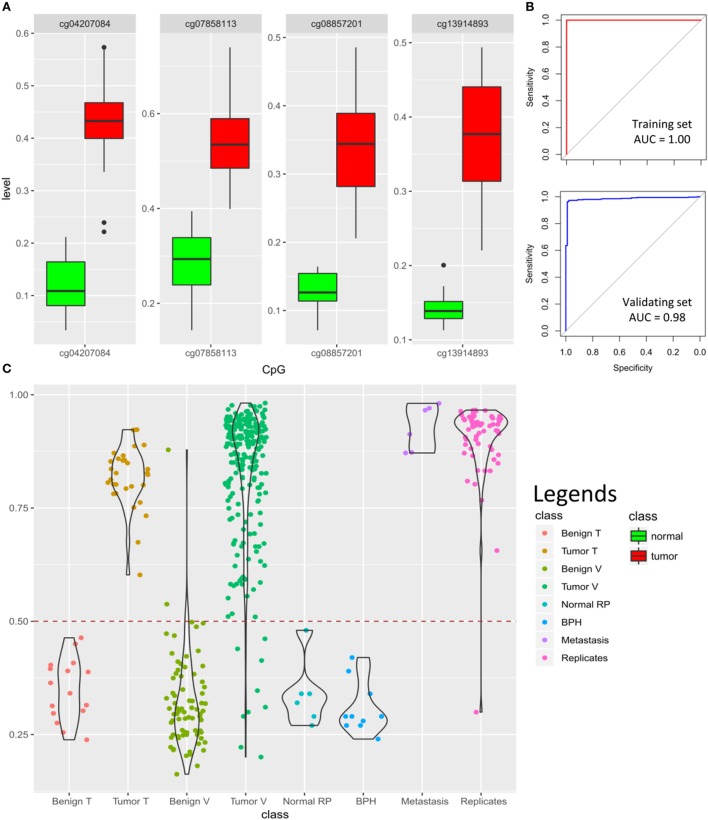
Results: Approximately 6,000 probes and 600 genomic regions showed significant DNA methylation changes, primarily involving hypermethylation. Gene-set enrichment and protein interaction analyses found an overrepresentation of genes related to cell communications, neurogenesis, and proliferation. Motif enrichment analysis demonstrated enrichment of tumor suppressor-binding sites nearby DMRs. Several of these regions were also found to contain copy number amplifications. Using four non-redundant fully differentiating CpGs, we trained a classification model with 100% accuracy in discriminating tumors from benign samples. Validation of this algorithm using an external cohort of 234 tumors and 92 benign samples yielded 96% sensitivity and 98% specificity. The model was found to be highly sensitive to detect metastatic lesions in bone, lymph node, and soft tissue, while being specific enough to differentiate the benign hyperplasia of prostate from tumor.

Conclusion: A considerable component of PCa DNA methylation profile represent driver events potentially established/maintained by disruption of tumor suppressor activity. As few as four CpGs from this profile can be used for screening of PCa.

Keywords: DNA methylation; LASSO; copy number variation; differentially methylated regions; machine learning; prostate cancer; protein interaction; transcription factor binding.


Figures

Figure 1
Figure 1
Differentially methylated cytosine-phosphate-guanine (CpG) sites in prostate cancer: (A) volcano plot of the comparison between the tumors and benign samples: X-axis: methylation difference (mean tumor − mean normal); Y-axis: negative logarithmic scale of p-value; vertical dashed lines: methylation difference cut-off (0.2); horizontal line: p-value cut-off (0.01, Bonferroni-corrected). The significant probes are shown in red; (B) Heatmap of the tumors (columns, blue bar), and the adjacent benign tissues (columns, red bar) using 6,167 differentially methylated loci (rows): intensity of blue color corresponds to the methylation levels. Numbers bellow columns: level of tumor cellularity.
Figure 2
Figure 2
Gene-set enrichment analysis of differentially methylated cytosine-phosphate-guanine sites (CpGs) in prostate cancer: (A) multiple dimensional scaling of the gene ontology (GO) terms (circles): GO terms with closely related functionalities are clustered in groups. Circles with smaller distance from each other represent GO terms with similar functionality. The uniqueness of every GO term is shown using a color scale from blue (less unique) to red (more unique). Representative non-redundant GO terms from every cluster are written next to the related circles. Only 350 of the GO terms were selected by REVIGO for reduction and visualization (maximum software limit); (B) hierarchical relationship between the significant GO terms: the level of significance (p-value) of every functional category is illustrated by a color scale from white to blue.
Figure 3
Figure 3
Correlation between copy number variation (CNV) status and DNA methylation in prostate cancer: hypermethylation in the promoter of the CLIP4 gene partially correlates with its CNV status. The figure illustrates a segment in the promoter of CLIP4 gene, located in the short arm of chromosome 2. The region is marked with high levels of acetylation of the 27th lysine residue of Histone 3, (H3K27Ac), a maker associated with active promoters. The segment is also recognized as a cytosine-phosphate-guanine (CpG) island (green pane). Panels (A,B) represent 181 base-pairs of this segment, harboring a total of 8 CpG probes, which were identified to concurrently show both hypermethylation and CNV amplification. (A) The color scale of the vertical bars (each probe) represents the log ratios of the copy numbers. The color scale above 0.2 is shown with red and indicates a minimum of one copy amplification for the region. Color scales of white and light blue represent no CNV change (we defined a CNV loss with a log ratio less than −0.3, which is not observed for this region). Samples are sorted from top to bottom. The top 16 samples represent normal tissues and the lower samples indicate the tumors (vertical pane as an indicator: blue and pink). Within this segment, the right five probes show CNV amplification in tumors, but not in the adjacent benign tissues. (B) The methylation status of the same eight probes shows a hypermethylation in tumors (pink) relative to normal adjacent benign tissues (blue). Methylation level of every probe from every sample is presented with a dot, representing a methylation range between 0 and 1 (bottom to top). Lines represent mean, and shadows around the lines indicate 95% confidence intervals of the mean in every group. The region with CNV amplification is significantly hypermethylated; however, this hypermethylation extends beyond the CNV to three probes in the upstream.
Figure 4
Figure 4
Motifs enriched within ±5 kb of differentially methylated regions: TF, transcription factor; N. Pos.: number of observed motifs; expected: number of expected motifs; enrichment: fold enrichment; p-value is corrected for multiple testing using Bonferroni method. Motifs are sorted by fold enrichment.
Figure 5
Figure 5
Prediction algorithm for classification of prostate samples: (A) four cytosine-phosphate-guanine (CpG) probes selected by LASSO for training the classification model show significant hypermethylation in the tumors as compared to the normal samples. Y-axis represents the methylation levels. (B) The classification model yields 100% accuracy [area under the curve (AUC) = 1.00] in the training dataset and 97% accuracy (AUC = 0.98) in the validating dataset of 92 benign samples and 234 tumors (model details in Tables S7 and S8 in Supplementary Material); (C) classification scores generated by the model for 16 normal samples in the training dataset (Benign T), 31 tumor samples in the training dataset (Tumor T), 76 benign tissue from validating dataset (Benign V), 234 tumors from validating dataset (Tumor V), 6 normal radical prostatectomy from validating dataset (Normal RP), 10 benign prostate hyperplasia (BPH) from validating dataset, 6 prostate cancer metastasis from bone, lymph node, and soft tissue (Metastasis), as well as 61 tumor technical replicates are shown using violin-jitter plots. Y-axis represents the tumor probability scores (0–1), stratified by different classes on the X-axis. Violin-jitter plots show the density and distributions of the scores in every category. The normal samples mostly receive a score between 0.15 and 0.45, while the majority of the tumors are scored >0.65. The default cut-off of 0.5 (dashed line) is used for classification. Only two of the normal samples out of 92 received a score similar to other tumors, and only 9 misclassifications out of 234 have been made for tumors. Technical replicates have also generated comparable scores to the samples in the original experiment.

References

    1. Jemal A, Bray F, Center MM, Ferlay J, Ward E, Forman D. Global cancer statistics. CA Cancer J Clin (2011) 61(2):69–90.10.3322/caac.20107 - DOI - PubMed
    1. Wojno K, Hornberger J, Schellhammer P, Dai M, Morgan T. The clinical and economic implications of specimen provenance complications in diagnostic prostate biopsies. J Urol (2015) 193(4):1170–7.10.1016/j.juro.2014.11.019 - DOI - PubMed
    1. Gaudreau PO, Stagg J, Soulières D, Saad F. The present and future of biomarkers in prostate cancer: proteomics, genomics, and immunology advancements. Biomark Cancer (2016) 8(Suppl 2):15–33.10.4137/BIC.S31802 - DOI - PMC - PubMed
    1. Schenkel LC, Rodenhiser DI, Ainsworth PJ, Paré G, Sadikovic B. DNA methylation analysis in constitutional disorders: clinical implications of the epigenome. Crit Rev Clin Lab Sci (2016) 53(3):147–65.10.3109/10408363.2015.1113496 - DOI - PubMed
    1. Mikeska T, Craig JM. DNA methylation biomarkers: cancer and beyond. Genes (Basel) (2014) 5(3):821–64.10.3390/genes5030821 - DOI - PMC - PubMed