. 2018 Apr 6;4(4):eaar4817.
doi: 10.1126/sciadv.aar4817. eCollection 2018 Apr.

Light-sheet microscopy with attenuation-compensated propagation-invariant beams

Affiliations

Light-sheet microscopy with attenuation-compensated propagation-invariant beams

Jonathan Nylk et al. Sci Adv. .

Abstract

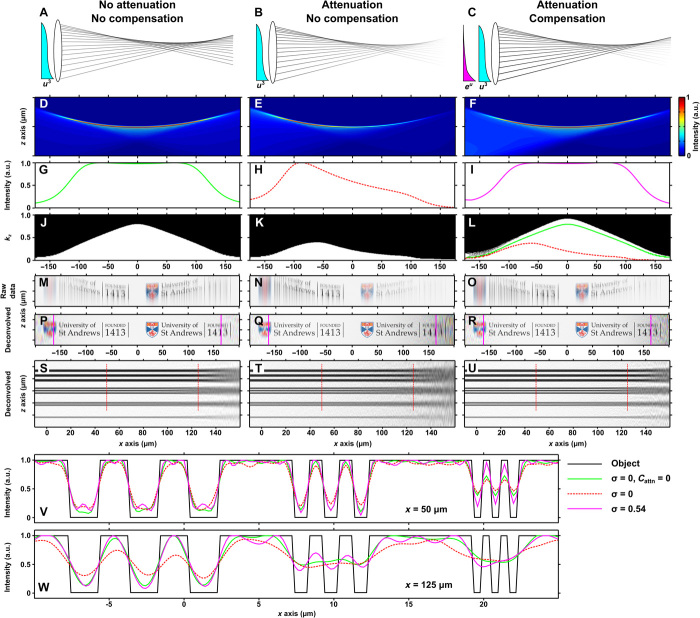
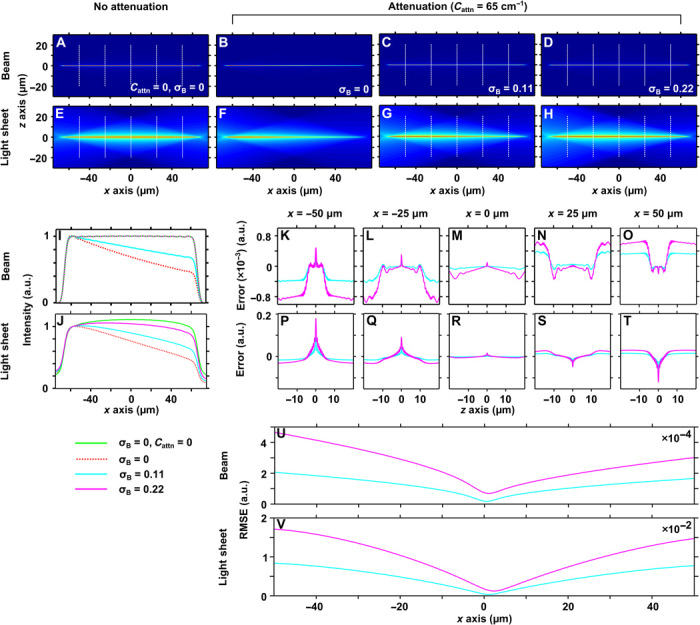
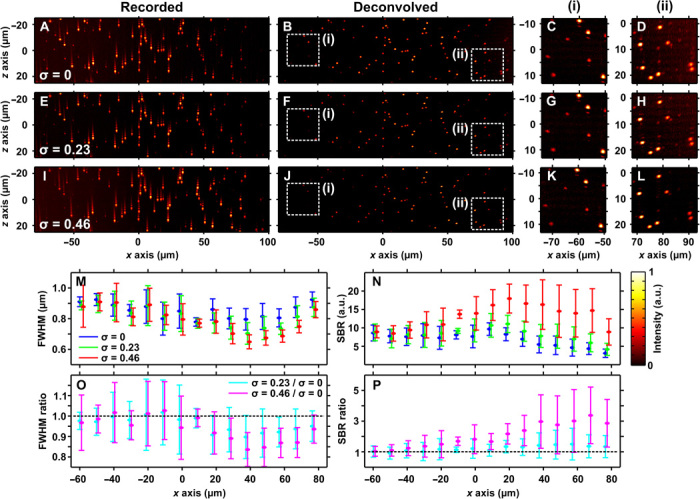
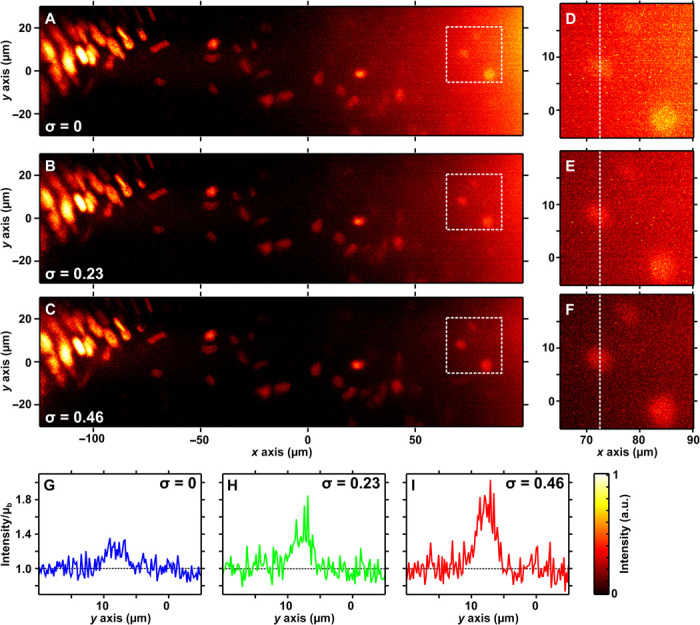
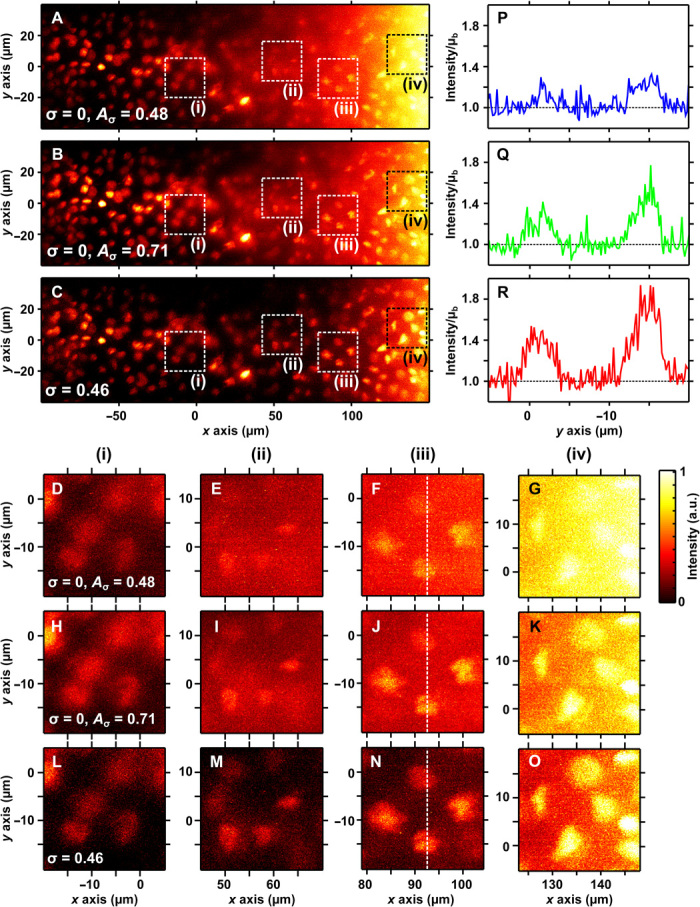
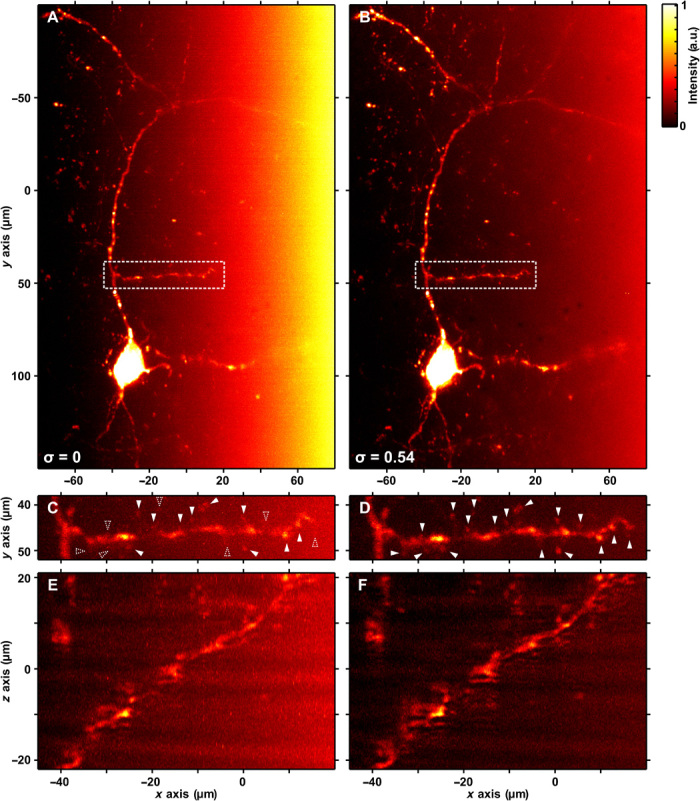
Scattering and absorption limit the penetration of optical fields into tissue. We demonstrate a new approach for increased depth penetration in light-sheet microscopy: attenuation-compensation of the light field. This tailors an exponential intensity increase along the illuminating propagation-invariant field, enabling the redistribution of intensity strategically within a sample to maximize signal and minimize irradiation. A key attribute of this method is that only minimal knowledge of the specimen transmission properties is required. We numerically quantify the imaging capabilities of attenuation-compensated Airy and Bessel light sheets, showing that increased depth penetration is gained without compromising any other beam attributes. This powerful yet straightforward concept, combined with the self-healing properties of the propagation-invariant field, improves the contrast-to-noise ratio of light-sheet microscopy up to eightfold across the entire field of view in thick biological specimens. This improvement can significantly increase the imaging capabilities of light-sheet microscopy techniques using Airy, Bessel, and other propagation-invariant beam types, paving the way for widespread uptake by the biomedical community.


Figures

Fig. 1
Fig. 1. Principle of attenuation-compensation for an Airy light sheet.
Ray optics representations of Airy light-sheet formation without (A) and with (B) attenuation (Cattn = 65 cm−1) and with attenuation-compensation (C; σ = 0.54). (D to F) Wave optical simulations of light-sheet profiles, (G to I) peak transverse intensity as a function of longitudinal coordinate, and (J to L) axial MTF thresholded at 5% contrast, respectively, for the light sheets shown in (A) to (C). Green and red lines in (L) match the 5% contour in (J) and (K), respectively. a.u., arbitrary units. (M to R) Simulated, recorded, and deconvolved images of the University crest and (S to U) simulated deconvolved images of a 1D resolution target, respectively, for the light sheets shown in (A) to (C). Pink solid lines in (P) to (R) indicate the edge of the FOV from theory. One-dimensional resolution target (P to R) has linewidth/spacing: 2 μm (top) and 1, 0.6, and 0.2 μm (bottom). (V and W) Intensity profiles through the dashed lines at x = 50 and 125 μm in (S) to (U). Simulation parameters were set to mirror experimental parameters (see Materials and Methods).
Fig. 2
Fig. 2. Principle of attenuation-compensation for a Bessel light sheet.
Simulated xz intensity profiles for a flat-top Bessel beam without (A) and with (B) attenuation (Cattn = 65 cm−1) and with partial (C; σB = 0.11) and full (D; σB = 0.22) attenuation-compensation. (E to H) Light-sheet cross sections resulting from digital scanning of the Bessel beams shown in (A) to (D). (I and J) Peak transverse intensity as a function of longitudinal coordinate for the Bessel beams (A to D) and Bessel light sheets (E to H), respectively. The intensity is normalized to the start of the propagation-invariant region (x = −57.5 μm). (K to T) Comparison of Bessel beam and light-sheet transverse profiles with and without attenuation-compensation at x = −50 μm (K and P), −25 μm (L and Q), 0 μm (M and R), 25 μm (N and S), and 50 μm (O and T). (U and V) RMSE between Bessel beam and light-sheet transverse profiles with and without attenuation-compensation as a function of longitudinal coordinate.
Fig. 3
Fig. 3. Attenuation-compensated Airy LSM in an attenuating phantom.
Maximum intensity projections of recorded data (A, E, and I) and deconvolved images (B, F, and J) of sub–diffraction-limited fluorescent microspheres in an absorbing phantom with Cattn = 55 ± 1 cm−1. (A and B) No attenuation-compensation (σ = 0), (E and F) σ = 0.23, and (I and J) σ = 0.46 (full attenuation-compensation). (C, D, G, H, K, and L) Zoomed-in views of the regions indicated by the dashed boxes (i) and (ii) in (B), (F), and (J). (M and N) Axial resolution determined by FWHM of fluorescent microspheres and local SBR, respectively, as a function of light-sheet propagation (mean ± SD, 10-μm binning); σ = 0 (blue), σ = 0.23 (green), and σ = 0.46 (red). (O and P) Ratios of the graphs shown in (M) and (N); σ = 0.23/σ = 0 (cyan) and σ = 0.46/σ = 0 (magenta). Look-up tables of the images shown in (A) to (L) are independently scaled to the data shown.
Fig. 4
Fig. 4. Attenuation-compensated Airy LSM in S. lamarcki opercula.
Maximum intensity projections of deconvolved Airy LSM images of nuclei stained with propidium iodide (PI) in the operculum of S. lamarcki (attenuation estimated at 85 cm−1) with (A) no attenuation-compensation, (B) σ = 0.23, and (C) σ = 0.46. (D to F) Expanded views of the region indicated by the dashed box in (A) to (C). (G to I) Intensity profiles along the dashed line shown in (D) to (F). Line intensity profiles are shown relative to the noise floor, given by the local mean background μb.
Fig. 5
Fig. 5. Attenuation-compensated Airy LSM in S. lamarcki opercula.
Maximum intensity projections of deconvolved Airy LSM images of nuclei stained with PI in the operculum of S. lamarcki (attenuation estimated at 75 cm−1) with (A) no attenuation-compensation, (B) no attenuation-compensation but the same total power as a compensated light sheet (σ = 0.46), and (C) σ = 0.46. (D to G) Zoomed-in views of the region indicated by dashed boxes (i) to (iv) in (A). (H to O) Same regions from (B) and (C). Intensity profiles along the dashed line in (F), (J), and (N) are shown in (P) to (R), respectively. Line intensity profiles are shown relative to the noise floor, given by the local mean background μb.
Fig. 6
Fig. 6. Attenuation-compensated Airy LSM in mouse brain section.
Maximum intensity projections of deconvolved Airy LSM images of kisspeptin neurons expressing mCherry in the hypothalamic arcuate nucleus of a mouse brain (attenuation estimated at 100 cm−1) with (A) no attenuation-compensation and (B) σ = 0.54. (C and D) Expanded views of the region indicated by the dashed box in (A) and (B). (E and F) Orthogonal projections of the regions shown in (C) and (D). Filled arrowheads indicate the positions of dendritic spines in (C) and (D). Dashed arrowheads in (C) indicate the position of dendritic spines not identified without attenuation-compensation.

References

    1. Huisken J., Swoger J., Del Bene F., Wittbrodt J., Stelzer E. H. K., Optical sectioning deep inside live embryos by selective plane illumination microscopy. Science 305, 1007–1009 (2004). - PubMed
    1. Höckendorf B., Thumberger T., Wittbrodt J., Quantitative analysis of embryogenesis: A perspective for light sheet microscopy. Dev. Cell 23, 1111–1120 (2012). - PubMed
    1. Ahrens M. B., Orger M. B., Robson D. N., Li J. M., Keller P. J., Whole-brain functional imaging at cellular resolution using light-sheet microscopy. Nat. Methods 10, 413–420 (2013). - PubMed
    1. Yang Z., Haslehurst P., Scott S., Emptage N., Dholakia K., A compact light-sheet microscope for the study of the mammalian central nervous system. Sci. Rep. 6, 26317 (2016). - PMC - PubMed
    1. Swoger J., Verveer P., Greger K., Huisken J., Stelzer E. H. K., Multi-view image fusion improves resolution in three-dimensional microscopy. Opt. Express 15, 8029–8042 (2007). - PubMed

Publication types

LinkOut - more resources