

Systematic comparison of the statistical operating characteristics of various Phase I oncology designs
- PMID: 29740620
- PMCID: PMC5936704
- DOI: 10.1016/j.conctc.2016.11.006
Systematic comparison of the statistical operating characteristics of various Phase I oncology designs
Abstract
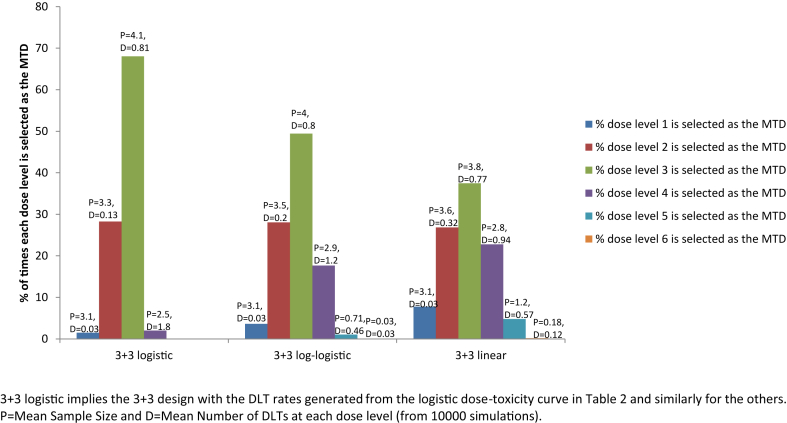
Dose finding Phase I oncology designs can be broadly categorized as rule based, such as the 3 + 3 and the accelerated titration designs, or model based, such as the CRM and Eff-Tox designs. This paper systematically reviews and compares through simulations several statistical operating characteristics, including the accuracy of maximum tolerated dose (MTD) selection, the percentage of patients assigned to the MTD, over-dosing, under-dosing, and the trial dose-limiting toxicity (DLT) rate, of eleven rule-based and model-based Phase I oncology designs that target or pre-specify a DLT rate of ∼0.2, for three sets of true DLT probabilities. These DLT probabilities are generated at common dosages from specific linear, logistic, and log-logistic dose-toxicity curves. We find that all the designs examined select the MTD much more accurately when there is a clear separation between the true DLT rate at the MTD and the rates at the dose level immediately above and below it, such as for the DLT rates generated using the chosen logistic dose-toxicity curve; the separations in these true DLT rates depend, in turn, not only on the functional form of the dose-toxicity curve but also on the investigated dose levels and the parameter set-up. The model based mTPI, TEQR, BOIN, CRM and EWOC designs perform well and assign the greatest percentages of patients to the MTD, and also have a reasonably high probability of picking the true MTD across the three dose-toxicity curves examined. Among the rule-based designs studied, the 5 + 5 a design picks the MTD as accurately as the model based designs for the true DLT rates generated using the chosen log-logistic and linear dose-toxicity curves, but requires enrolling a higher number of patients than the other designs. We also find that it is critical to pick a design that is aligned with the true DLT rate of interest. Further, we note that Phase I trials are very small in general and hence may not provide accurate estimates of the MTD. Thus our work provides a map for planning Phase I oncology trials or developing new ones.
Keywords: Accuracy of MTD selection; BOIN design, Bayesian optimal interval design; CRM, continual reassessment method; DLT, dose limiting toxicity; Dose finding; EWOC design, escalation with overdose control design; MTD, maximum tolerated dose; Model-based designs; Oncology; Phase 1 designs; Rule-based designs; TEQR design, toxicity equivalence range design; mTPI design, modified toxicity probability interval design.
Figures


References
-
- Postel-Vinay S. Redefining dose-limiting toxicity. Clin. Adv. Hematol. Oncol. 2015;13(2):87–89. - PubMed
-
- Gelmon K.A., Eisenhauer E.A., Harris A.L., Ratain M.J., Workman P. Anticancer agents targeting signaling molecules and cancer cell environment: challenges for drug development? J. Natl. Cancer Inst. 1999;91(15):1281–1287. - PubMed
-
- Sverdlov O., Wong W.K., Ryeznik Y. Adaptive clinical trial designs for phase I cancer studies. Stat. Surv. 2014;8:2–44.
-
- Braun T.M. The current design of oncology phase I clinical trials: progressing from algorithms to statistical models. Chin. Clin. Oncol. 2014;3(1):2. - PubMed
-
- Zang Y., Lee J.J. Adaptive clinical trial designs in oncology. Chin. Clin. Oncol. 2014;3(4):49. - PubMed
LinkOut - more resources
Full Text Sources
Other Literature Sources
