. 2018 Jun;83(6):1186-1197.
doi: 10.1002/ana.25251.

Integrated magnetic resonance imaging and [11 C]-PBR28 positron emission tomographic imaging in amyotrophic lateral sclerosis

Affiliations

Integrated magnetic resonance imaging and [11 C]-PBR28 positron emission tomographic imaging in amyotrophic lateral sclerosis

Mohamad J Alshikho et al. Ann Neurol. 2018 Jun.

Abstract

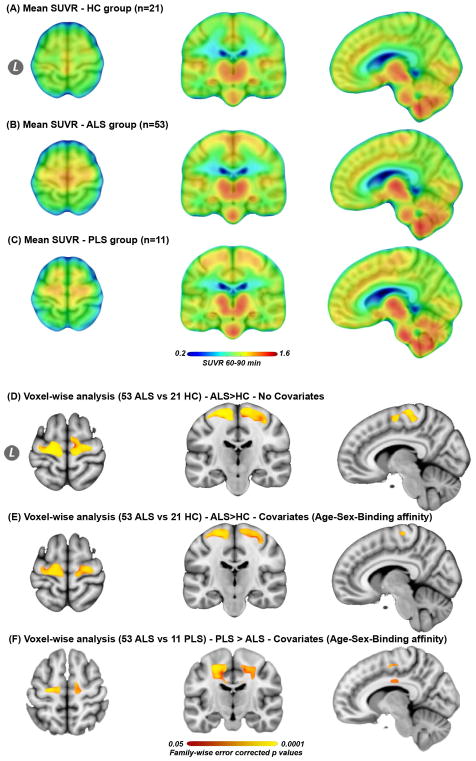
Objective: To characterize [11 C]-PBR28 brain uptake using positron emission tomography (PET) in people with amyotrophic lateral sclerosis (ALS) and primary lateral sclerosis (PLS). We have previously shown increased [11 C]-PBR28 uptake in the precentral gyrus in a small group of ALS patients. Herein, we confirm our initial finding, study the longitudinal changes, and characterize the gray versus white matter distribution of [11 C]-PBR28 uptake in a larger cohort of patients with ALS and PLS.

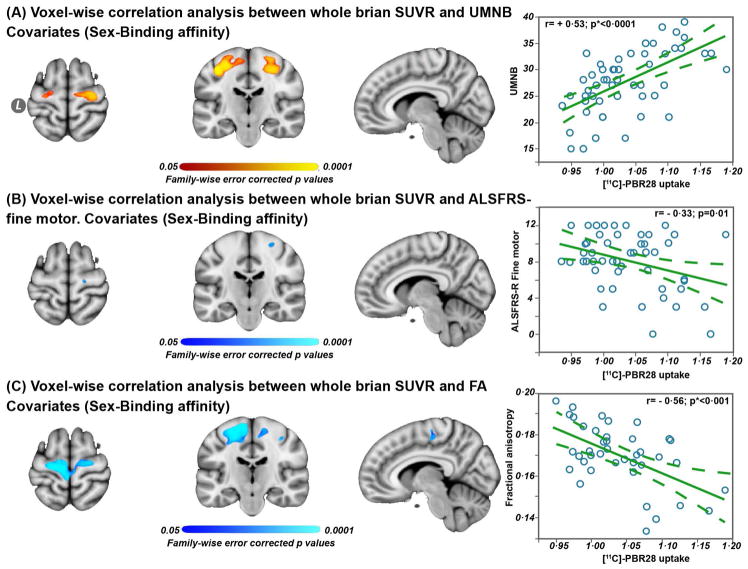
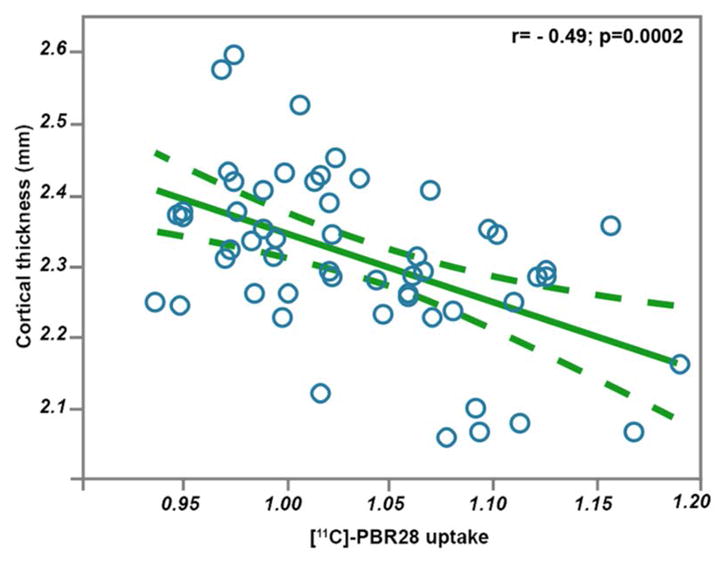
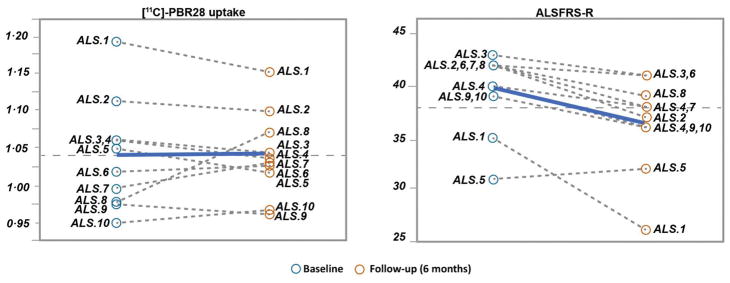
Methods: Eighty-five participants including 53 with ALS, 11 with PLS, and 21 healthy controls underwent integrated [11 C]-PBR28 PET-magnetic resonance brain imaging. Patients were clinically assessed using the Upper Motor Neuron Burden (UMNB) and the Amyotrophic Lateral Sclerosis Functional Rating Scale-Revised (ALSFRS-R). [11 C]-PBR28 uptake was quantified as standardized uptake value ratio (SUVR) and compared between groups. Cortical thickness and fractional anisotropy were compared between groups and correlated with SUVR and the clinical data. [11 C]-PBR28 uptake and ALSFRS-R were compared longitudinally over 6 months in 10 ALS individuals.

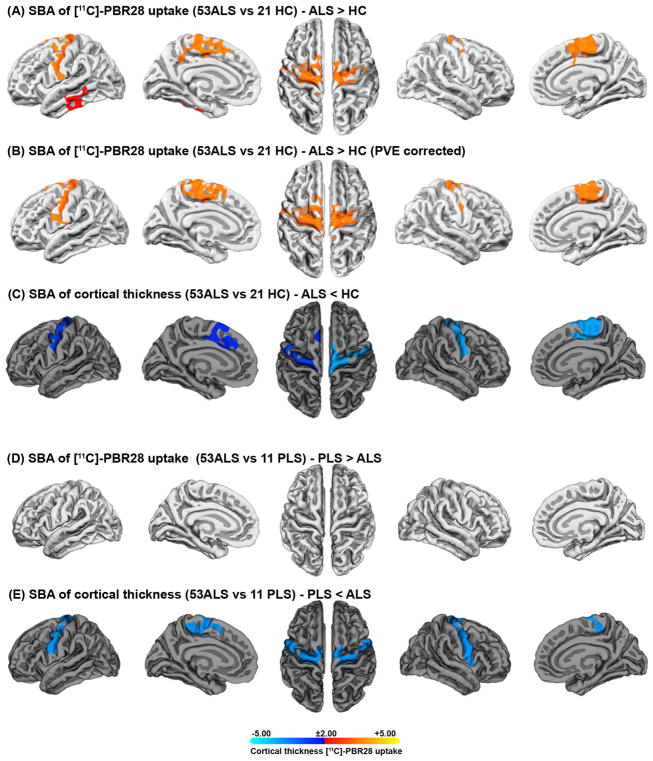
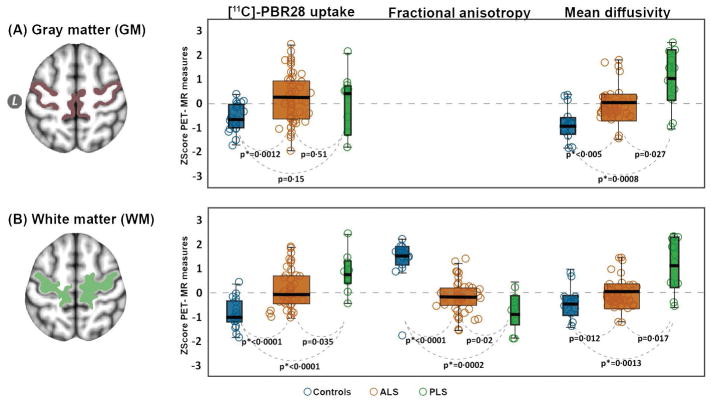
Results: Whole brain voxelwise, surface-based, and region of interest analyses revealed increased [11 C]-PBR28 uptake in the precentral and paracentral gyri in ALS, and in the subcortical white matter for the same regions in PLS, compared to controls. The increase in [11 C]-PBR28 uptake colocalized and correlated with cortical thinning, reduced fractional anisotropy, and increased mean diffusivity, and correlated with higher UMNB score. No significant changes were detected in [11 C]-PBR28 uptake over 6 months despite clinical progression.

Interpretation: Glial activation measured by in vivo [11 C]-PBR28 PET is increased in pathologically relevant regions in people with ALS and correlates with clinical measures. Ann Neurol 2018;83:1186-1197.


Conflict of interest statement

Potential conflict of interest:

No conflicts to report.

Figures

Figure 1
Figure 1. Mean [11C]-PBR28 uptake for each group and voxel-wise analyses
The mean SUVR images for 21 healthy controls HC (A), 53 ALS (B), and 11 PLS participants (C). Whole brain voxel-wise analyses between (53 ALS vs. 21 controls), and (53ALS vs. 11 PLS) revealed significantly (PFWE = 0·05–0.0001) higher [11C]-PBR28 uptake in the motor cortices in ALS compared to controls [without covariates (D), and with covariates (E)], and in PLS compared to ALS (F). All images were transformed into the standard space MNI152-1mm. (D, E) are shown at MNI coordinates (x = −8, y = −20, and z = +64), and (F) at (x = −10, y = −15, and z = +55). The color bar in A–C represents mean SUVR of [11C]-PBR28 uptake. The color bar (red to yellow) of the voxel-wise analyses (D–F) represents higher [11C]-PBR28 binding in ALS compared to controls, and in PLS compared to ALS. Video 1e web appendix shows 3D projection of the statistical maps (D–F) onto MNI152-2mm glass brain.
Figure 2
Figure 2. Surface-based analyses
Surface-based analyses of SUVR and cortical thickness between (53 ALS vs. 21 controls), and (53ALS vs. 11 PLS) show increased [11C]-PBR28 uptake in the surfaces of the motor cortices of people with ALS compared to controls. Surface-based analysis of SUVR was employed without partial volume correction PVC (A) and with PVC based on Muller-Gartner method (B). This increase in [11C]-PBR28 uptake largely co-localizes with cortical thinning (C). Surface-based analysis of SUVR comparison (with/without PVC) between PLS and ALS showed no difference in [11C]-PBR28 uptake in the motor cortices (D), while cortical thickness is reduced in PLS compared to ALS (E). Surface-based analysis was set to keep clusters that have clusterwise p-values (pcw<0·01). The statistical maps are clusterwise corrected for multiple comparisons Z=3 (P<0.001), and overlaid by the pial surface model of the left and the right hemispheres. The color bar is logarithmic (-log10 [p-value]), where red [p=0·01] to yellow [p=0·00001] represents the degree of difference in [11C]-PBR28 uptake between the groups, and blue [p=0·01] to cyan [p=0·00001] defines the degree of difference in cortical thickness between the study groups.
Figure 3
Figure 3. Whole brain voxel-wise and ROI based Pearson correlation analyses
Voxel-wise correlation analyses between whole brain SUVR vs UMNB in 53 ALS participants (A), whole brain SUVR vs ALSFRS-R fine motor domain (B), and whole brain SUVR vs fractional anisotropy – measured in the combined ROI (gray matter and subcortical white matter) (C). The significant (pFWE = 0·05–0.0001) regions are overlaid on the standard template MNI152-1mm. Data are shown at MNI coordinates (x = −8, y = −20, and z = +64). The color bar red to yellow represents positive correlation between [11C]-PBR28 binding and UMNB in ALS, and blue to cyan indicates negative correlation between [11C]-PBR28 binding and ALSFRS-R, and [11C]-PBR28 binding and fractional anisotropy, in ALS. Pearson correlation analyses were employed to study the relationships between the PET-MR measures within the combined ROI (i.e. white and gray matter) and the clinical outcomes. The dashed lines in the Pearson correlations represent 95% confidence interval, and p value is (*Bonferroni adjusted [p = 0·05/3=0·016]).
Figure 4
Figure 4
Pearson correlation analysis between cortical thickness and [11C]-PBR28 uptake in the motor cortices. This correlation is carried out in the native space of 53 ALS participants, within a combined ROI of the percental gyrus and the paracentral lobule. The dashed lines represent 95% confidence interval.
Figure 5
Figure 5. Gray and white matter comparisons between ALS and PLS
The regions of interest (ROIs) were derived from a FreeSurfer cortical reconstruction of the standard template MNI152-2mm. The box plots (controls: blue, ALS: orange; PLS: green) illustrates the difference between the groups in [11C]-PBR28 uptake, and mean diffusivity in the grey matter portions of the precentral and paracentral gyri (A) and [11C]-PBR28 uptake, fractional anisotropy, and mean diffusivity in the white matter portions for the same regions (B). The horizontal black line within each boxplot represents the median (the box contains median, 25th, and 75th percentiles). The dashed zero line is the mean of the three groups. The results of these comparisons between the groups are derived from a non-parametric Wilcoxon method for each pair. The significant difference between groups was set at p value (*Bonferroni adjusted [p = 0·05/6=0·0083]). Z scores were generated to improve visualization and standardize the scales.
Figure 6
Figure 6. Longitudinal changes in [11C]-PBR28 uptake and ALSFRS-R over six-month
The dashed lines represent the change in [11C]-PBR28 uptake and ALSFRS-R between the baseline visit and the follow-up visit after six-month in ten ALS participants. The bold-blue lines represent the group mean. No significant change was detected in [11C]-PBR28 uptake over six-month. Pearson correlation analysis between [11C]-PBR28 uptake at the baseline and [11C]-PBR28 uptake after six-month was (r= + 0·84; p = 0·0022), although ALSFRS-R progressed (0·5 points/month).

References

    1. Butovsky O, Siddiqui S, Gabriely G, et al. Modulating inflammatory monocytes with a unique microRNA gene signature ameliorates murine ALS. J Clin Invest. 2012;122(9):3063–3087. - PMC - PubMed
    1. Sargsyan SA, Monk PN, Shaw PJ. Microglia as potential contributors to motor neuron injury in amyotrophic lateral sclerosis. Glia. 2005;51(4):241–253. - PubMed
    1. Boillee S, Yamanaka K, Lobsiger CS, et al. Onset and progression in inherited ALS determined by motor neurons and microglia. Science. 2006;312(5778):1389–1392. - PubMed
    1. Brettschneider J, Toledo JB, Van Deerlin VM, et al. Microglial activation correlates with disease progression and upper motor neuron clinical symptoms in amyotrophic lateral sclerosis. PLoS One. 2012;7(6):e39216. - PMC - PubMed
    1. Henkel JS, Beers DR, Siklos L, Appel SH. The chemokine MCP-1 and the dendritic and myeloid cells it attracts are increased in the mSOD1 mouse model of ALS. Mol Cell Neurosci. 2006;31(3):427–437. - PubMed

Publication types

MeSH terms

Substances