. 2018 May 5;217(11):1728-1739.
doi: 10.1093/infdis/jiy098.

Human Coronavirus NL63 Molecular Epidemiology and Evolutionary Patterns in Rural Coastal Kenya

Affiliations

Human Coronavirus NL63 Molecular Epidemiology and Evolutionary Patterns in Rural Coastal Kenya

Patience K Kiyuka et al. J Infect Dis. .

Abstract

Background: Human coronavirus NL63 (HCoV-NL63) is a globally endemic pathogen causing mild and severe respiratory tract infections with reinfections occurring repeatedly throughout a lifetime.

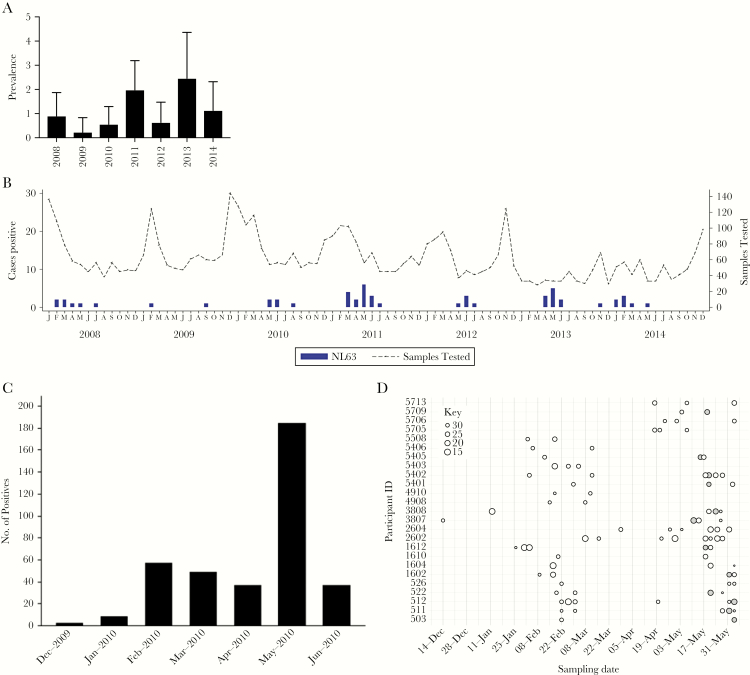
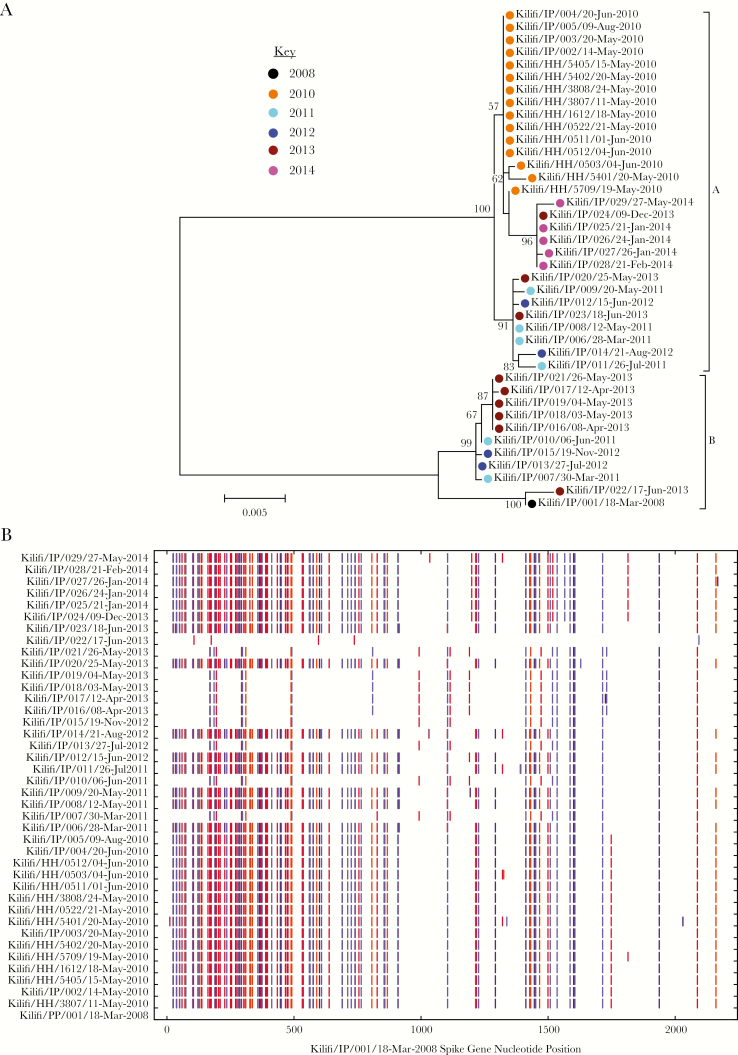
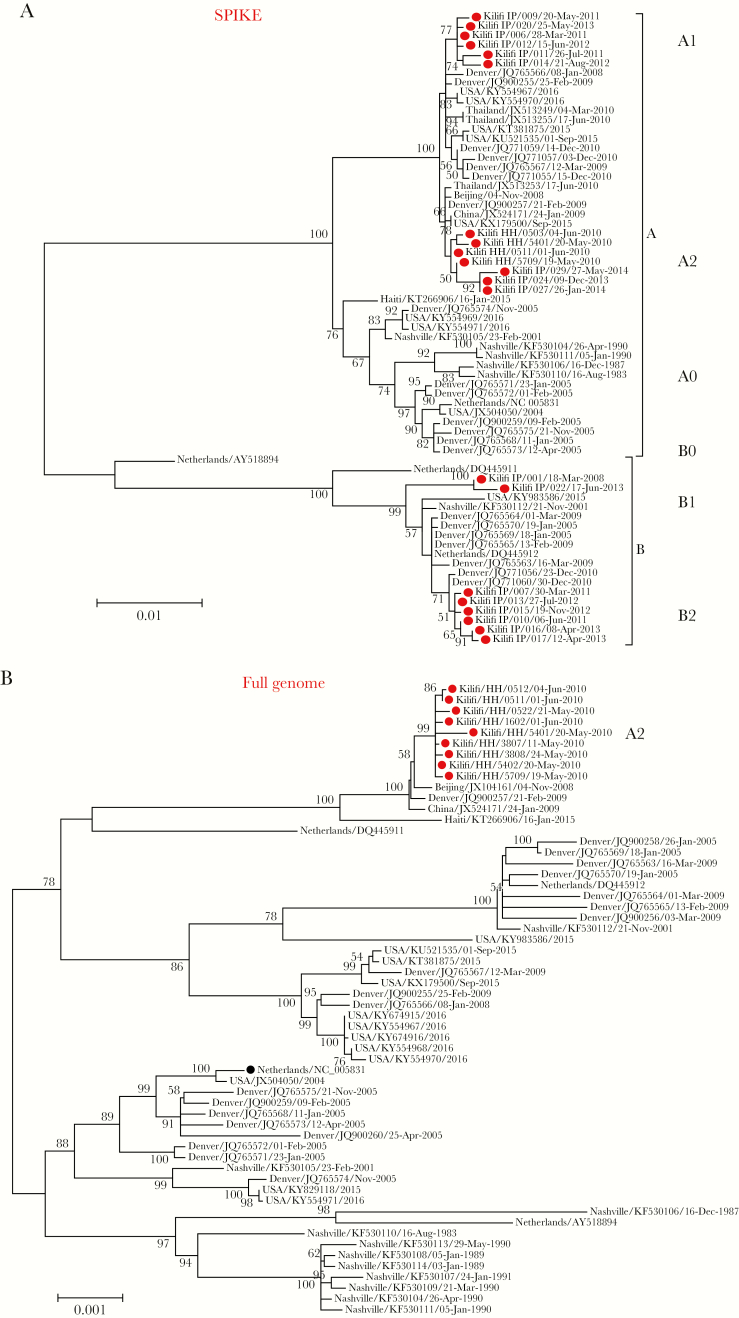
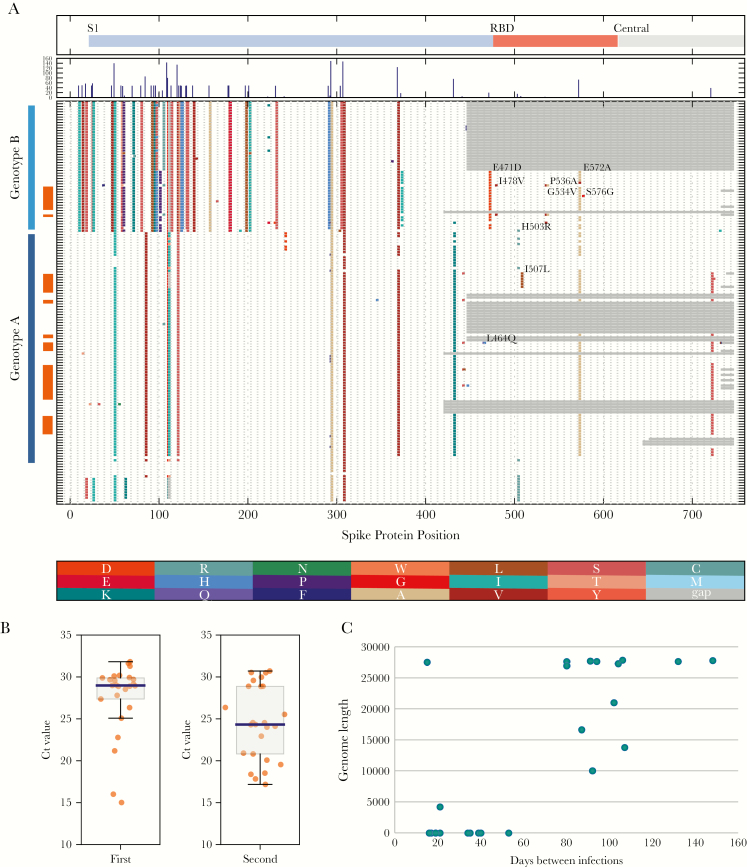
Methods: Nasal samples were collected in coastal Kenya through community-based and hospital-based surveillance. HCoV-NL63 was detected with multiplex real-time reverse transcription PCR, and positive samples were targeted for nucleotide sequencing of the spike (S) protein. Additionally, paired samples from 25 individuals with evidence of repeat HCoV-NL63 infection were selected for whole-genome virus sequencing.

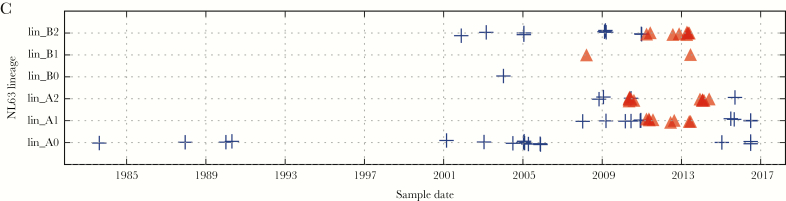
Results: HCoV-NL63 was detected in 1.3% (75/5573) of child pneumonia admissions. Two HCoV-NL63 genotypes circulated in Kilifi between 2008 and 2014. Full genome sequences formed a monophyletic clade closely related to contemporary HCoV-NL63 from other global locations. An unexpected pattern of repeat infections was observed with some individuals showing higher viral titers during their second infection. Similar patterns for 2 other endemic coronaviruses, HCoV-229E and HCoV-OC43, were observed. Repeat infections by HCoV-NL63 were not accompanied by detectable genotype switching.

Conclusions: In this coastal Kenya setting, HCoV-NL63 exhibited low prevalence in hospital pediatric pneumonia admissions. Clade persistence with low genetic diversity suggest limited immune selection, and absence of detectable clade switching in reinfections indicates initial exposure was insufficient to elicit a protective immune response.


Figures

Figure 1.
Figure 1.
Patterns of detection of human coronavirus NL63 (HCoV-NL63) in the 2 cohorts. A, Prevalence of HCoV-NL63 by year in the inpatient surveillance study at Kilifi County Hospital (KCH). B, The frequency of detection of HCoV-NL63 by month in the inpatient surveillance study at KCH, 2008–2014. C, The frequency of detection of HCoV-NL63 by month in the household cohort surveillance study. D, Temporal patterns of HCoV-NL63 detection in the 25 community participants chosen for whole-genome sequencing. Each circle indicates the date of a positive sample; the size of the circle is inversely proportional to the real-time PCR threshold cycle (Ct) value (with scale indicating Ct to circle size is shown at the left of the panel). The grey filled circles indicate samples that yielded sequence (spike or whole genome). All positive results are shown here, while for sequencing only 2 samples were selected per individual for whole-genome sequencing (see text for details).
Figure 2.
Figure 2.
The genetic diversity of the Kilifi human coronavirus NL63 (HCoV-NL63) isolates. A, A maximum likelihood phylogeny of all sequenced Kilifi HCoV-NL63 strains derived from the S1 encoding region of the spike protein. The 2 main identified genotypes (A and B) are shown. The different circle colors preceding the taxon names on the phylogenetic tree depict the different years in which the samples were collected. B, Hiliter alignment of the Kilifi spike sequences. Changes between strains within the individual genotypes in the alignment panels are shown as colored vertical bars (orange, change to A; crimson, change to T; indigo, change to G; slateblue, change to C). C, A nucleotide alignment plot showing changes in the Kilifi household genomes across their length (color change coding as in B).
Figure 2.
Figure 2.
The genetic diversity of the Kilifi human coronavirus NL63 (HCoV-NL63) isolates. A, A maximum likelihood phylogeny of all sequenced Kilifi HCoV-NL63 strains derived from the S1 encoding region of the spike protein. The 2 main identified genotypes (A and B) are shown. The different circle colors preceding the taxon names on the phylogenetic tree depict the different years in which the samples were collected. B, Hiliter alignment of the Kilifi spike sequences. Changes between strains within the individual genotypes in the alignment panels are shown as colored vertical bars (orange, change to A; crimson, change to T; indigo, change to G; slateblue, change to C). C, A nucleotide alignment plot showing changes in the Kilifi household genomes across their length (color change coding as in B).
Figure 3.
Figure 3.
Global context of the Kilifi human coronavirus NL63 (HCoV-NL63) strains and diversity in the households genomes. A, A partial spike-based maximum likelihood (ML) phylogenetic tree of the combined Kilifi and global strains. B, A full-genome–based ML phylogenetic tree of the combined Kilifi and global strains. C, Local and global temporal circulation pattern of the lineages within genotype A and B. The blue symbols represent global strains while the orange symbols represent Kilifi strains. The scale bar indicates 0.01 (A) or 0.001 (B) nucleotide substitutions per site.
Figure 3.
Figure 3.
Global context of the Kilifi human coronavirus NL63 (HCoV-NL63) strains and diversity in the households genomes. A, A partial spike-based maximum likelihood (ML) phylogenetic tree of the combined Kilifi and global strains. B, A full-genome–based ML phylogenetic tree of the combined Kilifi and global strains. C, Local and global temporal circulation pattern of the lineages within genotype A and B. The blue symbols represent global strains while the orange symbols represent Kilifi strains. The scale bar indicates 0.01 (A) or 0.001 (B) nucleotide substitutions per site.
Figure 4.
Figure 4.
A, Amino acid changes in the spike S1 domain of the human coronavirus NL63 (HCoV-NL63) from all available Kilifi and global sequences. Amino acid sequences were aligned and ordered by date of sample collection (oldest at bottom, most recent at top of figure). Sequences were ordered by genotype A (dark blue bar on Y axis) or genotype B (light blue bar) and Kilifi sequences are indicated by the orange bar. Changes in the protein relative to the reference sequence (derived from the reference genome GenBank NC_005831) are indicated by colored bars; the identity of the final amino acid is indicated at the bottom of the figure. Features of the spike protein are indicated in the diagram at the top of the figure. B, Comparison of the threshold cycle (Ct) values of the first and second infection community samples that were selected for whole-genome sequencing, with median value (blue), interquartile range (grey box), and individual Ct values (orange circles). Samples numbers were 25 first infections, 25 second infections. The difference between the first and second infection Ct values is much greater than expected by chance (P value from an unpaired t test was .0188). C, The % of full genome obtained from each of the 25 second infections, plotted as a function of the length of time between the first infection sample and the second infection sample.

References

    1. Liu L, Johnson HL, Cousens S et al. Global, regional, and national causes of child mortality: an updated systematic analysis for 2010 with time trends since 2000. Lancet 2012; 379:2151–61. - PubMed
    1. Ruuskanen O, Lahti E, Jennings LC, Murdoch DR. Viral pneumonia. Lancet 2011; 377:1264–75. - PMC - PubMed
    1. Pavia AT. Viral infections of the lower respiratory tract: old viruses, new viruses, and the role of diagnosis. Clin Infect Dis 2011; 52(Suppl 4):S284–9. - PMC - PubMed
    1. Berkley JA, Munywoki P, Ngama M et al. Viral etiology of severe pneumonia among Kenyan infants and children. JAMA 2010; 303:2051–7. - PMC - PubMed
    1. Nokes DJ, Ngama M, Bett A et al. Incidence and severity of respiratory syncytial virus pneumonia in rural Kenyan children identified through hospital surveillance. Clin Infect Dis 2009; 49:1341–9. - PMC - PubMed

Publication types

MeSH terms