. 2019 Feb;49(2):433-444.
doi: 10.1002/jmri.26181. Epub 2018 May 9.

Phase contrast MRI measurements of net cerebrospinal fluid flow through the cerebral aqueduct are confounded by respiration

Affiliations

Phase contrast MRI measurements of net cerebrospinal fluid flow through the cerebral aqueduct are confounded by respiration

Jolanda M Spijkerman et al. J Magn Reson Imaging. 2019 Feb.

Abstract

Background: Net cerebrospinal fluid (CSF) flow through the cerebral aqueduct may serve as a marker of CSF production in the lateral ventricles, and changes that occur with aging and in disease.

Purpose: To investigate the confounding influence of the respiratory cycle on net CSF flow and stroke volume measurements.

Study type: Cross-sectional study.

Subjects: Twelve young, healthy subjects (seven male, age range 19-39 years, average age 28.3 years).

Field strength/sequence: Phase contrast MRI (PC-MRI) measurements were performed at 7T, with and without respiratory gating on expiration and on inspiration. All measurements were repeated.

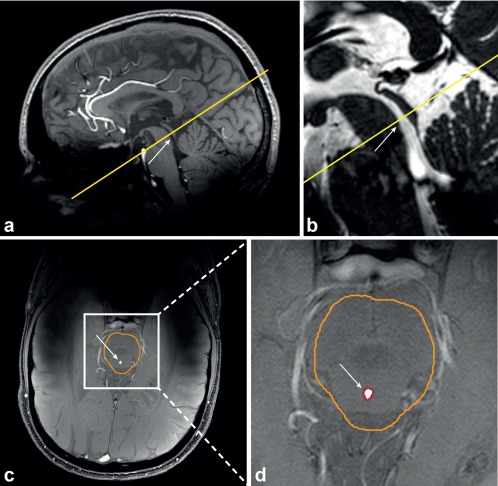
Assessment: Net CSF flow and stroke volume in the aqueduct, over the cardiac cycle, was determined.

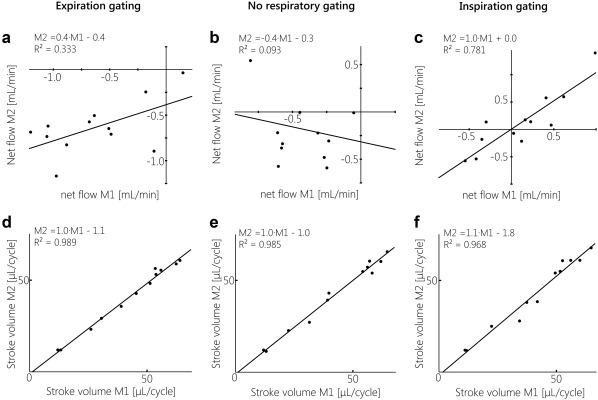
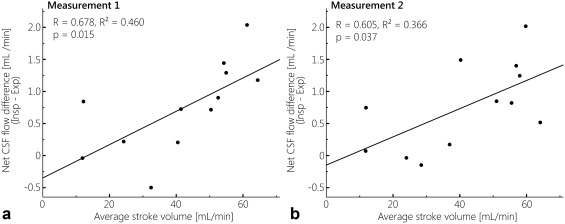
Statistical tests: Repeatability was determined using the intraclass correlation coefficient (ICC) and linear regression analysis between the repeated measurements. Repeated measures analysis of variance (ANOVA) was performed to compare the measurements during inspiration/expiration/no gating. Linear regression analysis was performed between the net CSF flow difference (inspiration minus expiration) and stroke volume.

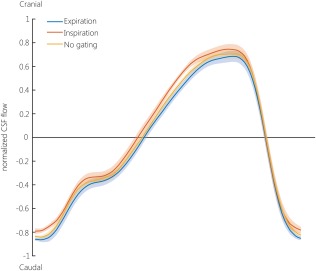
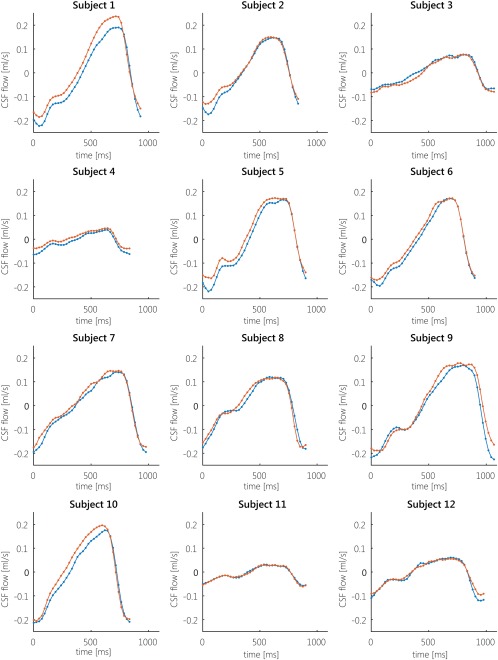
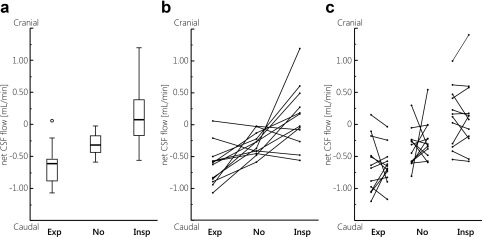
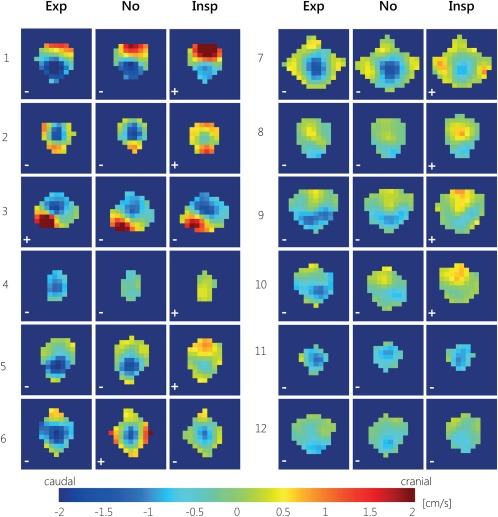
Results: Net CSF flow (average ± standard deviation) was 0.64 ± 0.32 mL/min (caudal) during expiration, 0.12 ± 0.49 mL/min (cranial) during inspiration, and 0.31 ± 0.18 mL/min (caudal) without respiratory gating. Respiratory gating did not affect stroke volume measurements (41 ± 18, 42 ± 19, 42 ± 19 μL/cycle for expiration, no respiratory gating and inspiration, respectively). Repeatability was best during inspiration (ICC = 0.88/0.56/-0.31 for gating on inspiration/expiration/no gating). A positive association was found between average stroke volume and net flow difference between inspiration and expiration (R = 0.678/0.605, P = 0.015/0.037 for the first/second repeated measurement).

Data conclusion: Measured net CSF flow is confounded by respiration effects. Therefore, net CSF flow measurements with PC-MRI cannot in isolation be directly linked to CSF production.

Level of evidence: 1 Technical Efficacy: Stage 2 J. Magn. Reson. Imaging 2019;49:433-444.

Keywords: 7T MRI; CSF stroke volume; aqueduct of Sylvius; cerebral aqueduct; cerebrospinal fluid; net CSF flow.


Figures

Figure 1
Figure 1
Slice planning of the PC‐MRI scan (single slice, yellow) for Volunteer 5, relative to a whole‐brain 3D T1‐weighted TFE scan (A) and a whole‐brain T2‐weighted 3D balanced gradient echo scan (B), the corresponding, manually drawn, brain stem ROI (orange) in the magnitude image (C), and the automatically determined aqueduct ROI (red) (D). The cerebral aqueduct is indicated by the white arrow.
Figure 2
Figure 2
Average normalized CSF velocity in the aqueduct over the cardiac cycle, averaged over both repeated measurements and all subjects, during expiration (blue), inspiration (orange), and no gating (yellow). The CSF flow curves were interpolated (using cubic interpolation with the MatLab function interp1) to 100 timepoints (0–100% of the cardiac cycle). As triggering was performed using a peripheral pulse oximeter, the cardiac cycle starts around peak‐systole. The cardiac cycle duration varied between 857–1090 msec. The line represents the average CSF velocity, the transparent band represents the SEM. The normalization was performed per subject, by dividing by the maximum absolute velocity of any of the six measurements (three respiratory conditions, each measured twice).
Figure 3
Figure 3
Individual CSF flow profiles during inspiration (orange) and expiration (blue) for all subjects, for the first measurement. Positive CSF flow is in cranial direction, negative CSF flow is in caudal direction. For most subjects, the CSF flow profile during inspiration is above the CSF flow profile during expiration. Subject 3 showed cranial net flow during expiration, and caudal flow during inspiration. Subjects 11 and 12 showed similar flows during inspiration and expiration.
Figure 4
Figure 4
A: Boxplots showing the mean net CSF flow (over both measurements) measured in each subject, during expiration gating (Exp), no gating (No), and inspiration gating (Insp). Outliers are represented by the open circles. Except for one outlier, only negative (caudal) flows were measured during expiration, while during inspiration often positive (cranial) flows were measured. B: Mean net CSF flow measured in each subject. Generally, the net CSF flow measured without respiratory gating is in between the net CSF flows measured during expiration and inspiration. C: Net CSF flow measured in each subject during the first and second measurement.
Figure 5
Figure 5
CSF net flow for all aqueduct voxels during expiration gating (Exp), inspiration gating (Insp), and without respiratory gating (No) for all 12 subjects, for the first measurement. For most subjects, during expiration gating most voxels show caudal net CSF flow, and during inspiration gating more voxels show (larger) cranial net CSF flow. The net CSF flow directions are indicated with ± symbols for cranial/caudal net CSF flow.
Figure 6
Figure 6
Linear regression analysis between the first (independent variable) and second (dependent variable) measurements for net CSF flow (A–C) and stroke volume (D–F), for gating on expiration, no respiratory gating, and gating on inspiration. For net CSF flow, only gating on inspiration showed very good repeatability, as the regression line was very close to M2 = M1; a fair correlation between both measurements was seen for gating on expiration, and no significant correlation was found between both measurements without respiratory gating. For stroke volume, repeatability was good for all respiratory conditions, with regression lines approximating M2 = M1.
Figure 7
Figure 7
Regression analysis between the net CSF flow difference for inspiration minus expiration, and the average stroke volume for expiration and inspiration, for measurement 1 (A) and measurement 2 (B). Significant, positive associations were found for both measurements.

References

    1. Jessen NA, Munk ASF, Lundgaard I, Nedergaard M. The glymphatic system: a beginner's guide. Neurochem Res 2015;40:2583–2599. - PMC - PubMed
    1. Spector R, Robert Snodgrass S, Johanson CE. A balanced view of the cerebrospinal fluid composition and functions: Focus on adult humans. Exp Neurol 2015;273:57–68. - PubMed
    1. May C, Kaye JA, Atack JR, Schapiro MB, Friedland RP, Rapoport SI. Cerebrospinal fluid production is reduced in healthy aging. Neurology 1990;40:500–503. - PubMed
    1. Stoquart‐ElSankari S, Balédent O, Gondry‐Jouet C, Makki M, Godefroy O, Meyer M‐E. Aging effects on cerebral blood and cerebrospinal fluid flows. J Cereb Blood Flow Metab 2007;27:1563–1572. - PubMed
    1. Silverberg GD, Heit G, Huhn S, et al. The cerebrospinal fluid production rate is reduced in dementia of the Alzheimer's type. Neurology 2001;57:1763–1766. - PubMed

Publication types