. 2018 Sep 1;120(3):893-909.
doi: 10.1152/jn.00643.2017. Epub 2018 May 9.

Neck muscle spindle noise biases reaches in a multisensory integration task

Affiliations

Neck muscle spindle noise biases reaches in a multisensory integration task

Parisa Abedi Khoozani et al. J Neurophysiol. .

Abstract

Reference frame transformations (RFTs) are crucial components of sensorimotor transformations in the brain. Stochasticity in RFTs has been suggested to add noise to the transformed signal due to variability in transformation parameter estimates (e.g., angle) as well as the stochastic nature of computations in spiking networks of neurons. Here, we varied the RFT angle together with the associated variability and evaluated the behavioral impact in a reaching task that required variability-dependent visual-proprioceptive multisensory integration. Crucially, reaches were performed with the head either straight or rolled 30° to either shoulder, and we also applied neck loads of 0 or 1.8 kg (left or right) in a 3 × 3 design, resulting in different combinations of estimated head roll angle magnitude and variance required in RFTs. A novel three-dimensional stochastic model of multisensory integration across reference frames was fitted to the data and captured our main behavioral findings: 1) neck load biased head angle estimation across all head roll orientations, resulting in systematic shifts in reach errors; 2) increased neck muscle tone led to increased reach variability due to signal-dependent noise; and 3) both head roll and neck load created larger angular errors in reaches to visual targets away from the body compared with reaches toward the body. These results show that noise in muscle spindles and stochasticity in general have a tangible effect on RFTs underlying reach planning. Since RFTs are omnipresent in the brain, our results could have implications for processes as diverse as motor control, decision making, posture/balance control, and perception. NEW & NOTEWORTHY We show that increasing neck muscle tone systematically biases reach movements. A novel three-dimensional multisensory integration across reference frames model captures the data well and provides evidence that the brain must have online knowledge of full-body geometry together with the associated variability to plan reach movements accurately.

Keywords: body geometry; computational modeling; multisensory integration; muscle spindle noise; stochastic reference frame transformation.


Figures
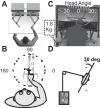
Fig. 1.
Fig. 1.
Apparatus. A: KINARM end-point robot arrangement [from http://www.bkintechnologies.com/ with permission from BKIN Technologies Ltd., Kingston, Ontario, Canada]. B: visual targets were distributed evenly on a 10-cm-radius circle. The hand was shifted 2.5 cm either vertically or horizontally while the visual indicator stayed at the center. C: picture of the pulley system for measuring the head roll and loading the neck; here, the participant had 30° (30 deg) clockwise head roll and neck load on the left side. D: schematic of the condition represented in C. The attached indicator on the helmet was used to measure the head angle.
Fig. 2.
Fig. 2.
Experimental conditions. Participants performed the reaching task under 9 different combinations of head roll (HR) and neck load (NL) conditions during our experiment. CCW, counterclockwise; CW, clockwise.
Fig. 3.
Fig. 3.
Model schematic. To perform the reach movement successfully, initial hand position (IHP) is calculated in both visual and proprioceptive coordinates. In visual coordinates, IHP is computed by transforming proprioceptive information into visual coordinates. Visual and transformed proprioceptive information are weighted and combined based on Bayesian theory. Movement vector is calculated by comparing the estimated IHP and target positions. The same process takes place in proprioceptive coordinates to generate a proprioceptive IHP estimate. With the use of inverse kinematics, the transformed movement vector and IHP can be combined to calculate the movement plan based on the required changes in joint angles. The blue box represents the reference frame transformation (RFT) process. RFTs are performed by considering eye and head orientation as well as the translations (transl.) between rotation centers of the body. Head orientation is estimated by combining visual/vestibular and neck muscle spindle information using Bayesian statistics (see materials and methods for details). αINV, multisensory weight for visual information in proprioceptive coordinates; αMV, multisensory integration (MSI) weight for visual information in visual coordinates; θ1 and θ2, joint angles in shoulder-centered coordinates; 3D, 3-dimensional; deg, degrees; rel., relative to.
Fig. 4.
Fig. 4.
Reach error curves. Reach errors are calculated for each target by subtracting the proprioceptive or visual hand-target direction from the performed reach movement. Solid lines represent upward/rightward shifts. A and C: proprioceptive (Prop.) reach error curves: reach errors for horizontal hand shift (A) and reach errors for vertical hand shift (C). B and D: visual reach error curves: reach errors for horizontal shift (B) and reach errors for vertical shift (D). deg, Degrees.
Fig. 5.
Fig. 5.
Sober and Sabes (2003) model fit on the data. A and B: reach error curves are normalized to 0 by subtracting the 0 hand offset from the other hand offsets. deg, Degrees; Prop., proprioceptive.
Fig. 6.
Fig. 6.
Effect of varying head roll on reach movement behavior. A: reach error curves [solid line for initial hand position (IHP) shifts to right and dotted line for IHP shifts to left] shifted upward for clockwise head roll and downward for counterclockwise head roll compared with the head upright condition [n-way ANOVA, F(2,98) = 11.85, *P < 0.01]. B: movement variability increased significantly for rolled head conditions compared with the head upright condition (paired t-test, *P < 0.01). C: visual weights derived by fitting the Sober and Sabes (2003) model on the data. We did not find any significant change in visual weights in visual coordinates for different head roll conditions, whereas the visual weights significantly decreased in proprioceptive (Prop.) coordinates. Significance was tested using paired t-test (*P < 0.05 is considered as a significant difference). deg, Degrees.
Fig. 7.
Fig. 7.
Effect of applying neck load on reach movement behavior. A: reach error curves [solid line for initial hand position (IHP) shifts to right and dotted line for IHP shifts to left] are shifted upward for applying neck load on the right [n-way ANOVA, F(2,98) = 6.12, *P < 0.01]. Shift in reach error curves for applying neck load on left is not statistically significant. B: movement variability is increased significantly for applying the load on the left compared with the no load condition [paired t-test, t(8) = 2.7552, *P = 0.0283]. C: visual weights derived by fitting the Sober and Sabes (2003) model on the data. We only observed a significant change in visual weight in proprioceptive (Prop.) coordinates due to applying neck load on the left side. Significance was tested using paired t-test (*P < 0.05 is considered as a significant difference). deg, Degrees.
Fig. 8.
Fig. 8.
Effect of different experimental conditions on reaching movement variability. Head upright and no load condition (considered as the control condition) and the combined head roll and neck load (HR/NL) conditions are sorted based on the expected increase in the variability based on the signal-dependent noise hypothesis right and left of the control condition. Rolling the head consistently increased the variability compared with the control condition. Significance was tested using paired t-test (*P < 0.05 is considered as a significant difference). deg, Degrees.
Fig. 9.
Fig. 9.
Model fit for a sample participant (S6). Model fits on the reach error curves for different initial hand positions (IHPs) and head roll (HR) and neck load (NL) conditions is shown. A and B: model fit on the reach error curves for varying head orientation without applying neck load: solid line represents results for IHP shifts to the right, and dotted line represents results for IHP shifts to the left (A); solid line represents results for IHP shifts up, and dotted line represents results for IHP shifts down (B). C: model fit on the changes in movement variability due to varying HR and NL conditions. DF: model fit on reach errors for varying NL for different HR conditions. Only data for horizontal shifts are presented. Results for vertical hand shifts are similar. deg, Degrees.
Fig. 10.
Fig. 10.
Model prediction vs. observed data for each individual participant. Data for each individual participant was fitted to our model. Each color represents an individual participant. A: model prediction vs. observed data for reach errors. B: model prediction vs. observed data for reach variability. C: same data as in B grouped into bins of 0.25 deg2 (mean and standard error). Gray box represents the confidence interval for predicted variances based on our model. deg, Degrees.
Fig. 11.
Fig. 11.
Residual analysis: normal probability plot. Probability plot is depicted for each participant different colors. As can be seen, the residual of our model fit compared with the participants’ data has almost a normal distribution for all of the participants.
Fig. A1.
Fig. A1.
Effect of varying the reliability of neck muscle (NM) spindle signals vs. visual/vestibular (V/V) signals. Head angle is estimated by combining the neck muscle spindle information with combined visual and vestibular information using the Bayesian method; therefore, the effect of applying neck load depends on 2 factors: 1) absolute variability of head angle estimation and 2) relative reliability of neck muscle spindle information compared with visual/vestibular information. A and B: lower absolute value for head angle estimation variability: this lower variability results from the high reliability of both visual/vestibular and neck muscle information. Therefore, the up-/downward shifts induced due to applying neck load are higher compared with when the head angle estimation variability is high (C and D). In addition to the absolute head angle estimation variability, the relative reliability of neck muscle spindle vs. visual/vestibular information impacts how much applying neck load biases the reaching movement. A and C: the lower the reliability of neck muscle spindle information vs. visual/vestibular information, the lower the up-/downward shifts in reaching error curves. B and D: increasing the relative reliability of neck muscle information increases the up-/downward shifts in reaching errors by applying neck load. deg, Degrees.
Fig. A2.
Fig. A2.
Biases in head angle estimation due to different head roll (HR) and neck load (NL) conditions. Applying neck load biased the head angle estimation toward the applied load for all head angles. Error bars are standard deviations. deg, Degrees.
Fig. A3.
Fig. A3.
Reference frame transformation (RFT) process mechanism. A: different coordinates in our RFT module. Difference in the center of rotation between gaze-centered coordinate and head-centered coordinate resulted in an asymmetry of transformed hand position for 30° clockwise (30deg CW) vs. counterclockwise (CCW) head rolls. B: detailed example of the higher effect of stochastic RFTs on movement away from the body compared with movements toward the body for 30° CCW head roll. Actual Scene: in our experiment, participants fixated their eyes on the center cross, and the visual feedback of the hand indicated their hand on the center as well. Actual hand position is shifted to the right in this example, and it is occluded. Box 1: retinal image of the target is rotated 30° CW; we ignored the torsion effects on retinal projection. Proprioceptive hand position is transformed using our RFT module (we assumed that head roll estimation is erroneous; 35°). head cent., Head-centered. Box 2: initial hand position is estimated by combining visual information and transformed proprioceptive information of the hand. Then, the movement vector (MV) is calculated by subtracting target position from the initial hand position. MSI, multisensory integration. Box 3: calculated movement vector is transformed to the proprioceptive (Prop.) coordinate using the RFT module. Box 4: comparing the planned movement with the movement only considering visual information. As can be seen, the misestimation in head angle created larger error for movement away from body vs. movement toward the body. This happened due to the offset in the center of rotations between different coordinates.
Fig. A4.
Fig. A4.
Visual weights for multisensory integration. A: visual weights increase in visual (Vis.) coordinate due to decreased reliability of proprioceptive information caused by stochastic reference frame transformations. B: visual weights in proprioceptive (Prop.) coordinate: rolling the head 30° counterclockwise did not affect the visual weights, whereas rolling the head 30° clockwise decreased visual weights. The reason for this asymmetry is the nonlinearity in the inverse kinematic process. Error bars are standard error of the mean. *Significance was tested using paired t-test (P < 0.05 is considered as a significant difference). HR, head roll; NL, neck load.

References

    1. Abedi Khoozani P, Standage D, Blohm G. An approximate normalization model for multisensory integration across reference frames (Abstract). Annual Meeting of Society for Neuroscience. San Diego, CA, 2016.;
    1. Alberts BB, Selen LP, Bertolini G, Straumann D, Medendorp WP, Tarnutzer AA. Dissociating vestibular and somatosensory contributions to spatial orientation. J Neurophysiol 116: 30–40, 2016. doi:10.1152/jn.00056.2016. - DOI - PMC - PubMed
    1. Alikhanian H, de Carvalho SR, Blohm G. Quantifying effects of stochasticity in reference frame transformations on posterior distributions. Front Comput Neurosci 9: 82, 2015. doi:10.3389/fncom.2015.00082. - DOI - PMC - PubMed
    1. Andersen RA, Buneo CA. Intentional maps in posterior parietal cortex. Annu Rev Neurosci 25: 189–220, 2002. doi:10.1146/annurev.neuro.25.112701.142922. - DOI - PubMed
    1. Angelaki DE, Cullen KE. Vestibular system: the many facets of a multimodal sense. Annu Rev Neurosci 31: 125–150, 2008. doi:10.1146/annurev.neuro.31.060407.125555. - DOI - PubMed

Publication types

LinkOut - more resources