. 2018 Sep 1;120(3):926-941.
doi: 10.1152/jn.00673.2017. Epub 2018 May 9.

Hierarchical stimulus processing in rodent primary and lateral visual cortex as assessed through neuronal selectivity and repetition suppression

Affiliations

Hierarchical stimulus processing in rodent primary and lateral visual cortex as assessed through neuronal selectivity and repetition suppression

Dzmitry A Kaliukhovich et al. J Neurophysiol. .

Abstract

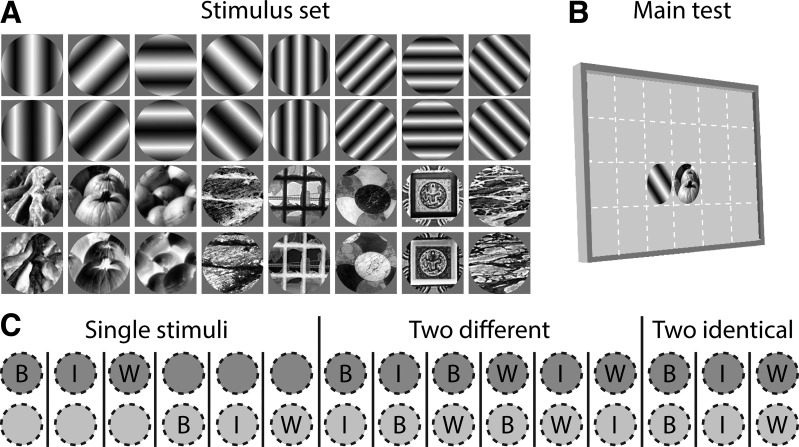
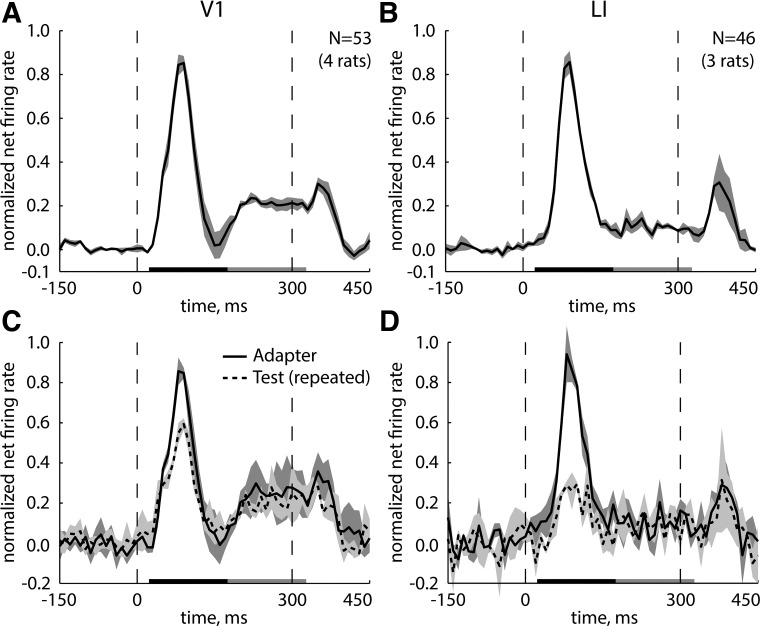
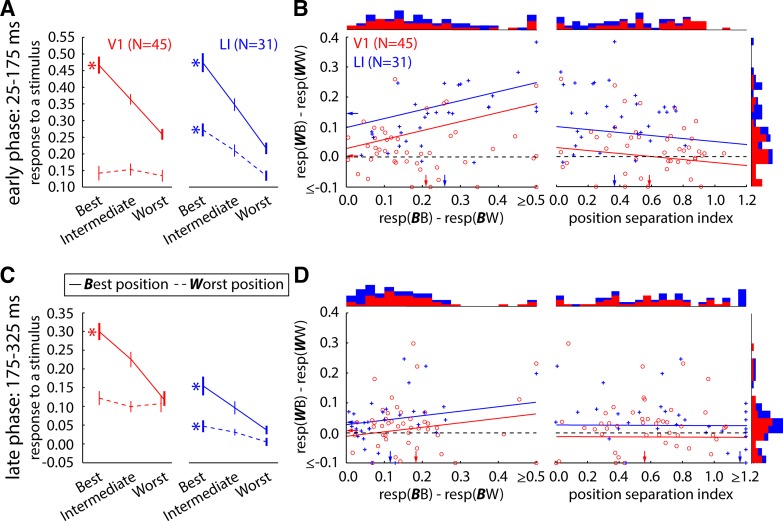
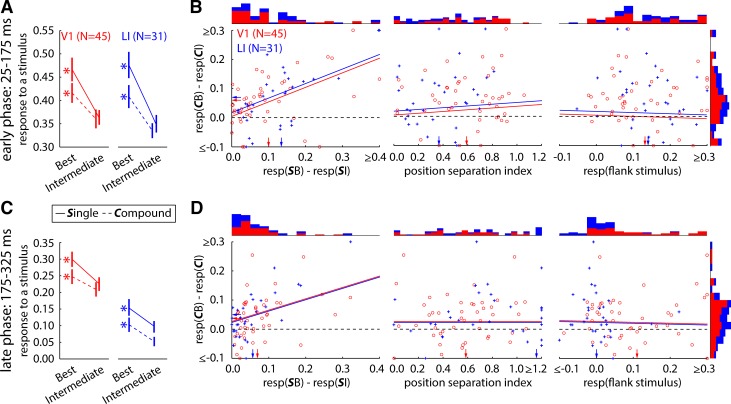
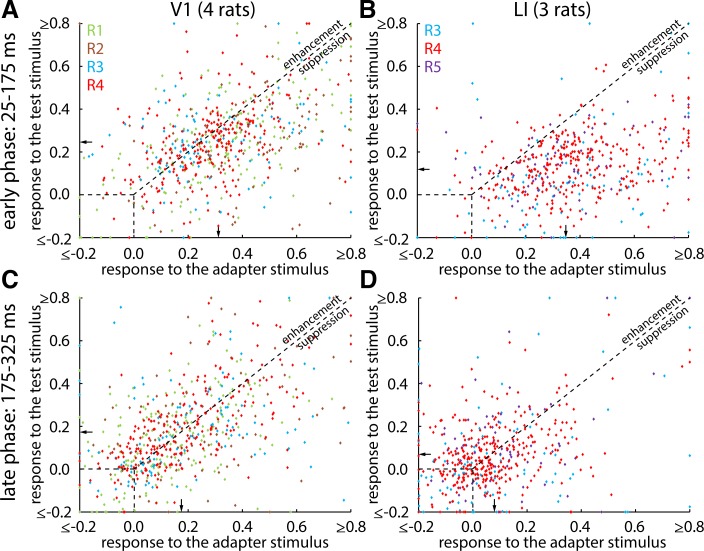
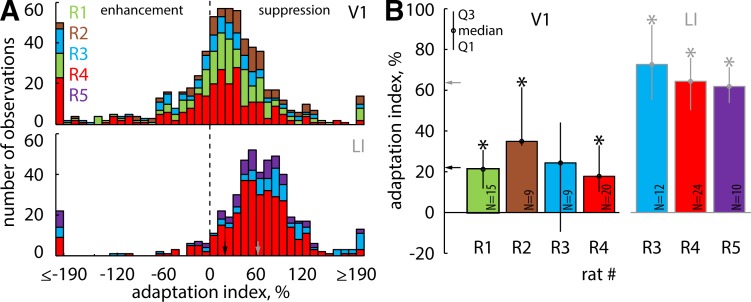
Similar to primates, visual cortex in rodents appears to be organized in two distinct hierarchical streams. However, there is still little known about how visual information is processed along those streams in rodents. In this study, we examined how repetition suppression and position and clutter tolerance of the neuronal representations evolve along the putative ventral visual stream in rats. To address this question, we recorded multiunit spiking activity in primary visual cortex (V1) and the more downstream visual laterointermediate (LI) area of head-restrained Long-Evans rats. We employed a paradigm reminiscent of the continuous carry-over design used in human neuroimaging. In both areas, stimulus repetition attenuated the early phase of the neuronal response to the repeated stimulus, with this response suppression being greater in area LI. Furthermore, stimulus preferences were more similar across positions (position tolerance) in area LI than in V1, even though the absolute responses in both areas were very sensitive to changes in position. In contrast, the neuronal representations in both areas were equally good at tolerating the presence of limited visual clutter, as modeled by the presentation of a single flank stimulus. When probing tolerance of the neuronal representations with stimulus-specific adaptation, we detected no position tolerance in either examined brain area, whereas, on the contrary, we revealed clutter tolerance in both areas. Overall, our data demonstrate similarities and discrepancies in processing of visual information along the ventral visual stream of rodents and primates. Moreover, our results stress caution in using neuronal adaptation to probe tolerance of the neuronal representations. NEW & NOTEWORTHY Rodents are emerging as a popular animal model that complement primates for studying higher level visual functions. Similar to findings in primates, we demonstrate a greater repetition suppression and position tolerance of the neuronal representations in the downstream laterointermediate area of Long-Evans rats compared with primary visual cortex. However, we report no difference in the degree of clutter tolerance between the areas. These findings provide additional evidence for hierarchical processing of visual stimuli in rodents.

Keywords: clutter tolerance; position tolerance; rats; repetition suppression; ventral stream.


Figures

Fig. 1.
Fig. 1.
Stimulus set (A), outline of the main test (B), and stimulus conditions in the main test (C). A: stimulus set included 8 grayscale gratings (first row) and 8 grayscale patches of natural images (third row) along with the copies of those stimuli with the reversed contrast polarity (second and fourth rows). All stimuli were presented in a circular aperture on a uniform gray background. B: the head-restrained animals were passively viewing visual stimuli presented at the two neighboring positions within a receptive field of the examined multiunit site. Each multiunit site was tested with 3 single stimuli, with 2 of them evoking a strong (“B”) and very little (or no; “W”) response, respectively, and the third stimulus generating an intermediate (“I”) response. Dashed white lines on the screen depict different tested positions and were invisible to the animals during actual experiments. C: each stimulus condition in the main test consisted of a simultaneous presentation of either a single stimulus, two different stimuli, or two identical stimuli. Only one stimulus could have been presented at each of the two tested positions at a time. Each single stimulus could have been presented at either position, and the positions for the simultaneous presentation of two different stimuli could have been reversed. Each stimulus condition is schematically depicted by 2 dashed circles, and the symbols within these circles denote the single stimuli presented at those positions. Note that the top and bottom rows of circles correspond to the two tested positions (highlighted in dark and light gray shading).
Fig. 2.
Fig. 2.
Neuronal responses with visual stimulation and stimulus repetition in the main test. A and B: overall neuronal responses to visual stimuli irrespective of their type and presentation order. C and D: neuronal responses to the first (“adapter,” solid line) and repeated (“test,” dashed line) presentation of the same visual stimulus. Data are sorted per brain area (A and C, primary visual cortex, VI; B and D, laterointermediate area, LI). Population peristimulus time histograms were constructed by applying a moving average with a width of the boxcar kernel of 10 ms and a step of 10 ms. Mean activity is plotted at the center of the corresponding time bins (e.g., response at 0 ms, stimulus onset, corresponds to the mean response in a time window from −5 to 5 ms). Dashed vertical lines indicate stimulus onset and offset. Horizontal black and gray bars denote the early (25–175 ms after stimulus onset) and late (175–325 ms) phase of the neuronal response, respectively. N indicates the number of analyzed multiunit sites pooled across the tested animals, with the number of animals indicated in parentheses. Shaded bands indicate the across-animal SE.
Fig. 3.
Fig. 3.
Effect of presentation position on stimulus selectivity. A and C: mean responses to the single stimuli at each of the two tested positions in the main test. Best position (solid line) refers to one of the two tested positions of each analyzed multiunit site that showed a higher average response to the three single stimuli than the other one. The latter position is labeled worst (dashed line). “Best” and “worst” along the x-axis refer to the most and least effective stimuli presented at the best position, respectively, with the third stimulus labeled “intermediate.” Bars denote SE. N indicates the number of analyzed multiunit sites. *P < 0.005, significant difference in response between the most and least effective stimuli (2-sided Wilcoxon matched-pairs test). Data for primary visual cortex (V1) and the laterointermediate area (LI) are red and blue, respectively, and are presented separately for the early (A and B) and late (C and D) phase of the neuronal response. B and D: stimulus selectivity at the worst position as a function of stimulus selectivity at the best position and spatial separation between the two tested positions. The spatial separation between the two positions is characterized by the position separation index (see materials and methods). Each data point (V1, open circles; LI, crosses) represents a single analyzed multiunit site. resp(XY) denotes response to the stimulus Y presented at position X, with “B” and “W” corresponding to the best and worst position/stimulus, respectively. Lines in each panel depict a relationship between the corresponding predictor (x-axis) and the degree of stimulus selectivity at the worst position (V1, red; LI, blue). Distributions and arrows correspond to the marginal distributions and mean values of the presented data along the corresponding axes. For the sake of illustration, values beyond the limits of each axis are assigned a marginal value along that axis and presented as thus (denoted by ≤ and ≥).
Fig. 4.
Fig. 4.
Effect of visual clutter on stimulus selectivity. A and C: mean responses to the single stimuli when presented in isolation vs. together with a flank stimulus. Simultaneous presentation of a single stimulus along with a flank stimulus is referred to as a compound stimulus. Best position (solid line) refers to one of the two tested positions of each analyzed multiunit site that showed a higher average response to the three single stimuli than the other one. Bars denote SE. N indicates the number of analyzed multiunit sites. *P < 0.005, significant difference in response between the most and least effective stimuli (2-sided Wilcoxon matched-pairs test). Data are presented for each phase of the neuronal response (A and B, early; C and D, late) and each brain area (V1, primary visual cortex, red; LI, laterointermediate, blue) separately. Solid and dashed lines correspond to data for the single and compound stimuli, respectively. B and D: stimulus selectivity for the compound stimuli as a function of stimulus selectivity for the single stimuli, spatial separation between the two tested positions, and the response to a flank stimulus. resp(XY) denotes response to stimulus Y presented either in isolation (X = S) or together with a flank stimulus (X = C), with Y = B and Y = I corresponding to the single best and intermediate stimuli, respectively. Lines in each panel depict a relationship between the corresponding predictor (x-axis) and the degree of stimulus selectivity at the worst position (V1, red; LI, blue). Distributions and arrows correspond to the marginal distributions and mean values of the presented data along the corresponding axes. For the sake of illustration, values beyond the limits of each axis are assigned a marginal value along that axis and presented as thus (denoted by ≤ and ≥).
Fig. 5.
Fig. 5.
Responses to visual stimuli presented as adapter and test. Each data point represents a single stimulus condition with a significant excitatory response. Each analyzed multiunit site could have contributed multiple data points (maximum = 15), with all of them being independent of each other. Data are pooled across all analyzed multiunit sites and rats, irrespective of a type of stimulus condition (presentation of a single stimulus, two different stimuli, or two identical stimuli). The responses are compared separately for each brain area (A and C, primary visual cortex, V1; B and D, laterointermediate, LI) and phase of the neuronal response (A and B, early; C and D, late). Different colors correspond to the data of different rats, with RX denoting the data of rat X. Arrows indicate the median values of the data along the corresponding axes after exclusion of stimulus conditions with both responses being nonpositive. For the sake of illustration, the values beyond the limits of each axis are assigned a marginal value along that axis and presented as thus (denoted by ≤ and ≥). Note that the data points, except those with both coordinates being nonpositive, lying below and above the diagonal correspond to the cases of response suppression and response enhancement with stimulus repetition, respectively.
Fig. 6.
Fig. 6.
Adaptation indexes for the responses computed in the early phase of the neuronal response. A: distributions of the adaptation indexes computed for each data point in Fig. 5, A and B, excluding those with both coordinates (responses) being nonpositive. Top and bottom graphs correspond to the data of primary visual cortex (V1) and laterointermediate area (LI), respectively, with both sharing the same abscissa. Positive and negative adaptation indexes correspond to the cases of response suppression and response enhancement with stimulus repetition, respectively, with the value of 0 indicating no response modulation. Bin width is 10%. B: median adaptation indexes computed across multiunit sites for each rat and brain area separately. The bars denote the 25th (Q1) and 75th (Q3) percentiles. N indicates the number of analyzed multiunit sites. *P < 0.005, significant difference from 0 (2-sided Wilcoxon signed-rank test). Black and gray arrows indicate the median adaptation indexes, computed across either all data points (A) or analyzed multiunit sites (B), in V1 and area LI, respectively. Different colors correspond to the data of different rats, with RX denoting the data of rat X; rat identifiers and colors are the same as those in Fig. 5.
Fig. 7.
Fig. 7.
Probing position and clutter sensitivity of the neuronal responses with stimulus-specific adaptation. A: responses to the same single stimulus (X) when being repeated vs. following a different single stimulus (Y) presented at the same position. B: same as in A, except that the adapter and test stimuli were presented at the two different positions. A black filled circle denotes a position with no stimulus being presented inside. C: responses to the same single stimulus (X) following adaptation to a compound stimulus. The compound stimulus included a simultaneous presentation of the two single stimuli, with either one (XY) or two (ZY) of them being different from the test stimulus (X). Stimulus X was presented at the same position throughout a trial. Only the data of the early phase of the neuronal response are presented. Each data point (open circles: primary visual cortex, V1; crosses: laterointermediate area, LI) represents a single analyzed multiunit site. Black and gray arrows correspond to the mean values of the presented data along the corresponding axes. For the sake of illustration, values beyond the limits of each axis are assigned a marginal value along that axis and presented as thus (denoted by ≥).

Similar articles

Cited by

References

    1. Aggleton JP, Keen S, Warburton EC, Bussey TJ. Extensive cytotoxic lesions involving both the rhinal cortices and area TE impair recognition but spare spatial alternation in the rat. Brain Res Bull 43: 279–287, 1997. doi:10.1016/S0361-9230(97)00007-5. - DOI - PubMed
    1. Alemi-Neissi A, Rosselli FB, Zoccolan D. Multifeatural shape processing in rats engaged in invariant visual object recognition. J Neurosci 33: 5939–5956, 2013. doi:10.1523/JNEUROSCI.3629-12.2013. - DOI - PMC - PubMed
    1. Andermann ML, Kerlin AM, Roumis DK, Glickfeld LL, Reid RC. Functional specialization of mouse higher visual cortical areas. Neuron 72: 1025–1039, 2011. doi:10.1016/j.neuron.2011.11.013. - DOI - PMC - PubMed
    1. Ayaz A, Saleem AB, Schölvinck ML, Carandini M. Locomotion controls spatial integration in mouse visual cortex. Curr Biol 23: 890–894, 2013. doi:10.1016/j.cub.2013.04.012. - DOI - PMC - PubMed
    1. Birch D, Jacobs GH. Spatial contrast sensitivity in albino and pigmented rats. Vision Res 19: 933–937, 1979. doi:10.1016/0042-6989(79)90029-4. - DOI - PubMed

Publication types

LinkOut - more resources