. 2018 Jul 1;29(13):1652-1663.
doi: 10.1091/mbc.E17-07-0449. Epub 2018 May 9.

Natural chromatin is heterogeneous and self-associates in vitro

Affiliations

Natural chromatin is heterogeneous and self-associates in vitro

Shujun Cai et al. Mol Biol Cell. .

Abstract

The 30-nm fiber is commonly formed by oligonucleosome arrays in vitro but rarely found inside cells. To determine how chromatin higher-order structure is controlled, we used electron cryotomography (cryo-ET) to study the undigested natural chromatin released from two single-celled organisms in which 30-nm fibers have not been observed in vivo: picoplankton and yeast. In the presence of divalent cations, most of the chromatin from both organisms is condensed into a large mass in vitro. Rare irregular 30-nm fibers, some of which include face-to-face nucleosome interactions, do form at the periphery of this mass. In the absence of divalent cations, picoplankton chromatin decondenses into open zigzags. By contrast, yeast chromatin mostly remains condensed, with very few open motifs. Yeast chromatin packing is largely unchanged in the absence of linker histone and mildly decondensed when histones are more acetylated. Natural chromatin is therefore generally nonpermissive of regular motifs, even at the level of oligonucleosomes.


Figures

FIGURE 1:
FIGURE 1:
Strategy for three-dimensional analysis of natural chromatin. (A) Possible nucleosome arrangements, including (i) chromatin masses, (ii) irregular 30-nm fibers, (iii) regular 30-nm fibers, (iv) open zigzags, (v) beads on a string, and (vi) 10-nm filaments. Blue cylinders, nucleosomes; blue lines, linker DNA. (B) The plasma membrane (black line) is ruptured by hypotonic shock, exposing the cellular contents to buffer with or without Mg or EDTA added. The chloroplast (green) and nucleus (blue) are the two largest organelles in picoplankton. The nuclear and plasma membranes are completely disrupted, while the chloroplast membrane is partially disrupted (green circle). (C) Tomographic slice (30 nm) of an intact early-interphase picoplankton cell. The largest organelles are labeled: chloroplast (chl); nucleus (nuc); Golgi body (gb); mitochondrion (mc). The lower-left corner shows the curved edge of the carbon support and two gold fiducials (dark puncta). As previously observed, the nucleus does not have an intact nuclear envelope. (D) Tomographic slice (30 nm) of a lysed picoplankton cell in 1 mM Mg, at the same scale as in C. The arrow points to a radiation-tolerant granule, and the arrowhead points to a radiation-sensitive granule; both types of granules were originally inside the chloroplast. The nuclear (nuc) and chloroplast (chl) remnants are labeled. The lysed cell is flattened by surface tension (after blotting), causing all components to spread out.
FIGURE 2:
FIGURE 2:
Picoplankton chromatin can form masses and irregular 30-nm fibers in the presence of divalent cations. Tomographic slices (30 nm) of picoplankton cell lysates in buffer supplemented with (A) 1 mM Mg, (B) no additional Mg, and (C) 5 mM EDTA. The dense puncta are gold fiducials (Au in B); the gently curved structures in A and C are the edges of the carbon support film. A couple of ribosomes (R) are indicated with arrows in B. Positions boxed in A–C are enlarged twofold, showing chromatin aggregates (D), short irregular 30-nm fibers (E, F), and open zigzags (G, bracket). A long stretch of naked DNA is indicated with an arrowhead in G. More examples of chromatin subjected to each condition are shown in Supplemental Figures S2–S4.
FIGURE 3:
FIGURE 3:
Yeast chromatin forms masses and irregular 30-nm fibers even in the absence of divalent cations. (A) Tomographic slices (30 nm) of yeast nuclei lysates without EDTA. (B) Enlargement (fourfold) of the irregular 30-nm fiber boxed in A. (C) Tomographic slices (30 nm) of yeast nuclei lysates in 50 mM EDTA. Star, microtubule. (D) Enlargement (fourfold) of the irregular 30-nm fiber boxed in C. Arrowhead, nucleosome.
FIGURE 4:
FIGURE 4:
Yeast chromatin is more dispersed when histone deacetylases are inhibited. (A) Tomographic slice (10 nm) of a yeast nucleus lysed in buffer with 50 mM EDTA. (B) Tomographic slice (10 nm) of a yeast nucleus lysed in buffer with 50 mM EDTA and 82 µM TSA. (C, D) Fourfold enlargements of the positions boxed in white in B, showing decondensed chromatin fibers. Arrows, nucleosomes. (E, F) Histograms of nearest- and 10th-nearest-neighbor nucleosome distances, P(NND) and P(10 NND), respectively. The in vivo measurements were done using cryotomograms of cryosectioned yeast we previously reported (Chen et al., 2016).
FIGURE 5:
FIGURE 5:
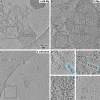
Yeast natural chromatin adopts few regular packing motifs. (A) Tomographic slice (10 nm) of yeast chromatin showing face-to-face packing (arrow). (B) Tomographic slice (6 nm) of yeast chromatin showing nucleosomes packed in a zigzag motif. Arrowheads, nucleosomes. (C) Two-dimensional class averages of yeast lysate in 50 mM EDTA, ordered left-to-right, top-to-bottom, from the most abundant to least abundant. Class averages that show nucleosome–nucleosome interactions have a lime-green triangle in the lower-right corner. Arrow, a class average showing face-to-face packing. (D) Tomographic slice (10 nm) of yeast irregular 30-nm fibers. (E) Distributions of fiber-condensation parameters.
FIGURE 6:
FIGURE 6:
Picoplankton zigzag chromatin accommodates open linker DNA. (A) Gallery of nucleosome three-dimensional class averages viewed (left) edge on and (right) face on, contoured at 0.5σ to better visualize the linker DNA. The percentage of particles belonging to each respective class average is shown at the lower-right corner the corresponding density. Black arrows, classes with open linker DNA. Red arrows, class averages with crossed linker DNA. Notice that the upper yellow and lower blue class averages only show the density of one linker DNA. (B) Tomographic slice (20 nm) of O. tauri chromatin in lysis buffer with 5 mM EDTA. (C) Three-dimensional class averages of template-matched nucleosomes (same field as in B), remapped as a synthetic tomogram.
FIGURE 7:
FIGURE 7:
Yeast chromatin is heterogeneous at the mononucleosome and oligonucleosome levels. (A) Gallery of nucleosome three-dimensional class averages viewed (left) edge on and (right) face on. Arrows, groove between DNA gyres. Arrowhead, DNA stemlike structure. The color scheme has no relationship with Figure 6. (B) Tomographic slice (10 nm) of yeast nuclei lysates in the presence of 50 mM EDTA. (C) A synthetic tomogram (78 nm thick) of the tomogram position shown in B.
FIGURE 8:
FIGURE 8:
Chromatin packing is irregular in vitro. Chromatin packing in (m) metazoans, (p) picoplankton, and (y) yeast. In vivo, cryo-EM and cryo-ET data are most consistent with a chromatin mass. In isolated chromatin, masses (left), irregular 30-nm fibers (middle), and open zigzags (right) have been seen in all three classes of organisms except yeast.

References

    1. Athey BD, Smith MF, Rankert DA, Williams SP, Langmore JP. (1990). The diameters of frozen-hydrated chromatin fibers increase with DNA linker length: evidence in support of variable diameter models for chromatin. J Cell Biol , 795–806. - PMC - PubMed
    1. Bednar J, Horowitz RA, Grigoryev SA, Carruthers LM, Hansen JC, Koster AJ, Woodcock CL. (1998). Nucleosomes, linker DNA, and linker histone form a unique structural motif that directs the higher-order folding and compaction of chromatin. Proc Natl Acad Sci USA , 14173–14178. - PMC - PubMed
    1. Bernstein BE, Tong JK, Schreiber SL. (2000). Genomewide studies of histone deacetylase function in yeast. Proc Natl Acad Sci USA , 13708–13713. - PMC - PubMed
    1. Bharat TA, Russo CJ, Lowe J, Passmore LA, Scheres SH. (2015). Advances in single-particle electron cryomicroscopy structure determination applied to sub-tomogram averaging. Structure , 1743–1753. - PMC - PubMed
    1. Bharat TA, Scheres SH. (2016). Resolving macromolecular structures from electron cryo-tomography data using subtomogram averaging in RELION. Nat Protoc , 2054–2065. - PMC - PubMed

Publication types

LinkOut - more resources