

Identification of a neutrophil-related gene expression signature that is enriched in adult systemic lupus erythematosus patients with active nephritis: Clinical/pathologic associations and etiologic mechanisms
- PMID: 29742110
- PMCID: PMC5942792
- DOI: 10.1371/journal.pone.0196117
Identification of a neutrophil-related gene expression signature that is enriched in adult systemic lupus erythematosus patients with active nephritis: Clinical/pathologic associations and etiologic mechanisms
Abstract
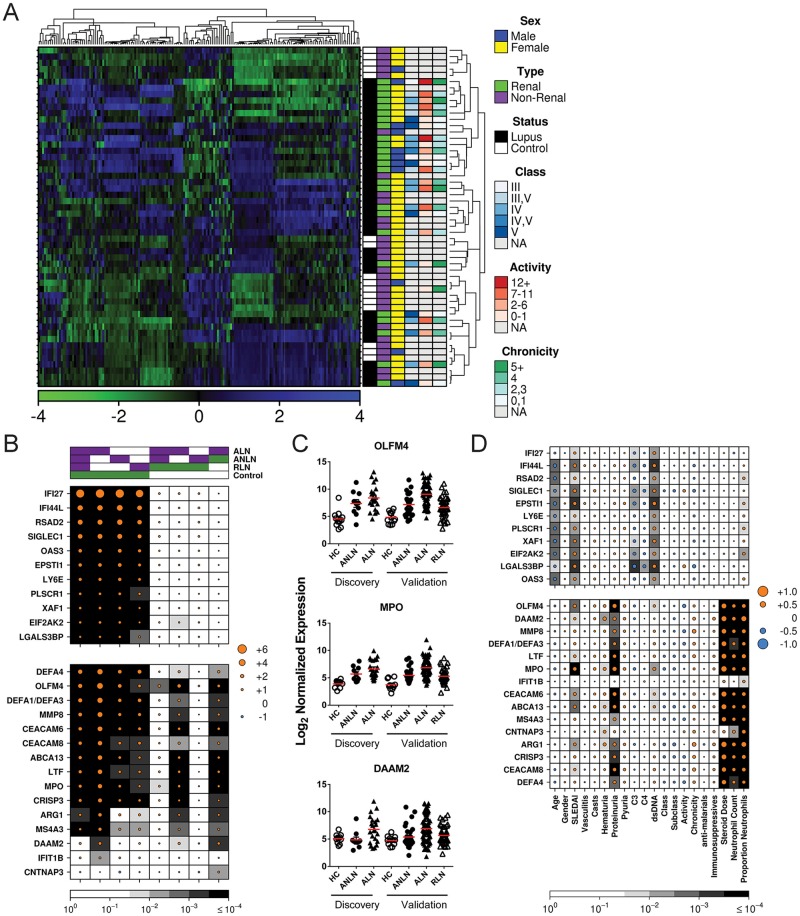
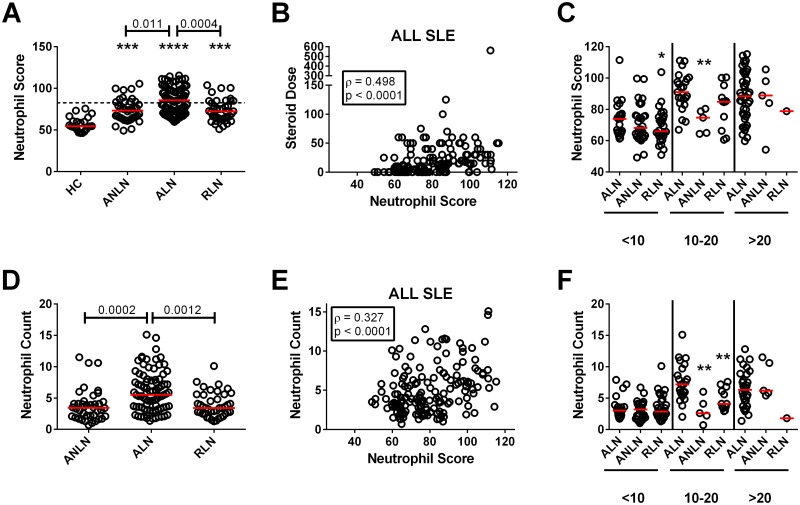
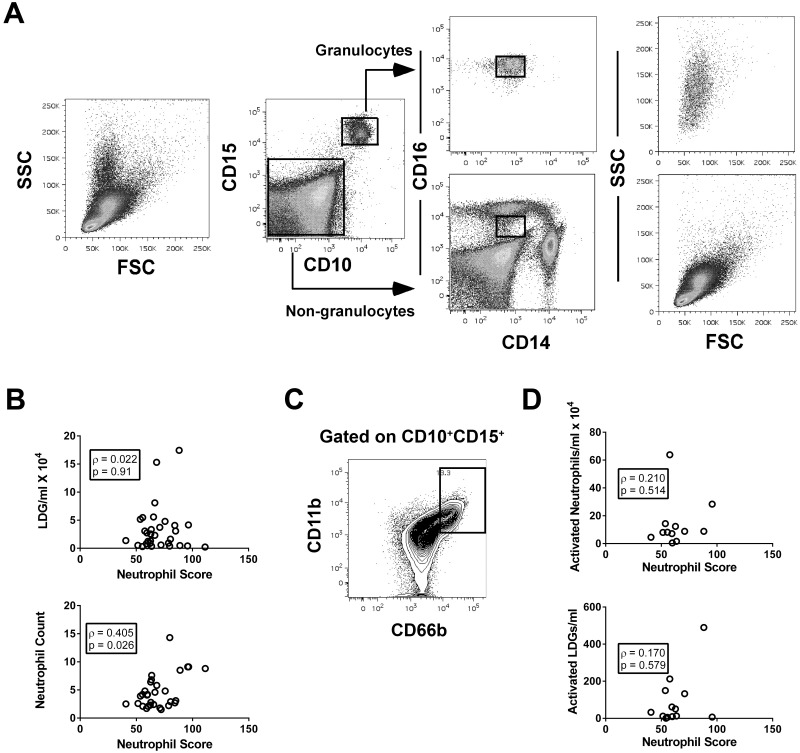
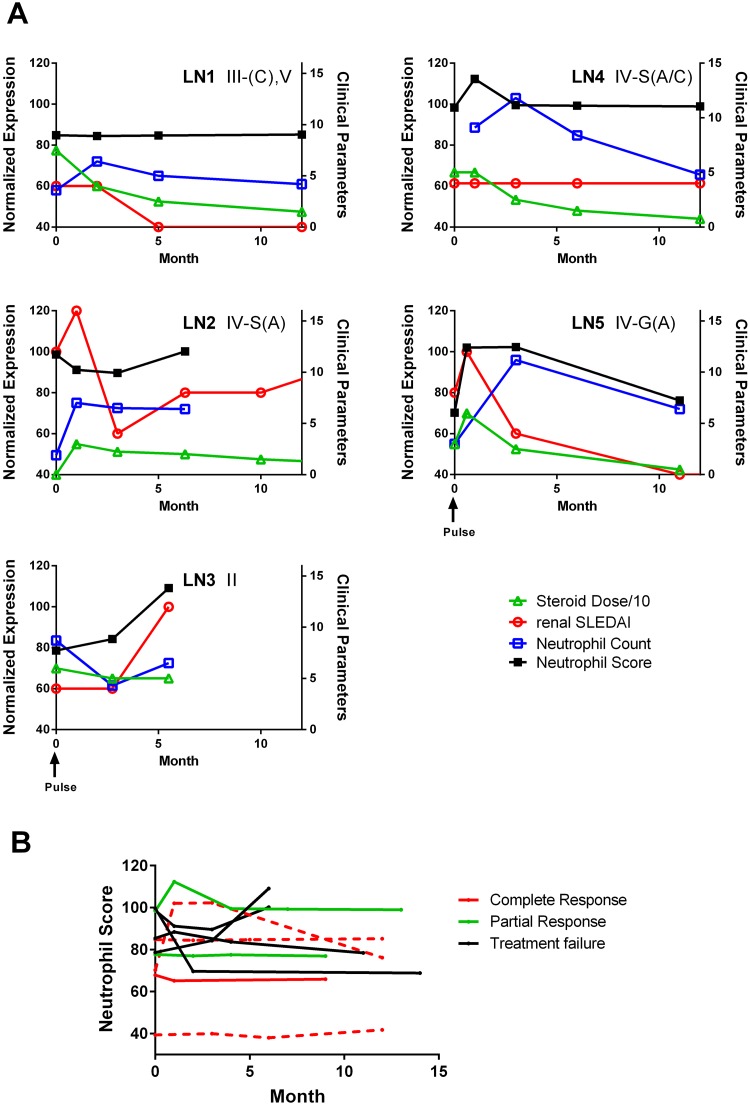
Both a lack of biomarkers and relatively ineffective treatments constitute impediments to management of lupus nephritis (LN). Here we used gene expression microarrays to contrast the transcriptomic profiles of active SLE patients with and without LN to identify potential biomarkers for this condition. RNA isolated from whole peripheral blood of active SLE patients was used for transcriptomic profiling and the data analyzed by linear modeling, with corrections for multiple testing. Results were validated in a second cohort of SLE patients, using NanoString technology. The majority of genes demonstrating altered transcript abundance between patients with and without LN were neutrophil-related. Findings in the validation cohort confirmed this observation and showed that levels of RNA abundance in renal remission were similar to active patients without LN. In secondary analyses, RNA abundance correlated with disease activity, hematuria and proteinuria, but not renal biopsy changes. As abundance levels of the individual transcripts correlated strongly with each other, a composite neutrophil score was generated by summing all levels before examining additional correlations. There was a modest correlation between the neutrophil score and the blood neutrophil count, which was largely driven by the dose of glucocorticosteroids and not the proportion of low density and/or activated neutrophils. Analysis of longitudinal data revealed no correlation between baseline neutrophil score or changes over the first year of follow-up with subsequent renal flare or treatment outcomes, respectively. The findings argue that although the neutrophil score is associated with LN, its clinical utility as a biomarker may be limited.
Conflict of interest statement
Figures
Similar articles
-
Modular transcriptional repertoire analyses identify a blood neutrophil signature as a candidate biomarker for lupus nephritis.Rheumatology (Oxford). 2017 Mar 1;56(3):477-487. doi: 10.1093/rheumatology/kew439. Rheumatology (Oxford). 2017. PMID: 28031441
-
Long non-coding RNA expression profiles in neutrophils revealed potential biomarker for prediction of renal involvement in SLE patients.Rheumatology (Oxford). 2021 Apr 6;60(4):1734-1746. doi: 10.1093/rheumatology/keaa575. Rheumatology (Oxford). 2021. PMID: 33068407
-
A discrete cluster of urinary biomarkers discriminates between active systemic lupus erythematosus patients with and without glomerulonephritis.Arthritis Res Ther. 2016 Oct 4;18(1):218. doi: 10.1186/s13075-016-1120-0. Arthritis Res Ther. 2016. PMID: 27716443 Free PMC article.
-
Human neutrophil peptide 1-3, a component of the neutrophil extracellular trap, as a potential biomarker of lupus nephritis.Int J Rheum Dis. 2015 Jun;18(5):533-40. doi: 10.1111/1756-185X.12433. Epub 2014 Sep 8. Int J Rheum Dis. 2015. PMID: 25196784
-
Association between the presence of anti-C1q antibodies and active nephritis in patients with systemic lupus erythematosus.Medicina (B Aires). 2015;75(1):23-8. Medicina (B Aires). 2015. PMID: 25637896
Cited by
-
Identification of NET formation and the renoprotective effect of degraded NETs in lupus nephritis.Am J Physiol Renal Physiol. 2024 Oct 1;327(4):F637-F654. doi: 10.1152/ajprenal.00122.2024. Epub 2024 Aug 29. Am J Physiol Renal Physiol. 2024. PMID: 39205658 Free PMC article.
-
Diagnostic test accuracy of novel biomarkers for lupus nephritis-An overview of systematic reviews.PLoS One. 2022 Oct 10;17(10):e0275016. doi: 10.1371/journal.pone.0275016. eCollection 2022. PLoS One. 2022. PMID: 36215243 Free PMC article. Review.
-
Circulating neutrophil extracellular trap remnants as a biomarker to predict outcomes in lupus nephritis.Lupus Sci Med. 2024 Jan 4;11(1):e001038. doi: 10.1136/lupus-2023-001038. Lupus Sci Med. 2024. PMID: 38177067 Free PMC article.
-
Transcriptome Studies in Lupus Nephritis.Arch Immunol Ther Exp (Warsz). 2022 Apr 25;70(1):15. doi: 10.1007/s00005-022-00651-y. Arch Immunol Ther Exp (Warsz). 2022. PMID: 35469108 Review.
-
Whole blood transcriptomics reveals the enrichment of neutrophil activation pathways during erythema nodosum leprosum reaction.Front Immunol. 2024 Apr 23;15:1366125. doi: 10.3389/fimmu.2024.1366125. eCollection 2024. Front Immunol. 2024. PMID: 38715615 Free PMC article.
References
-
- Cervera R, Khamashta MA, Font J, Sebastiani GD, Gil A, Lavilla P, et al. Systemic lupus erythematosus: clinical and immunologic patterns of disease expression in a cohort of 1,000 patients. The European Working Party on Systemic Lupus Erythematosus. Medicine. 1993;72(2):113–24. - PubMed
-
- Singh S, Saxena R. Lupus nephritis. The American Journal of the Medical Sciences. 2009;337(6):451–60. doi: 10.1097/MAJ.0b013e3181907b3d - DOI - PubMed
-
- Vlachoyiannopoulos PG, Karassa FB, Karakostas KX, Drosos AA, Moutsopoulos HM. Systemic lupus erythematosus in Greece. Clinical features, evolution and outcome: a descriptive analysis of 292 patients. Lupus. 1993;2(5):303–12. doi: 10.1177/096120339300200505 - DOI - PubMed
-
- Xiong W, Lahita RG. Pragmatic approaches to therapy for systemic lupus erythematosus. Nature Reviews Rheumatology. 2013;10(2):97–107. doi: 10.1038/nrrheum.2013.157 - DOI - PubMed
-
- Rovin BH, Birmingham DJ, Nagaraja HN, Yu CY, Hebert LA. Biomarker discovery in human SLE nephritis. Bulletin of the NYU Hospital for Joint Diseases. 2007;65(3):187–93. - PubMed
Publication types
MeSH terms
Substances
LinkOut - more resources
Full Text Sources
Other Literature Sources
Molecular Biology Databases
Research Materials
