. 2018 May 8;10(5):1505-1521.
doi: 10.1016/j.stemcr.2018.04.009.

Direct Reprogramming of Mouse Fibroblasts into Functional Skeletal Muscle Progenitors

Affiliations

Direct Reprogramming of Mouse Fibroblasts into Functional Skeletal Muscle Progenitors

Ori Bar-Nur et al. Stem Cell Reports. .

Abstract

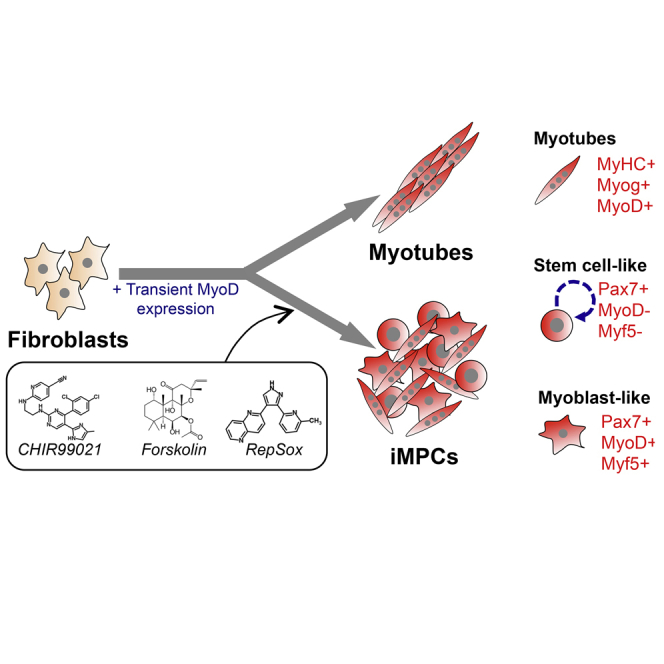
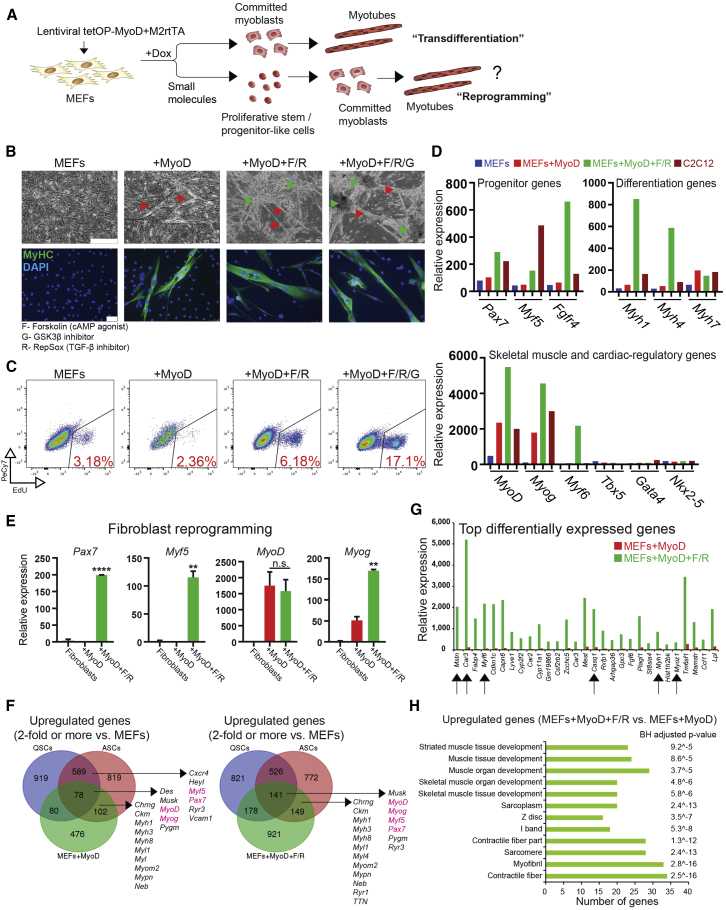
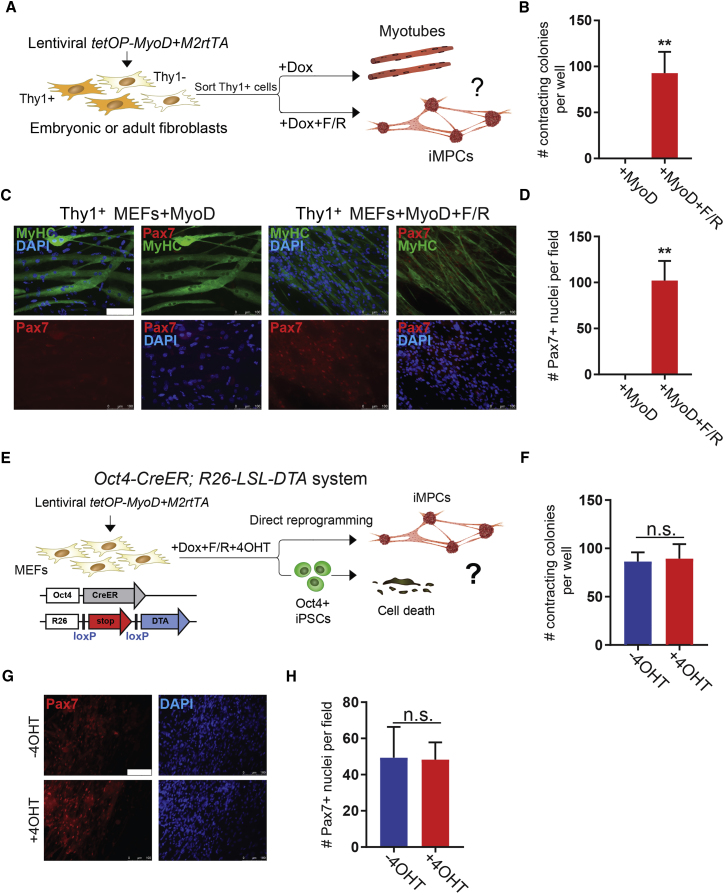
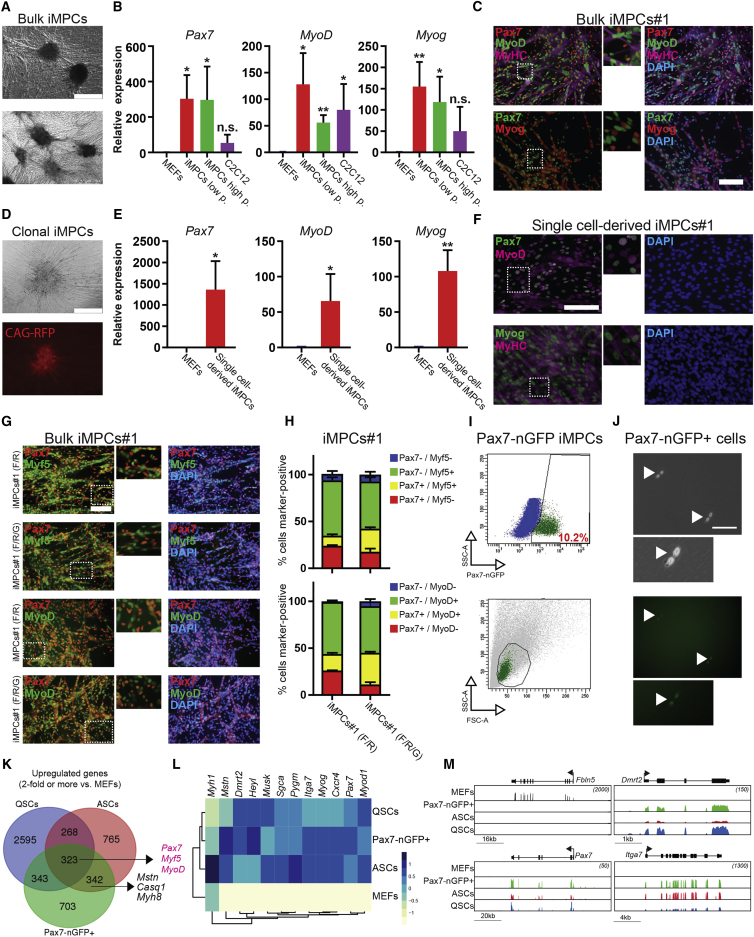
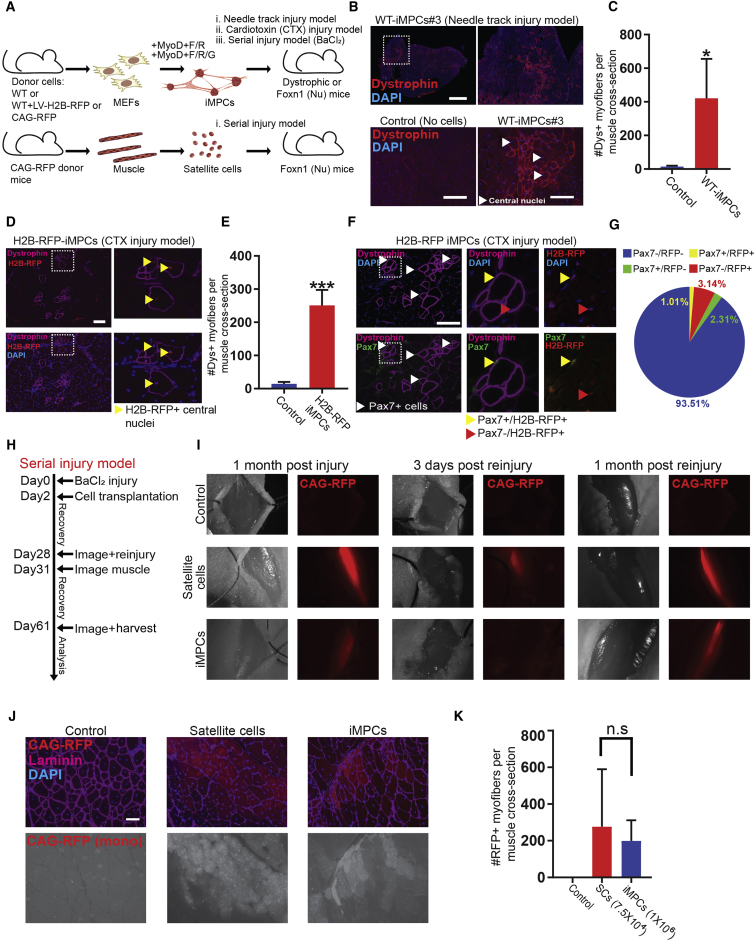
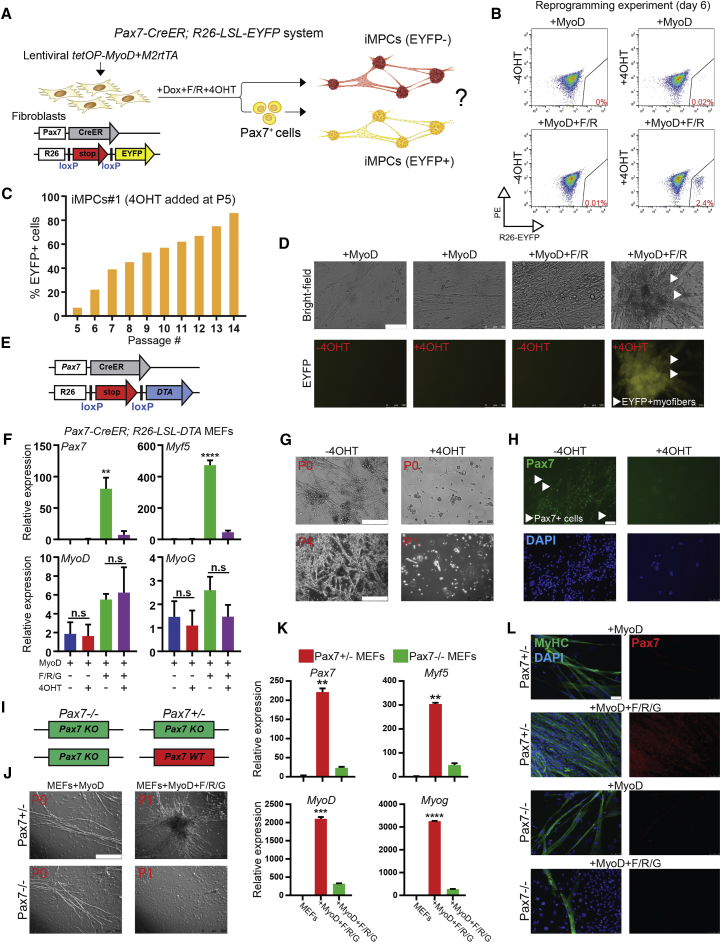
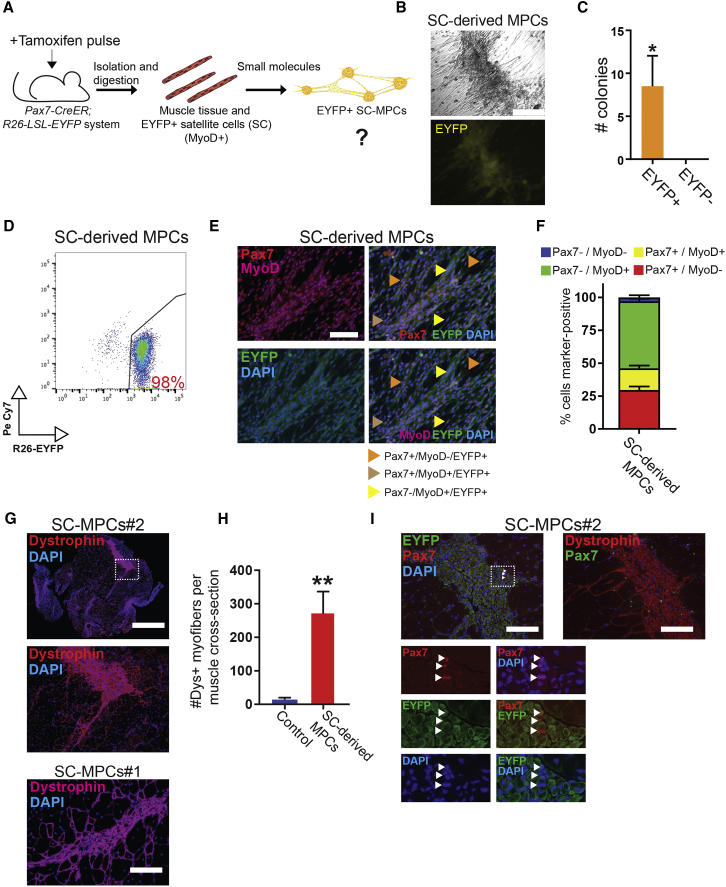
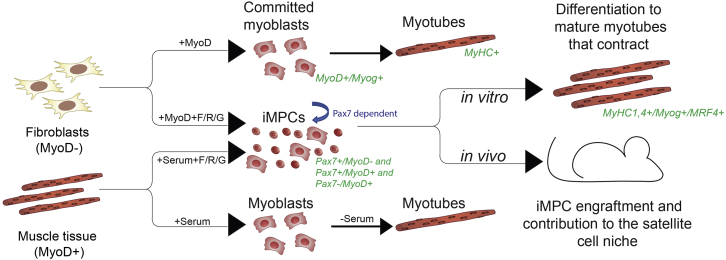
Skeletal muscle harbors quiescent stem cells termed satellite cells and proliferative progenitors termed myoblasts, which play pivotal roles during muscle regeneration. However, current technology does not allow permanent capture of these cell populations in vitro. Here, we show that ectopic expression of the myogenic transcription factor MyoD, combined with exposure to small molecules, reprograms mouse fibroblasts into expandable induced myogenic progenitor cells (iMPCs). iMPCs express key skeletal muscle stem and progenitor cell markers including Pax7 and Myf5 and give rise to dystrophin-expressing myofibers upon transplantation in vivo. Notably, a subset of transplanted iMPCs maintain Pax7 expression and sustain serial regenerative responses. Similar to satellite cells, iMPCs originate from Pax7+ cells and require Pax7 itself for maintenance. Finally, we show that myogenic progenitor cell lines can be established from muscle tissue following small-molecule exposure alone. This study thus reports on a robust approach to derive expandable myogenic stem/progenitor-like cells from multiple cell types.

Keywords: MyoD; Pax7; direct lineage reprogramming; induced muscle progenitor cells; muscular dystrophy; satellite cells; skeletal muscle; small molecules; transplantation.


Figures

None
Graphical abstract
Figure 1
Figure 1
MyoD and Small Molecules Induce Skeletal Muscle Progenitor-like Program in Fibroblasts (A) Experimental outline. MEFs, murine embryonic fibroblasts. (B) Representative bright-field images (scale bar, 500 μm) and immunofluorescence images for MyHC (green; scale bar, 50 μm) of MEFs induced with MyoD alone or MyoD in the presence of the indicated small molecules and medium containing fetal bovine serum (FBS), Serum Replacement (SR), and basic FGF (bFGF). Three-dimensional, proliferative, and contractile colonies were obtained only in the presence of the cyclic AMP agonist forskolin (F) and the TGF-β inhibitor RepSox (R), with or without GSK3β inhibitor (G). The experiment was validated using at least three different MEF lines. Green arrowheads indicate three-dimensional colonies; red arrowheads indicate multinucleated myofibers. (C) Flow-cytometric analysis for EdU to measure proliferation in MEFs subjected to the indicated treatments. (D) Expression of skeletal muscle- and cardiac-associated markers by microarray analysis in control MEFs, C2C12 myoblasts, and MEFs undergoing conventional transdifferentiation (MEF + MyoD) or reprogramming (MEFs + MyoD + F/R) for 14 days. (E) qRT-PCR analysis for the indicated skeletal muscle genes during tail-tip fibroblast reprogramming. ∗∗p < 0.005, ∗∗∗∗p < 0.00005, n.s., not significant. (F) Venn diagram showing the overlap of genes (>2-fold relative to MEFs) between quiescent satellite cells (QSCs), activated satellite cells (ASCs), and either MEFs expressing MyoD for 14 days or MEFs expressing MyoD and exposed to F/R for 14 days. Expression data for QSCs and ASCs were obtained from a previous publication (Liu et al., 2013). (G) Graph showing the top differentially expressed genes by expression microarray analysis in MEFs expressing MyoD and exposed to F/R in comparison with MEFs expressing MyoD alone. Arrows highlight examples of mature muscle markers detected exclusively under reprogramming conditions (MyoD + F/R). (H) Functional annotation analysis for upregulated genes (>2-fold) in MEFs + MyoD + F/R relative to MEFs + MyoD alone. Benjamini-Hochberg (BH) adjusted p values are presented. Top categories are shown together with the number of genes. See also Figure S1.
Figure 2
Figure 2
iMPCs Originate from Fibroblasts and Do Not Pass through a Pluripotent State (A) Experimental design to confirm origin of iMPCs from Thy1+ fibroblasts. (B) Quantification of contracting colonies obtained from sorted Thy1+ fibroblasts exposed to MyoD or MyoD + F/R (n = 3 biological replicates, 2 MEF lines and 1 tail-tip fibroblast [TTF] line were used; error bars denote SD; ∗∗p < 0.005). (C) Representative immunofluorescence images for MyHC (green) and Pax7 (red) expression in sorted Thy1+ fibroblasts exposed to either MyoD or MyoD + F/R for 14 days. Note lack of Pax7 positivity in cells expressing MyoD alone. Scale bar, 100 μm. (D) Quantification of Pax7+ nuclei in three random fields taken from sorted Thy1+ cells exposed to MyoD or MyoD + F/R for 14 days (n = 3 independent replicates; error bars denote SD; ∗∗p < 0.005). (E) Experimental design to assess if iMPC formation requires passage through an Oct4+ pluripotent intermediate state using a DTA (diphtheria toxin A) lineage ablation system. (F) Quantification of contracting colonies generated with and without 4OHT administration from Oct4-CreER;Rosa26-LSL-DTA MEFs and exposed to MyoD + F/R (n = 3 independent replicates; error bars denote SD). (G) Representative immunofluorescence images show staining for Pax7 in Oct4-CreER;Rosa26-LSL-DTA MEFs exposed to MyoD + F/R with and without 4OHT. Scale bar, 100 μm. (H) Quantification of Pax7+ nuclei in three random fields taken from Oct4-CreER;Rosa26-LSL-DTA MEFs exposed to MyoD + F/R with and without 4OHT (n = 3 independent replicates; error bars denote SD). See also Figure S1.
Figure 3
Figure 3
iMPCs Self-Renew and Express Markers of Muscle Stem, Progenitor, and Mature Cells (A) Representative images of dox-independent iMPC cultures containing spheroid structures, mononucleated cells, and multinucleated myotubes. Scale bar, 500 μm. (B) qRT-PCR analysis for skeletal muscle-specific genes in low-passage (P < 5) and high-passage (P > 15) iMPC lines expanded from individual colonies. MEFs were used as negative control and C2C12 myoblasts as positive control (n = 3–4 biological replicates; error bars denote SD; p < 0.05, ∗∗p < 0.005). (C) Representative immunofluorescence images for the indicated muscle-specific proteins in a representative iMPC line. Scale bar, 100 μm. (D) Representative images of single cell-derived iMPCs subcloned from CAG-RFP+ iMPCs. Scale bar, 250 μm. (E) qRT-PCR analysis for skeletal muscle-specific genes in single cell-derived iMPCs. MEFs were used as a negative control (n = 3 biological replicates; error bars denote SD; p < 0.05, ∗∗p < 0.005). (F) Representative immunofluorescence images for the indicated muscle-specific proteins in a single cell-derived iMPC clone. Scale bar, 100 μm. (G) Representative immunofluorescence images for Pax7 (red) and Myf5 (green) or Pax7 (red) and MyoD (green) expression in iMPCs#1 cultured in F/R or F/R/G conditions for at least five passages before analysis. Scale bar, 100 μm. (H) Quantification of (G). (I) Top: flow-cytometric analysis of GFP expression using low-passage iMPCs derived from Pax7-nGFP MEFs subjected to MyoD + F/R/G condition. Bottom: forward/side scatter flow-cytometric plot using Pax7-nGFP+ cells (green) compared with all mononucleated cells (gray). (J) Representative images of sorted Pax7-nGFP+ cells using bright-field and GFP channels. Zoomed images show sorted Pax7-nGFP+ doublets. Arrowheads indicate Pax7-nGFP+ cell doublets. Scale bar, 100 μm. (K) Venn diagram based on RNA sequencing data showing the overlap of upregulated genes (>2-fold, FDR < 0.05 relative to MEFs) between quiescent satellite cells (QSCs), activated satellite cells (ASCs), and sorted Pax7-nGFP+ cells purified from iMPCs. See Supplemental Experimental Procedures and main text for definition of QSCs and ASCs. (L) Heatmap depicting expression of skeletal muscle stem and progenitor associated genes based on RNA sequencing data obtained from Pax-nGFP+ iMPCs, QSCs, ASCs, and MEFs. (M) Integrative genomic viewer tracks for the indicated genes based on RNA sequencing data. See also Figure S3.
Figure 4
Figure 4
iMPCs Contribute to Skeletal Muscle Regeneration and the Satellite Cell Niche In Vivo (A) Experimental design to assess the engraftment and differentiation potential of iMPCs in comparison with satellite cells. (B) Immunofluorescence images for dystrophin (red) and DAPI (blue) for the indicated samples. One million cells were transplanted into the tibialis anterior or gastrocnemius of 12-week-old homozygous mdx dystrophic mice, and the muscles were isolated 1 month after transplantation for analysis. Non-transplanted or PBS-injected mdx muscle sections were used as negative controls. Rare dystrophin-positive myofibers, present in non-transplanted or PBS-injected control sections, are due to spontaneous reversion of the mdx mutation. Scale bars, 1,000 μm (top) and 100 μm (bottom). (C) Quantification of (B) (n = 3 biological replicates; error bars denote SD; p < 0.05). (D) Immunofluorescence images of cardiotoxin (CTX)-injured SCID-mdx muscles transplanted with 1 × 106 iMPCs carrying a nuclear H2B-RFP reporter and analyzed 1 month after injury/transplantation. CTX injury was carried out 24 hr prior to transplantation. Successful engraftment was assessed by measuring dystrophin expression (purple) and H2B-RFP expression (red). Scale bar, 100 μm. (E) Quantification of (D) (n = 3 biological replicates; error bars denote SD; ∗∗∗p < 0.0005). (F) Immunofluorescence images for dystrophin (purple) and Pax7 (green) expression within an engrafted area. Insets indicate Pax7 nuclear staining co-localizing with the H2B-RFP reporter. Scale bar, 100 μm. (G) Quantification of (F) (n = 3 biological replicates; error bars denote SD). (H) Experimental outline for serial injury experiment. (I) Representative images of tibialis anterior muscles transplanted with 1 × 106 iMPCs or 7.5 × 104 purified satellite cells carrying a CAG-RFP fluorescent reporter following BaCl2-induced muscle injury (48 hr prior to transplantation). Muscles transplanted with satellite cells or iMPCs were subjected to the same procedures as illustrated in (H). Note reduction of CAG-RFP signal 3 days after reinjury and restoration of CAG-RFP signal 1 month after reinjury, indicating successful regeneration by donor cells. (J) Immunofluorescence images of a tibialis anterior muscle section transplanted with CAG-RFP iMPCs and analyzed 1 month after reinjury compared with a non-transplanted control. Scale bar, 100 μm. (K) Quantification of serial injury procedure (n = 4 independent transplantation experiments per cell type). n.s., not significant. See also Figure S4.
Figure 5
Figure 5
iMPC Maintenance Requires Pax7+ Cells and Pax7 Gene Function (A) Schematic of lineage-tracing approach to determine lineage hierarchy among iMPC subsets. (B) Flow-cytometric analysis of Pax7-CreER;Rosa26-LSL-EYFP MEFs exposed to indicated conditions for 6 days. The PE channel was used to control for autofluorescence. (C) Quantification of flow-cytometric analysis of Pax7-CreER;Rosa26-LSL-EYFP iMPC line #1 continually treated with 4OHT from passages 5 to 14. (D) Representative images of EYFP+ myotubes emerging from Pax7-CreER;Rosa26-LSL-EYFP MEFs after exposure to MyoD + F/R in the presence of 4OHT. Scale bar, 100 μm. (E) Cell ablation system to determine if Pax7+ cells are required for the generation of iMPCs. (F) qRT-PCR analysis for skeletal muscle-specific genes in Pax7-CreER;Rosa26-LSL-DTA MEFs undergoing reprogramming into iMPCs using the indicated conditions (n = 3 biological replicates; error bars denote SD; ∗∗p < 0.005, ∗∗∗∗p < 0.00005; n.s., not significant). (G) Representative images of Pax7-CreER;Rosa26-LSL-DTA MEFs undergoing reprogramming into iMPCs using MyoD + F/R/G in the presence or absence of 4OHT. Scale bar, 250 μm. (H) Representative immunofluorescence images for Pax7 expression (green) for the experiment depicted in (G). Scale bar, 50 μm. (I) Schematic of Pax7 knockout (KO) alleles used to test whether iMPC generation requires Pax7 gene function. (J) Bright-field images show myotubes derived from Pax7+/− and Pax7−/− MEFs upon MyoD overexpression (left panels), and an iMPC clone derived from Pax7+/− MEFs (top right) but not from Pax7−/− MEFs (bottom right). Scale bar, 500 μm. (K) qRT-PCR analysis for indicated samples at day 21 of reprogramming. ∗∗p < 0.005, ∗∗∗p < 0.0005; ∗∗∗∗p < 0.00005. (L) Representative immunofluorescence images show staining for MyHC (green) and Pax7 expression (red) in Pax7+/− and Pax7−/− MEFs exposed to MyoD or MyoD + F/R/G conditions followed by several passages without exogenous MyoD expression. Scale bar, 50 μm. See also Figure S5.
Figure 6
Figure 6
Derivation of MPCs from Explanted Muscle Using Small-Molecule Treatment Alone (A) Experimental design to assess whether prolonged exposure to small molecules of Pax7-CreER;Rosa26-LSL-EYFP hindlimb muscle-derived cells (top row) gives rise to EYFP+ myogenic progenitors in the absence of exogenous MyoD expression. (B) Representative images of EYFP+ MPCs derived from explanted hindlimb muscles of Pax7-CreER;Rosa26-LSL-EYFP mice that were pulsed with tamoxifen prior to explantation. Scale bar, 250 μm. (C) Quantification of EYFP expression in MPC colonies derived from explanted hindlimb muscles of tamoxifen-pulsed Pax7-CreER;Rosa26-LSL-EYFP mice. p < 0.05. (D) Flow-cytometric analysis of a satellite cell lineage-derived MPC line (SC-MPCs) carrying the Pax7-CreER;Rosa26-LSL-EYFP lineage label. (E) Representative immunofluorescence images for indicated muscle-specific proteins in an EYFP+ SC-MPC clone. Scale bar, 100 μm. (F) Quantification of (E). (G) Immunofluorescence analysis for dystrophin expression (purple) 1 month after injection of 1 × 106 SC-MPCs derived from Pax7-CreER;Rosa26-LSL-EYFP muscles into the tibialis anterior of SCID-mdx recipients. Scale bars, 1,000 μm (top images) and 100 μm (bottom image). (H) Quantification of (G); non-transplanted mdx muscle sections were used as negative control (error bars denote SD; ∗∗p < 0.005). (I) Immunofluorescence images for dystrophin (red)/Pax7 (green) or EYFP (green)/Pax7 (red) expression in SC-derived MPC grafts. Scale bar, 100 μm.
Figure 7
Figure 7
Schematic Summary of Results

References

    1. Almada A.E., Wagers A.J. Molecular circuitry of stem cell fate in skeletal muscle regeneration, ageing and disease. Nat. Rev. Mol. Cell Biol. 2016;17:267–279. - PMC - PubMed
    1. Bar-Nur O., Brumbaugh J., Verheul C., Apostolou E., Pruteanu-Malinici I., Walsh R.M., Ramaswamy S., Hochedlinger K. Small molecules facilitate rapid and synchronous iPSC generation. Nat. Methods. 2014;11:1170–1176. - PMC - PubMed
    1. Bar-Nur O., Verheul C., Sommer A.G., Brumbaugh J., Schwarz B.A., Lipchina I., Huebner A.J., Mostoslavsky G., Hochedlinger K. Lineage conversion induced by pluripotency factors involves transient passage through an iPSC stage. Nat. Biotechnol. 2015;33:761–768. - PMC - PubMed
    1. Bergstrom D.A., Penn B.H., Strand A., Perry R.L., Rudnicki M.A., Tapscott S.J. Promoter-specific regulation of MyoD binding and signal transduction cooperate to pattern gene expression. Mol. Cell. 2002;9:587–600. - PubMed
    1. Bosnakovski D., Xu Z., Li W., Thet S., Cleaver O., Perlingeiro R.C., Kyba M. Prospective isolation of skeletal muscle stem cells with a Pax7 reporter. Stem Cells. 2008;26:3194–3204. - PMC - PubMed

Publication types

MeSH terms

LinkOut - more resources