. 2018 May 8;114(9):2072-2082.
doi: 10.1016/j.bpj.2018.03.031.

Distribution of Initiation Times Reveals Mechanisms of Transcriptional Regulation in Single Cells

Affiliations

Distribution of Initiation Times Reveals Mechanisms of Transcriptional Regulation in Single Cells

Sandeep Choubey et al. Biophys J. .

Abstract

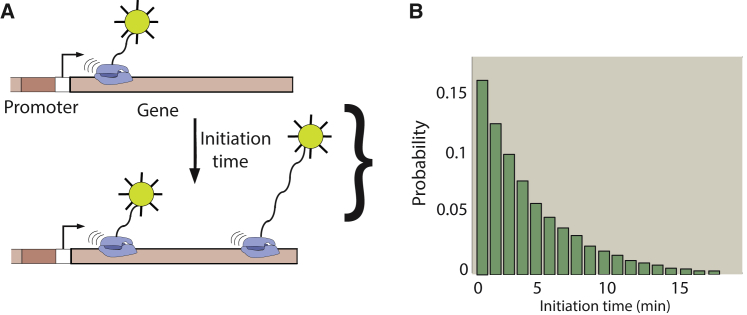
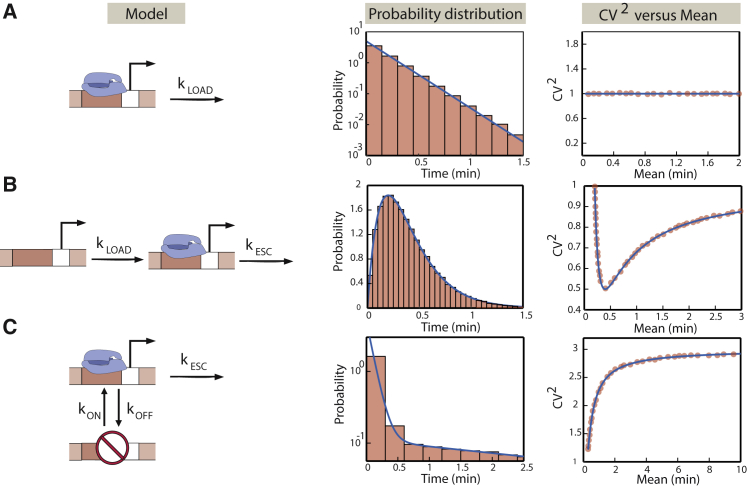
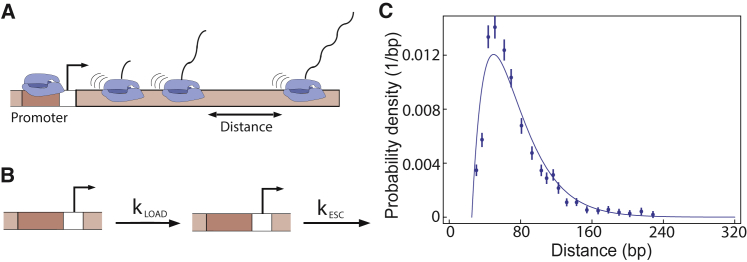
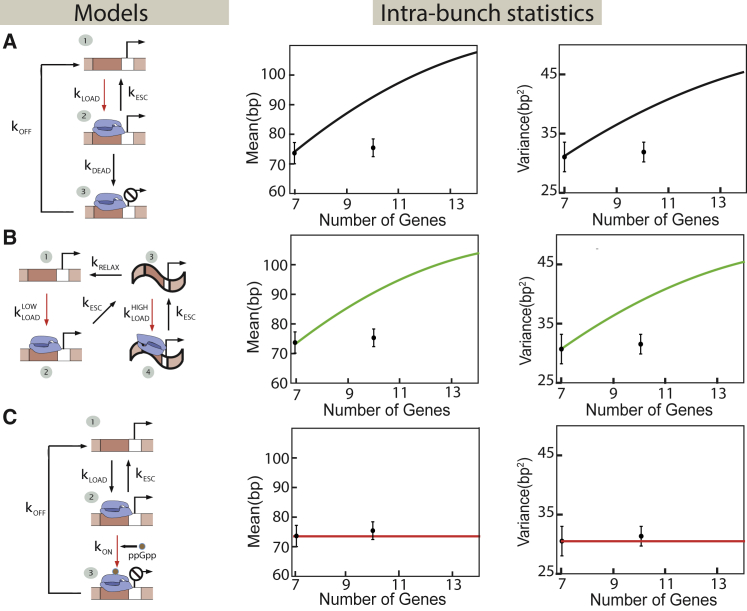
Transcription is the dominant point of control of gene expression. Biochemical studies have revealed key molecular components of transcription and their interactions, but the dynamics of transcription initiation in cells is still poorly understood. This state of affairs is being remedied with experiments that observe transcriptional dynamics in single cells using fluorescent reporters. Quantitative information about transcription initiation dynamics can also be extracted from experiments that use electron micrographs of RNA polymerases caught in the act of transcribing a gene (Miller spreads). Inspired by these data, we analyze a general stochastic model of transcription initiation and elongation and compute the distribution of transcription initiation times. We show that different mechanisms of initiation leave distinct signatures in the distribution of initiation times that can be compared to experiments. We analyze published data from micrographs of RNA polymerases transcribing ribosomal RNA genes in Escherichia coli and compare the observed distributions of interpolymerase distances with the predictions from previously hypothesized mechanisms for the regulation of these genes. Our analysis demonstrates the potential of measuring the distribution of time intervals between initiation events as a probe for dissecting mechanisms of transcription initiation in live cells.


Figures

Figure 1
Figure 1
Positions of transcribing RNAP carry the signature of transcription initiation dynamics. A schematic of the key idea of this work is shown. (A) The times between successive transcription initiation events (“initiation time”) can be extracted at the single-cell level using fluorescent reporters for nascent RNA molecules (19, 20, 45, 46, 47, 48, 49), or from electron micrograph (EM) images of RNAP caught in the process of transcribing a gene (39, 40, 41, 42, 43, 44). Native elongating transcript sequencing (85) can obtain the same quantitative information as EM images. (B) The distribution of times between individual transcription initiation events can be extracted from experiments and compared to theoretical predictions based on stochastic models of transcription initiation. To see this figure in color, go online.
Figure 2
Figure 2
Different models of transcriptional regulation lead to distinct signatures in the initiation times. (A) The one-step model of transcription initiation is depicted. Initiation happens at a constant rate kLOAD. The times between successive initiation events are exponentially distributed. The square of the coefficient of variation is plotted as a function of the mean, in which we change the mean by changing the rate of initiation, kLOAD. We confirm the analytical results using Gillespie simulations (65). The histograms and closed circles represent simulation results. (B) The two-step model of transcription initiation is depicted. Initiation happens in two sequential steps: the rate of RNAP loading onto the promoter occurs with rate kLOAD, followed by RNAP escaping the promoter, leading to transcript elongation at a rate kESC. The distribution of times between successive initiation events and the square of the coefficient of variation of the distribution as a function of the mean are shown. To change the mean, we change the rate of loading of RNAP polymerase molecules on the promoter, kLOAD. As in (A), simulation results are compared to the analytical results. (C) The ON-OFF model is depicted. The promoter switches between two states: an active and an inactive one. The rate of switching from the active state to the inactive state is kOFF and from the inactive to the active state is kON. From the active state, transcription initiation proceeds with a probability per unit time, kESC. The distribution of times between initiation events and the square of the coefficient of variation as a function of the mean are shown. Results from Gillespie simulations (65) are shown for comparison. To change the mean, we tune the rate kON of switching from the inactive to the active state. To illustrate the distinctive impact of the different initiation models on the distribution and moments of the times between successive initiation events, we use the following parameters: kOFF = 5/min, kON = 0.435/min, kLOAD= 0.14/min, and kESC= 0.14/min, which are characteristic of yeast promoters (36). To see this figure in color, go online.
Figure 3
Figure 3
Initiation of transcription of ribosomal genes in E. coli. (A) The positions of RNAP molecules transcribing a gene at a given instant in time can be obtained from electron microscopy images or native elongating transcript sequencing (85). (B) The two-step model of transcription initiation is shown. (C) The fit (line) of the two-step model to the interpolymerase distance distribution data (points) obtained by Voulgaris et al. (39) for ribosomal genes in E. coli is given. The different biochemical rates we extract from the fit are as follows: kESC (rate of promoter escape) ≈ 3/s, kLOAD (rate of RNAP loading onto the promoter) ≈ 3/s, and τclear (time for an RNAP to clear the promoter) ≈ 0.3 s, taking the elongation speed v = 78 bps/s, as reported in experiments (39). To see this figure in color, go online.
Figure 4
Figure 4
Different models of transcriptional regulation of ribosomal genes can be tested by tuning the gene-copy number. (A and B) Models of transcription initiation that rely solely on the interaction of RNAP with promoter DNA are shown. (A) This class of model considers the formation of long-lived nonproductive initiation complexes at the promoter by RNAP molecules (25, 70). After binding the promoter at a rate kLOAD, each RNAP can initiate transcription at a rate kESC or make a dead-end complex at the promoter at a rate kDEAD. These dead-end complexes are unproductive and are removed at a rate kOFF. The change in gene-copy number affects the binding rate of RNAP molecules to the promoter because of a change in the free RNAP concentration, as indicated by the red arrow. Theory predicts that the mean and variance of distances between RNAPs within a bunch increase with the gene number, contrary to experiments on ribosomal genes in E. coli. (B) The cooperative recruitment of RNAP by DNA supercoiling is shown. RNAP molecules are loaded onto the promoter at a rate kLOADLOW. After RNAP initiates transcription at a rate kESC, it leaves the promoter DNA in a supercoiled state, and subsequent loading of RNAP polymerases at the promoter happens at a faster rate, kLOADHIGH. The rate of relaxation of the supercoiled state is kRELAX. The change in gene-copy number affects both polymerase loading rates (red arrows) because of the change in free RNAP concentration. The model predicts that the mean and variance of the intrabunch RNAP distances increase with the gene-copy number, contrary to measurements in E. coli. (C) As the number of genes increases, the rate of rRNA production increases. This triggers the production of control molecules (e.g., ppGpp), which then reduce the initiation rate by modulating the promoter-RNAP interactions. ppGpp regulates the initiation process by converting the active promoter-RNAP complexes into inactive ones. It is described by the same kinetic scheme as the dead-end complex model (A) with a critical difference: in this case, it is the rate of inactivation of RNAP-promoter complex (kON) because of ppGpp binding to the complex that is tuned as the copy number of ribosomal genes is increased (red arrow), whereas the rate of RNAP loading onto the promoter is unchanged. The mean and variance of distances between RNAPs within a bunch are predicted to remain constant, as observed in experiments. In all the plots, the two data points shown are taken from (39). To see this figure in color, go online.

Similar articles

Cited by

References

    1. Bergman N.H., editor. Comparative Genomics: Volumes 1 and 2. Humana Press; Totowa, NJ: 2007. - PubMed
    1. Varki A., Altheide T.K. Comparing the human and chimpanzee genomes: searching for needles in a haystack. Genome Res. 2005;15:1746–1758. - PubMed
    1. Cheng Y., Ma Z., Snyder M.P., mouse ENCODE Consortium Principles of regulatory information conservation between mouse and human. Nature. 2014;515:371–375. - PMC - PubMed
    1. Stergachis A.B., Neph S., Stamatoyannopoulos J.A. Conservation of trans-acting circuitry during mammalian regulatory evolution. Nature. 2014;515:365–370. - PMC - PubMed
    1. Lin S., Lin Y., Snyder M.P. Comparison of the transcriptional landscapes between human and mouse tissues. Proc. Natl. Acad. Sci. USA. 2014;111:17224–17229. - PMC - PubMed

Publication types

LinkOut - more resources