. 2018 May 9;9(1):1837.
doi: 10.1038/s41467-018-04221-9.

A comprehensive model for assessment of liver stage therapies targeting Plasmodium vivax and Plasmodium falciparum

Affiliations

A comprehensive model for assessment of liver stage therapies targeting Plasmodium vivax and Plasmodium falciparum

Alison Roth et al. Nat Commun. .

Erratum in

Abstract

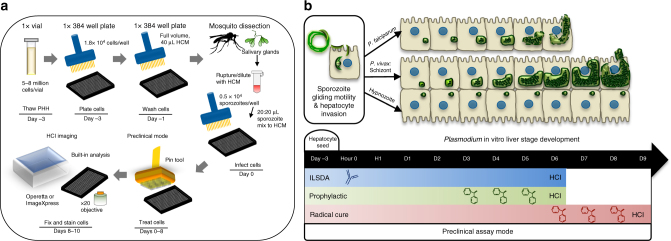
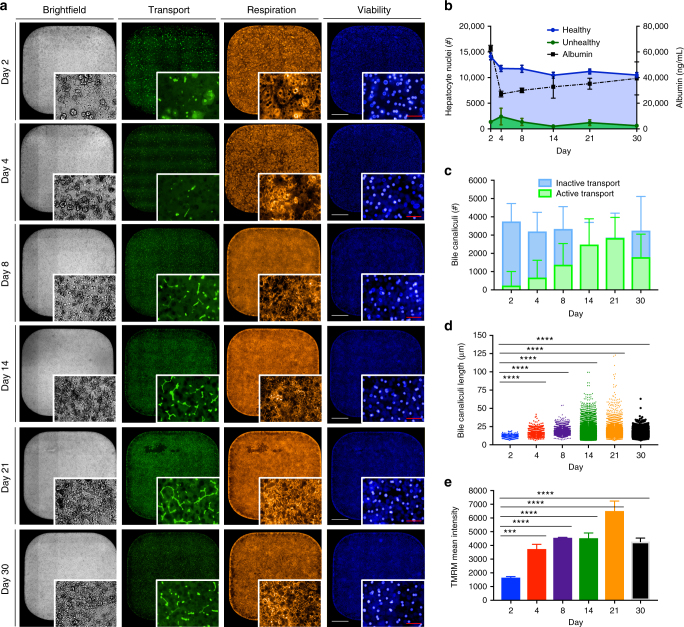
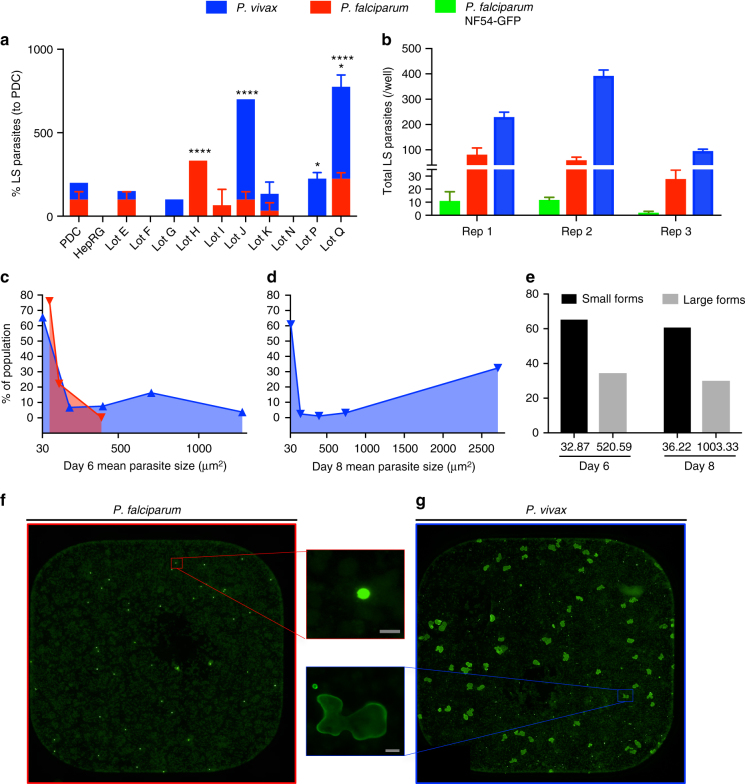
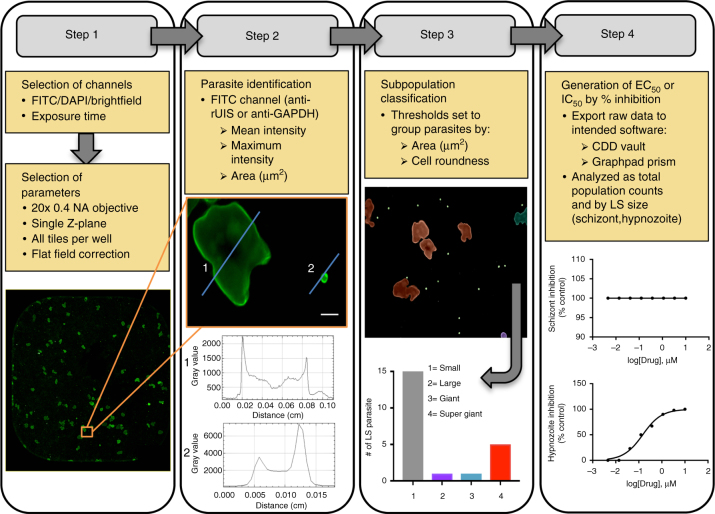
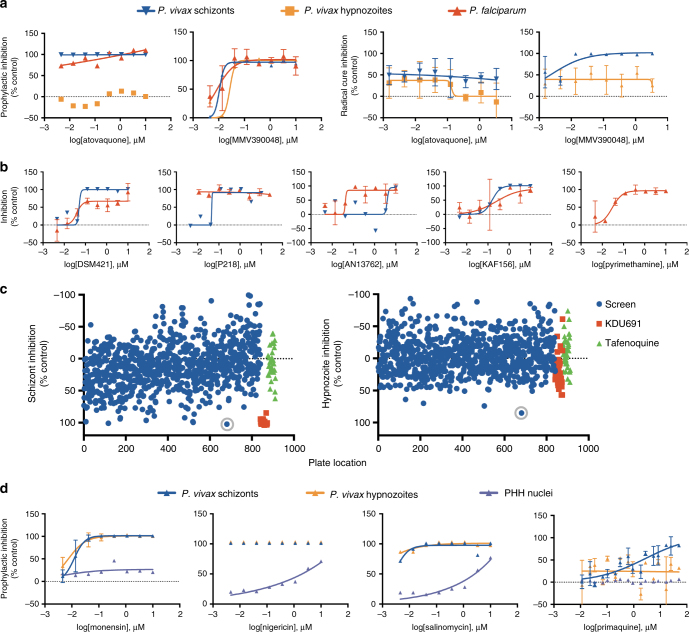
Malaria liver stages represent an ideal therapeutic target with a bottleneck in parasite load and reduced clinical symptoms; however, current in vitro pre-erythrocytic (PE) models for Plasmodium vivax and P. falciparum lack the efficiency necessary for rapid identification and effective evaluation of new vaccines and drugs, especially targeting late liver-stage development and hypnozoites. Herein we report the development of a 384-well plate culture system using commercially available materials, including cryopreserved primary human hepatocytes. Hepatocyte physiology is maintained for at least 30 days and supports development of P. vivax hypnozoites and complete maturation of P. vivax and P. falciparum schizonts. Our multimodal analysis in antimalarial therapeutic research identifies important PE inhibition mechanisms: immune antibodies against sporozoite surface proteins functionally inhibit liver stage development and ion homeostasis is essential for schizont and hypnozoite viability. This model can be implemented in laboratories in disease-endemic areas to accelerate vaccine and drug discovery research.


Conflict of interest statement

The authors declare no competing interests.

Figures

Fig. 1
Fig. 1
Experimental workflow for multispecies drug and vaccine preclinical assays. a A single vial of a pre-established cryopreserved primary human hepatocyte (PHH) donor is sufficient to seed a full 384-well plate and run 360 single-point therapeutic candidates. By day 3 post-seed, PHHs show in vivo-like phenotypes and are suitable for Plasmodium sporozoite infection. Defined preclinical assay modes are standardized using semi-automated hand pipettes and a 384-well pin tool. Upon experiment fixation, plates are fluorescently stain with a specific LS biomarker and imaged on a high content imaging (HCI) system. b Plasmodium sporozoites exhibit gliding motility while traveling from the injection site in the dermis to liver. Contact with liver components, including Kupffer cells, highly sulfated heparan sulfate proteoglycans, and liver endothelium triggers proteolytic processing of surface proteins (i.e., circumsporozoite protein) and activation of hepatocyte invasion machinery (i.e., TRAP, TREP, P36). Antibody inhibition of invasion pathways can be assessed by pre-incubation of infectious sporozoites with test serum or purified antibody in vitro prior to infection of plated hepatocytes (ILSDA). Following successful invasion, including formation of a parasitophorous vacuole membrane, P. vivax differentiates into hypnozoites and liver schizonts, which complete development after day 9. Day 5 or 6 is an ideal endpoint for both P. falciparum and P. vivax, for ILSDA and prophylactic drug response assays, as P. falciparum completes development shortly thereafter, and P. vivax schizonts are then distinguishable from hypnozoites based on size and morphology. Radical cure drug response assays are ended at day 8 to allow for treatment and clearance of susceptible liver forms
Fig. 2
Fig. 2
Functional assessment of cultured primary human hepatocytes (PHHs). a Photometric measurements of live cellular functions (transport, respiration, and viability) were imaged on days 2, 4, 8, 14, 21, 30 post seed revealing PHHs cultured in a 384-well plate remain stable for 30 days. b Condition of hepatocyte monolayer was determined by nuclei morphology, size, and fluorescence intensity, then classified as “healthy” and “unhealthy”. A steady adhered monolayer of ~11,000 PHHs and high albumin expression (ng ml−1) persisted for the duration of 30 days. c, d Image analysis combining mean intensity of CellTrackerTM Green CMFDA with differential imaging filters allowed for bile canaliculi quantification, assignment of active vs. inactive transport, and identification of bile duct length (µm) where peak measurements were revealed on day 21 post seed. e The mean intensity of the fluorescent dye TMRM was used to measure mitochondrial activity with day 21 having the highest active mitochondrial sequestration. Graph bars represent means with s.d. for biological replicates (n = 3) and experimental replicates (n = 6, b, n = 3, c, e) or individual values were plotted (d). Statistical significance was calculated using an one-way ANOVA with Dunnett’s multiple comparisons test to day 2 where statistical significance values are represented as P < 0.0001 (***) and P < 0.0001 (****). White scale bars represent 500 µm and red represents 50 µm
Fig. 3
Fig. 3
Characterizing Plasmodium developmental phenotypes in the primary human hepatocyte (PHH) culture system. a A total of ten cryopreserved PHH donor lots were screened for infectability and liver stage (LS) development by cryopreserved P. vivax and P. falciparum sporozoites in comparison to donors PDC and differentiated HepaRG line. Four donors (lot H, J, P, and Q) were significantly higher in percent of LS parasites relative to PDC while two donors (lot F and N) showed no LS parasite growth. Alternatively, specific donors appear to only be susceptible to a single Plasmodium species (lot G and P to P. vivax, lot H and I to P. falciparum). b Plasmodium sporozoites were added to PHHs at 5000 sporozoites per well with P. vivax field isolates showing highest LS development rates between 2 and 8.3%, P. falciparum NF54-WT between 0.6 and 2%, and P. falciparum NF54-GFP between 0.04 and 0.4%. c On day 6 of LS development, P. falciparum has a relatively synchronized growth with a large parasite population at a mean size of >100 µm2. de P. vivax LS parasites have a larger distribution of size from day 6 to day 8 (d) with a consistent hypnozoite (~60%) to developing schizont (~40%) ratio in the total population (e). f, g Representation of a single 384-well view showing day 6 P. falciparum LS schizonts stained with anti-GAPDH (left) and day 8 P. vivax developing LS schizonts and dormant hypnozoites stained with anti-rUIS4 (right) imaged on the Operetta HCI system, Perkin Elmer. Graph bars represent means with s.d. from an independent experimental replicate (n = 3, a) or for biological replicates (n = 3) with experimental replicates (n = 3, b). Statistical significance was determined using a two-way ANOVA followed by Dunnett’s multiple comparisons to PDC (a, b) where significance is represented by P < 0.05 (*) and P < 0.0001 (****). Plasmodium spp. mean parasite size distribution (ce) was calculated from biological replicates (n = 3) with experimental replicates (n = 26, P. vivax) or (n = 8, P. falciparum). Gray scale bars represent 10 µm
Fig. 4
Fig. 4
High-resolution immunofluorescent identification of Plasmodium liver stage (LS) parasites. a High-resolution images of P. vivax hypnozoites demonstrate these forms have minimal nuclear material and are negative for schizogony markers EXP1, EXP 2 and MSP1. Hypnozoites stain positive for cytosolic markers MIF, HSP70, and GAPDH and reveal a functioning apicoplast. b By day 8, P. vivax schizonts are several times larger than the host cell hepatic nucleus, feature genome replication and segmentation, and stain positive for EXP1, EXP2, ACP, and MSP1. c The LS of P. falciparum is shorter than that of P. vivax schizonts; developing parasites are correspondingly less small. By day 5 merozoite segmentation has begun (as noted by ACP staining of separate apicoplasts) but not complete (as noted by diffuse staining of MSPs). d Immunofluorescent staining of day 8 P. vivax LS schizonts with anti-Pvs16, a sexual stage-specific biomarker for immature gametocytes, showed co-localization with developing LS merozoites indicated by segmented DNA. However, anti-Pvs16 signal does not appear in every LS. e The PHH system successfully supports complete maturation of Plasmodium LS schizonts measured by breakthrough into blood stage using reticulocyte (P. vivax, days 9–11) or RBC (P. falciparum, days 7–8) overlays with initial giemsa staining every 6 h. P. vivax overlays show formation of merozoite packages which rupture into the reticulocyte culture leading to invasion. Alternatively, no merosomes were captured in P. falciparum overlays but early rings were present within the first 12 h and continued culture progressed to an asynchronous population at > 1% parasitemia. White scale bars represent 5 µm, gray scale bars represent 10 µm
Fig. 5
Fig. 5
Enhanced-throughput imaging and analysis for PE therapeutic screening. Schematic represents automated imaging and data analysis work flow using the Operetta high-content imaging (HCI) system (Perkin Elmer) where four consecutive steps are followed for maximum throughput of liver stage (LS) screening. Step 1: fluorescent channels are selected based on secondary conjugates and imaging parameters are set based on ×20 magnification (0.4 NA). Step 2: LS parasites are identified by high intensity staining patterns of LS-specific antibody (i.e., anti-rUIS4 for P. vivax or anti-GAPDH for P. falciparum) denoted by line plot profile (1, 2) Step 3: LS parasites are further characterized into size categories by area and roundness to ensure software is correctly selecting the entire parasite. Step 4: After LS parasites are quantified, raw data is imported into CDD vault or Graphpad Prism where % inhibition and dose-response curves are calculated based on total parasites and size. P. vivax LS assays specifically determine compound activity on hypnozoite population. White scale bars represent 5 µm
Fig. 6
Fig. 6
Plasmodium falciparum and P. vivax inhibition of liver stage development assays (ILSDAs). a P. vivax sporozoites exposed to anti-P. vivax circumsporozoite protein monoclonal antibody 2F2 (PvCSP mAB 2F2) showed a concentration dependent dose response with complete inhibition (100%) of sporozoite invasion and LS development at 250 µg ml−1. b, c Day 6 developing P. vivax liver stage (LS) parasites showed a decreased growth (µm2) phenotype to the 25 µg ml−1 PvCSP mAB 2F2 concentration compared to the no antibody control. d P. falciparum sporozoites exposed to anti-P. falciparum circumsporozoite protein monoclonal antibody 2A10 (PfCSP mAB 2A10) showed complete inhibition (100%) at concentrations 80 and 40 µg ml−1 with >50% inhibition at remaining concentrations. e, f Similarly, day 6 P. falciparum LS parasites had a decreased growth phenotype at the 10 µg ml−1 PfCSP mAB 2A10 concentration compared to the no antibody control. g Dose response ILSDAs for test sera immunized against nanoparticles G2, G3, G6, and G7 (top), and representative images of day 6 P. falciparum LS parasite forms exposed to a 1:16 serum dilution (bottom). Graph bars represent means with s.d. biological replicates (n = 3, a, b and n = 2, d, e, g) with experimental replicates (n = 2, a, b, d, e, g). Statistical significance was determined for using two-way ANOVA followed by Tukey’s multiple comparisons to control where values are represented as P < 0.0001 (****) and no significance (ns, b) or was determined using one-way ANOVA followed by Dunnett’s multiple comparisons to control where values are represented by P < 0.01 (**) and no significance (ns, e). Gray scale bars represent 10 µm
Fig. 7
Fig. 7
Medium throughput dose response and single point antimalarial compound screening. a Dose response charts of inhibition of P. vivax and P. falciparum LS development following treatment with control compound KDU691 (a PI4K inhibitor) and reference compound atovaquone. b Dose response curves for six MMV portfolio drugs against both P. vivax and P. falciparum LS schizonts. c Activity of 913 Calibr Bioactive compounds against P. vivax in radical cure mode; activity for each compound is indexed on the X axis by plate position with individual plate control wells grouped and indicated. Monensin, active against P. vivax hypnozoites and schizonts in both prophylactic and radical cure modes, is indicated within a gray circle. d Dose response plots of inhibition of P. vivax LS parasites following treatment with three different ionophores or primaquine; PHH nuclei counts, normalized to DMSO controls, are shown to demonstrate selectivity index. Graph bars represent means with s.d. of biological replicates (n = 2) for DSM421, P218, AN13762, KAF156, pyrimethamine, and monensin; biological replicates (n = 3) for MMV390048 and atovaquone; or biological replicates (n = 4) for primaquine

References

    1. WHO. World Malaria Report. World Health Organization (2017).
    1. Battle KE, et al. The global public health significance of Plasmodium vivax. Adv. Parasitol. 2012;80:1–111. doi: 10.1016/B978-0-12-397900-1.00001-3. - DOI - PubMed
    1. Gething PW, et al. A long neglected world malaria map: Plasmodium vivax endemicity in 2010. PLoS Negl. Trop. Dis. 2012;6:e1814. doi: 10.1371/journal.pntd.0001814. - DOI - PMC - PubMed
    1. Price RN, et al. Vivax malaria: neglected and not benign. Am. J. Trop. Med. Hyg. 2007;77:79–87. - PMC - PubMed
    1. Silvie O, Franetich JF, Renia L, Mazier D. Malaria sporozoite: migrating for a living. Trends Mol. Med. 2004;10:97–100. doi: 10.1016/j.molmed.2004.01.004. - DOI - PubMed

Publication types

MeSH terms