. 2018 May 9;9(1):1840.
doi: 10.1038/s41467-018-04283-9.

NOTCH-mediated non-cell autonomous regulation of chromatin structure during senescence

Affiliations

NOTCH-mediated non-cell autonomous regulation of chromatin structure during senescence

Aled J Parry et al. Nat Commun. .

Abstract

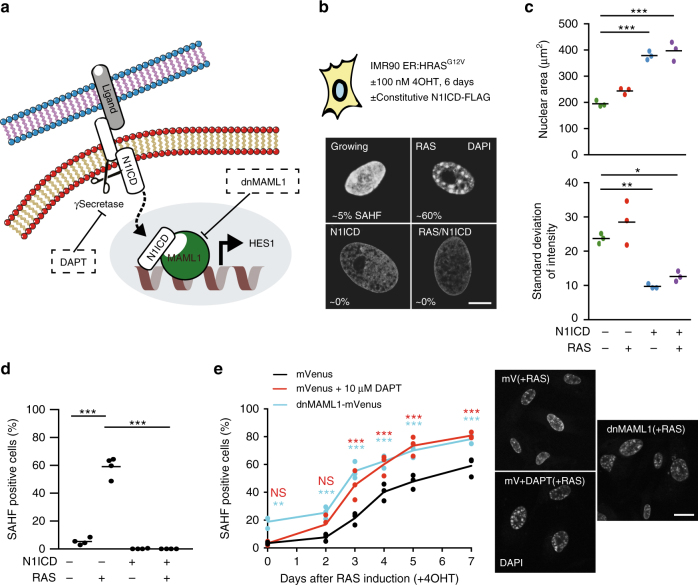
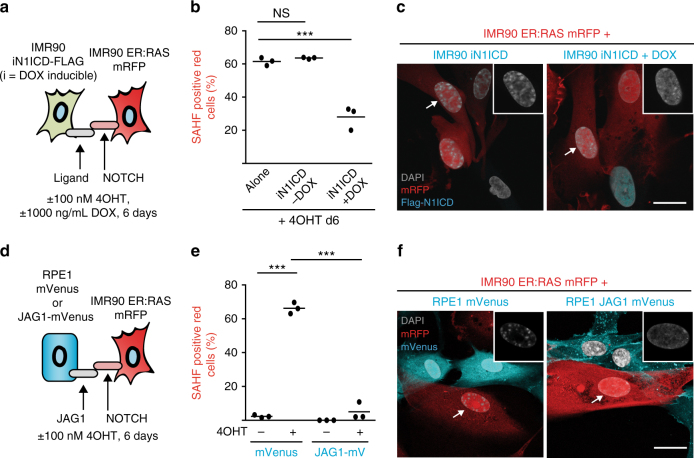
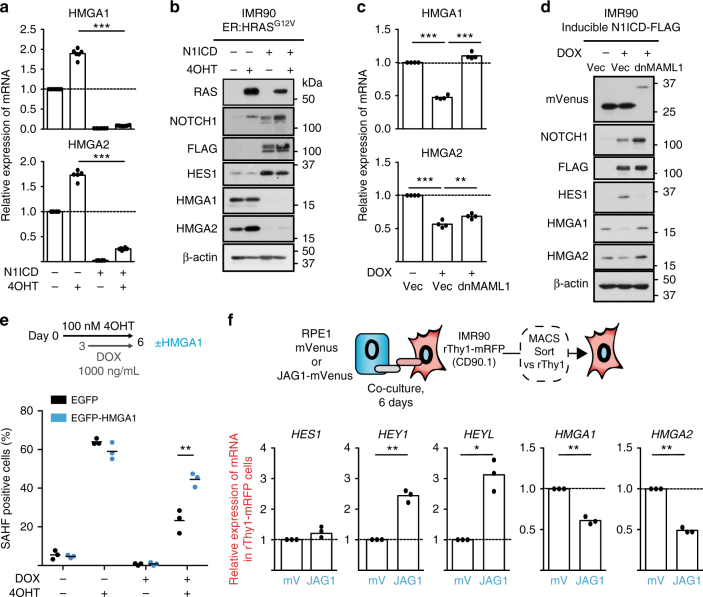
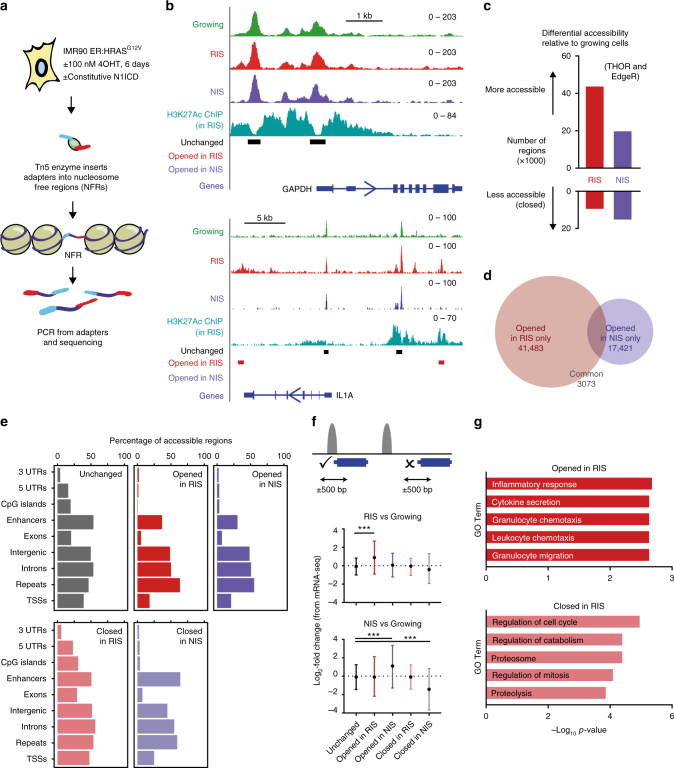
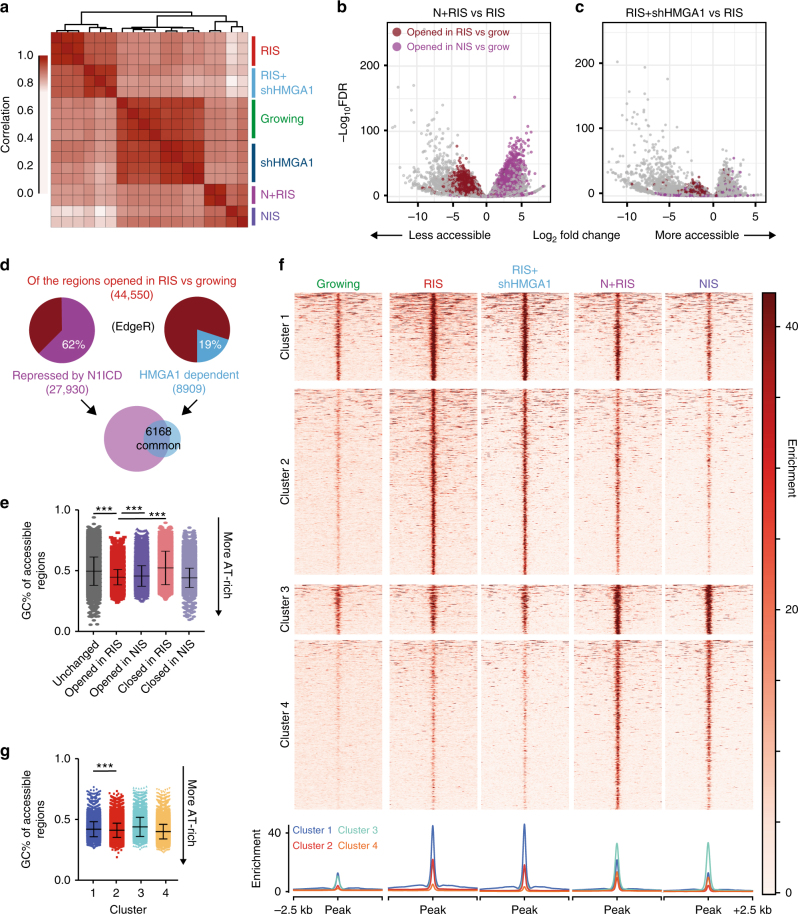
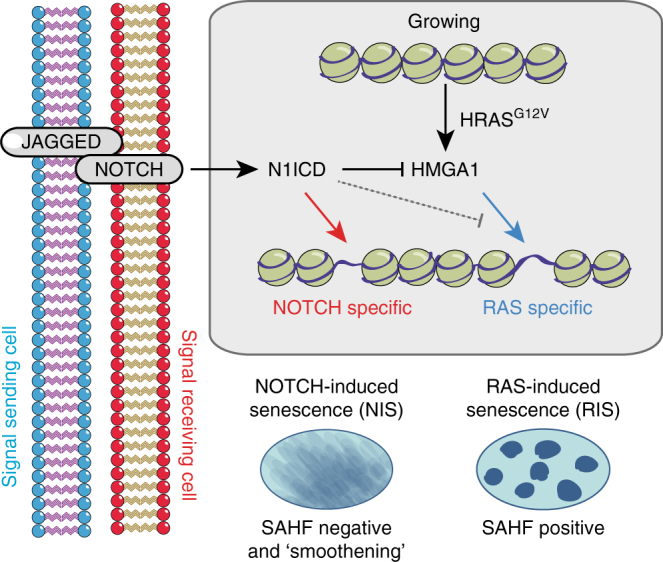
Senescent cells interact with the surrounding microenvironment achieving diverse functional outcomes. We have recently identified that NOTCH1 can drive 'lateral induction' of a unique senescence phenotype in adjacent cells by specifically upregulating the NOTCH ligand JAG1. Here we show that NOTCH signalling can modulate chromatin structure autonomously and non-autonomously. In addition to senescence-associated heterochromatic foci (SAHF), oncogenic RAS-induced senescent (RIS) cells exhibit a massive increase in chromatin accessibility. NOTCH signalling suppresses SAHF and increased chromatin accessibility in this context. Strikingly, NOTCH-induced senescent cells, or cancer cells with high JAG1 expression, drive similar chromatin architectural changes in adjacent cells through cell-cell contact. Mechanistically, we show that NOTCH signalling represses the chromatin architectural protein HMGA1, an association found in multiple human cancers. Thus, HMGA1 is involved not only in SAHFs but also in RIS-driven chromatin accessibility. In conclusion, this study identifies that the JAG1-NOTCH-HMGA1 axis mediates the juxtacrine regulation of chromatin architecture.


Conflict of interest statement

The authors declare no competing interests.

Figures

Fig. 1
Fig. 1
NOTCH1 signalling has a chromatin ‘smoothening’ effect that blocks SAHF. a Diagram illustrating the NOTCH1 signalling pathway, which can be repressed chemically using DAPT or genetically by expressing dominant-negative MAML1 (dnMAML1). b IMR90 ER:HRASG12V cells were infected with control vector or N1ICD-FLAG and incubated with ±100 nM 4OHT for 6 days. Representative images of nuclei stained with DAPI for the conditions indicated (scale bar = 10 µm). Percentage indicates the number of SAHF-positive cells within the population (see d). c, d Quantification of nuclear area, standard deviation of DAPI intensity (c) and the number of SAHF-positive cells (d) for the conditions indicated in b. Lines indicate the mean value of each replicate. n = 3 (c) and n = 4 (d) biologically independent replicates. Values of individual replicates for nuclear area and standard deviation are shown in Supplementary Fig. 1b, d. e Time series analysis of SAHF-positive nuclei following the addition of 100 nM 4OHT to IMR90 ER:HRASG12V cells in the presence or absence of ectopic dnMAML1 or 10 µM DAPT (left). n = 3 biologically independent replicates. Representative DAPI images of the indicated conditions (+RAS = 7 days of 4OHT treatment; scale bar = 25 µm). ce Statistical significance calculated using one-way ANOVA with Tukey’s correction for multiple comparisons. *p ≤ 0.05, **p ≤ 0.01, ***p ≤ 0.001
Fig. 2
Fig. 2
NOTCH1 and JAG1 can non-autonomously repress SAHF formation in adjacent cells. a Schematic showing experimental set-up. IMR90 cells expressing doxycycline (DOX)-inducible N1ICD-FLAG were cultured with IMR90 ER:HRASG12V cells expressing mRFP with 100 nM 4OHT ±  1000 ng/mL DOX for 6 days. b Quantification of SAHF-positive red cells for the experiment outlined in a. Alone: mono-cultured IMR90 ER:HRASG12V cells; iN1ICD: DOX-inducible N1ICD-FLAG. c Representative images of co-cultures indicated (scale bar = 25 µm). Insets are unmerged DAPI images of the indicated cells (arrows). d Schematic showing experimental set-up. IMR90 ER:HRASG12V cells expressing mRFP were co-cultured with RPE1 cells stably expressing either mVenus or JAG1-mVenus for 6 days ±100 nM 4OHT. e Quantification of SAHF-positive red cells for the experiment outlined in d. f Representative images of co-cultures indicated (scale bar = 25 µm). Insets are unmerged DAPI images of the indicated cells (arrows). Note DAPI foci in RPE1 cells are not SAHFs. b, e Lines indicate the mean value of individual replicates. n = 3 biologically independent replicates for all conditions. Statistical significance calculated using one-way ANOVA with Tukey’s correction for multiple comparisons; ***p ≤ 0.001, NS = not significant
Fig. 3
Fig. 3
NOTCH1 signalling represses SAHF formation partially by repressing HMGA proteins. a, b qRT-PCR (n = 6) (a) and immunoblotting (b) for the indicated mRNA and proteins in IMR90 ER:HRASG12V cells stably infected with control vector or N1ICD-FLAG ± 100 nM 4OHT for 6 days. c, d qRT-PCR (n = 4) (c) and immunoblotting (d) of IMR90 cells expressing doxycycline (DOX)-inducible N1ICD-FLAG (iN1ICD) and infected with a mVenus control vector or dnMAML1-mVenus ± 1000 ng/mL DOX for 3 days. e Quantification of SAHFs in IMR90 cells expressing ER:HRASG12V, iN1ICD and EGFP or an EGFP-HMGA1 fusion ± 100 nM 4OHT for 6 days and ±1000 ng/mL DOX for 3 days. f qRT-PCR for the indicated mRNA in IMR90 cells expressing rThy1-mRFP and co-cultured with RPE1 cells expressing mVenus or JAG1-mVenus, isolated using MACS (n = 3). Statistical significance calculated using one-way ANOVA with Tukey’s correction for multiple comparisons (a, c) or two-sample t-test (e, f). *p ≤ 0.05, **p ≤ 0.01, ***p ≤ 0.001
Fig. 4
Fig. 4
Chromatin accessibility reflects gene transcription in RIS and NIS cells. a Diagram illustrating the method of ATAC-seq. b Genome browser images showing normalised ATAC-seq coverage and an active enhancer-associated histone modification (H3K27ac) in the cell conditions indicated around the GAPDH and IL1A genes. Unchanged = accessibility unaltered in RIS or NIS cells relative to growing; Opened in RIS = more accessible in RIS vs. growing cells; Opened in NIS = more accessible in NIS vs. growing cells (by edgeR and THOR). c Number of regions that become more accessible and less accessible in RIS and NIS cells relative to growing cells (intersect of edgeR and THOR). d Number of regions that are more accessible in RIS that are overlapping with a region that is more accessible in NIS (vs. growing). e Annotation of more (opened) and less (closed) accessible regions in RIS and NIS cells to genomic regions. f Accessible regions within the indicated subsets were annotated to genes if within 500 bp of a TSS. The average log2-fold expression change (by mRNA-seq) of genes in RIS or NIS cells relative to growing cells is plotted. Values are mean ± s.d. Statistical significance calculated using a one-way ANOVA with Tukey’s correction for multiple comparisons. ***p ≤ 0.001. g Gene ontology analysis (GO Biological Process 2015) using the TSS proximal accessible regions described in f
Fig. 5
Fig. 5
Ectopic N1ICD and HMGA1 knockdown antagonise chromatin opening in RIS. a Unbiased clustering of replicates for the conditions indicated. b, c Volcano plots showing regions of altered accessibility in N+RIS cells (b) and RIS+shHMGA1 (c) cells relative to RIS cells. Regions that are also opened in RIS (red) and NIS (purple) relative to growing cells are indicated. d Number of novel accessible regions in RIS (identified in Fig. 4c) that are repressed by N1ICD (significantly reduced in N+RIS vs. RIS) and are HMGA1 dependent (significantly reduced in RIS+shHMGA1 vs. RIS). The Venn diagram shows the number of regions repressed by N1ICD that are overlapped by a region dependent on HMGA1. e Genomic GC percentage of the accessible regions indicated. f K-means clustered heatmap showing the enrichment of normalised reads around accessible regions altered in any of the conditions relative to growing cells. g Genomic GC percentage of the clusters indicated, identified in f. e, g Mean ± s.d is plotted. Statistical significance calculated using one-way ANOVA with Tukey’s correction for multiple comparisons; ***p ≤ 0.001
Fig. 6
Fig. 6
Tumour cells can repress SAHFs and chromatin opening in adjacent RIS fibroblasts. a Normalised mRNA expression values from the Cancer Cell Line Encyclopedia (CCLE) and immunoblotting of JAG1 in the tumour cell lines indicated. b Quantification of SAHFs in IMR90 ER:HRASG12V cells expressing mRFP co-cultured with the tumour cell lines indicated for 6 days +100 nM 4OHT ± 10 µM DAPT (left) and representative images (right) (scale bar = 25 µm). n = 3 biological replicates except for Hep3B cultures where n = 6. c SAHF quantification in IMR90 ER:HRASG12V cells expressing mRFP+100 nM 4OHT±10 µM DAPT. d Schematic showing experimental set-up. IMR90 ER:HRASG12V cells expressing mRFP were cultured with tumour cell lines +100 nM 4OHT before flow sorting to isolate red cells. e qRT-PCR of mRNA isolated from the cells described in c. n = 3 biological replicates. f Immunoblotting of JAG1 in the cells indicated. g Quantification of SAHFs in IMR90 ER:HRASG12V expressing mRFP co-cultured with the tumour cells indicated for 6 days +100 nM 4OHT. n = 3 biological replicates. h Volcano plots showing regions of altered accessibility in RIS cells co-cultured with MCF7, A549 and Hep3B cells (as in c) relative to RIS cells cultured alone. Regions that also become more accessible in RIS (red) and NIS (purple) vs. growing are indicated where numbers indicate the total number of significant alterations (log2 fold change <−0.58 or >0.58 and FDR < 0.01) and <−1 indicates the number with a log2 fold change of <−1. i Number of more accessible regions in RIS (identified in Fig. 4c) that are repressed by co-culture with MCF7, A549 and Hep3B. b, c, e, g Statistical significance calculated using one-way ANOVA with Tukey’s correction for multiple comparisons; *p ≤ 0.05, **p ≤ 0.01, ***p ≤ 0.001, NS = not significant
Fig. 7
Fig. 7
HEYL and HMGA1 gene expression values anti-correlate in multiple human tumour types. a Pan-cancer analysis of the TCGA database. Correlation between HMGA1 and HEYL is plotted in the indicated tumour types. Colours represent Bonferroni adjusted p-values on Pearson’s correlation p-values. NS = not significant. b Log2 expression of HMGA1 against HEYL in lung squamous cell carcinoma (LSCC). c Kaplan–Meier plot showing survival of LSCC patients stratified by HMGA1 and HEYL gene expression
Fig. 8
Fig. 8
NOTCH1 signalling mediates non-cell autonomous regulation of chromatin structure at the microscopic and nucleosome scale. Lateral induction of NOTCH1 activity in a signal-receiving cell by JAG1 on the surface of an adjacent cell (including cancer cells) can drive NIS. NIS cells form unique chromatin-accessible regions and microscopically ‘smoothened’ chromatin. In the context of RIS, non-cell autonomous activation of NOTCH1 signalling can repress the formation of AT-rich RAS-driven accessible regions at the nucleosome level and SAHF formation at the microscopic level. Mechanistically, N1ICD represses HMGA1, which is responsible for SAHF formation and at least partially for the formation of ectopic-accessible chromatin in RIS cells

References

    1. Salama R, Sadaie M, Hoare M, Narita M. Cellular senescence and its effector programs. Genes Dev. 2014;28:99–114. doi: 10.1101/gad.235184.113. - DOI - PMC - PubMed
    1. Coppé JP, Desprez PY, Krtolica A, Campisi J. The senescence-associated secretory phenotype: the dark side of tumor suppression. Annu. Rev. Pathol. 2010;5:99–118. doi: 10.1146/annurev-pathol-121808-102144. - DOI - PMC - PubMed
    1. Kuilman T, Peeper DS. Senescence-messaging secretome: SMS-ing cellular stress. Nat. Rev. Cancer. 2009;9:81–94. doi: 10.1038/nrc2560. - DOI - PubMed
    1. Parry AJ, Narita M. Old cells, new tricks: chromatin structure in senescence. Mamm. Genome. 2016;27:320–331. doi: 10.1007/s00335-016-9628-9. - DOI - PMC - PubMed
    1. Criscione SW, Teo YV, Neretti N. The chromatin landscape of cellular senescence. Trends Genet. 2016;32:751–761. doi: 10.1016/j.tig.2016.09.005. - DOI - PMC - PubMed

Publication types