. 2018 May 9;8(1):7420.
doi: 10.1038/s41598-018-23884-4.

Mitochondrial Complex I activity signals antioxidant response through ERK5

Affiliations

Mitochondrial Complex I activity signals antioxidant response through ERK5

Abrar Ul Haq Khan et al. Sci Rep. .

Abstract

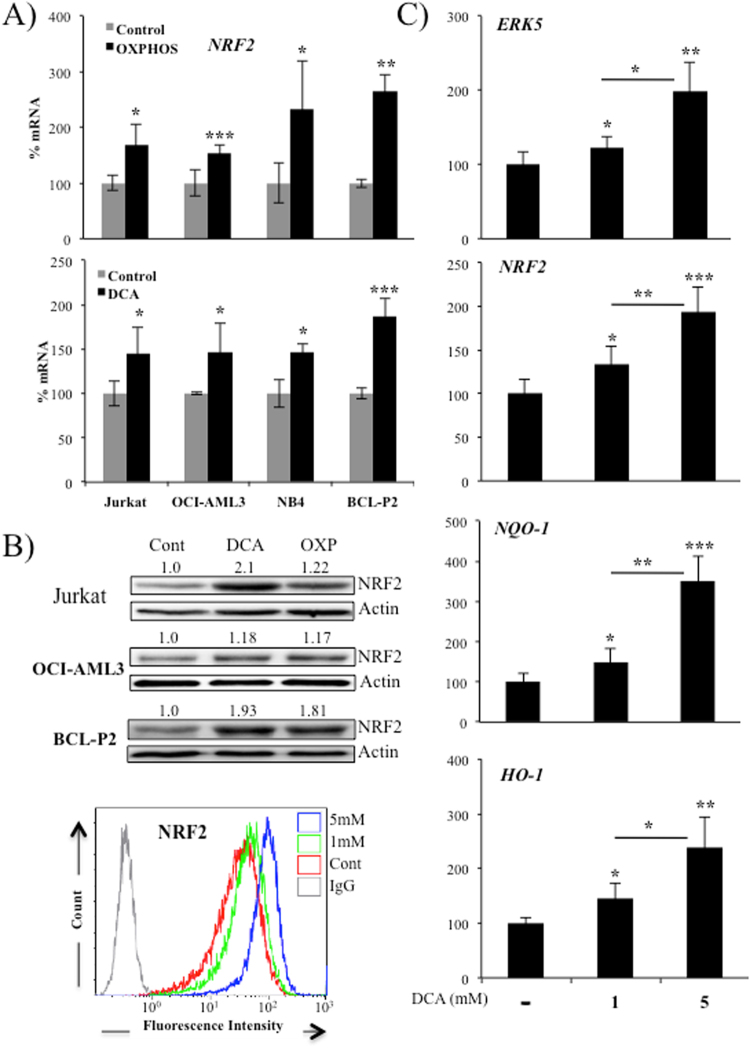
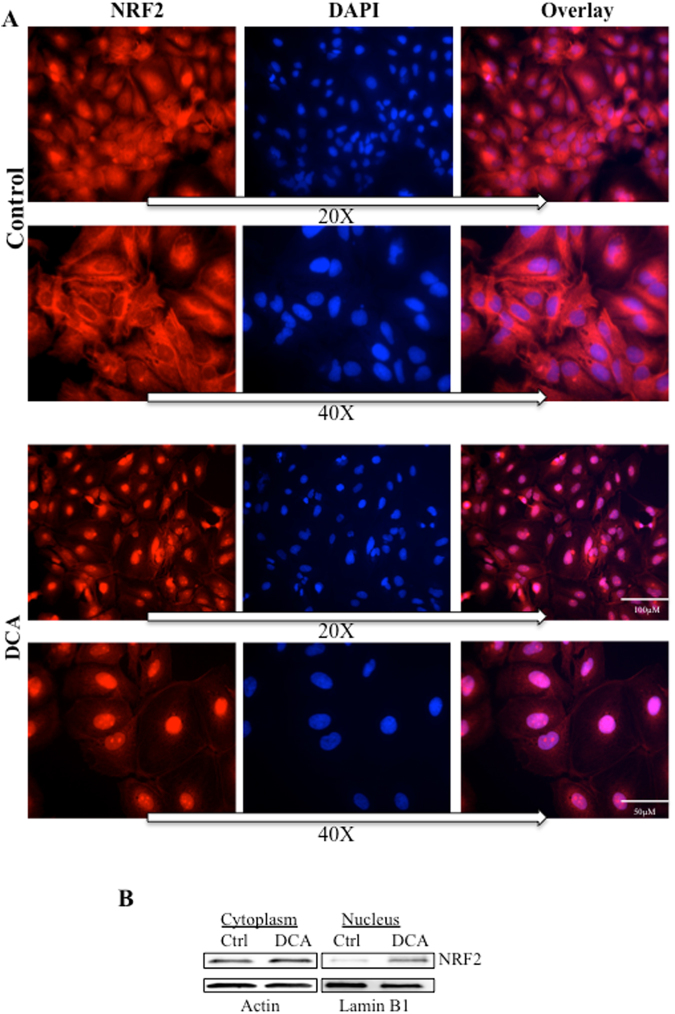
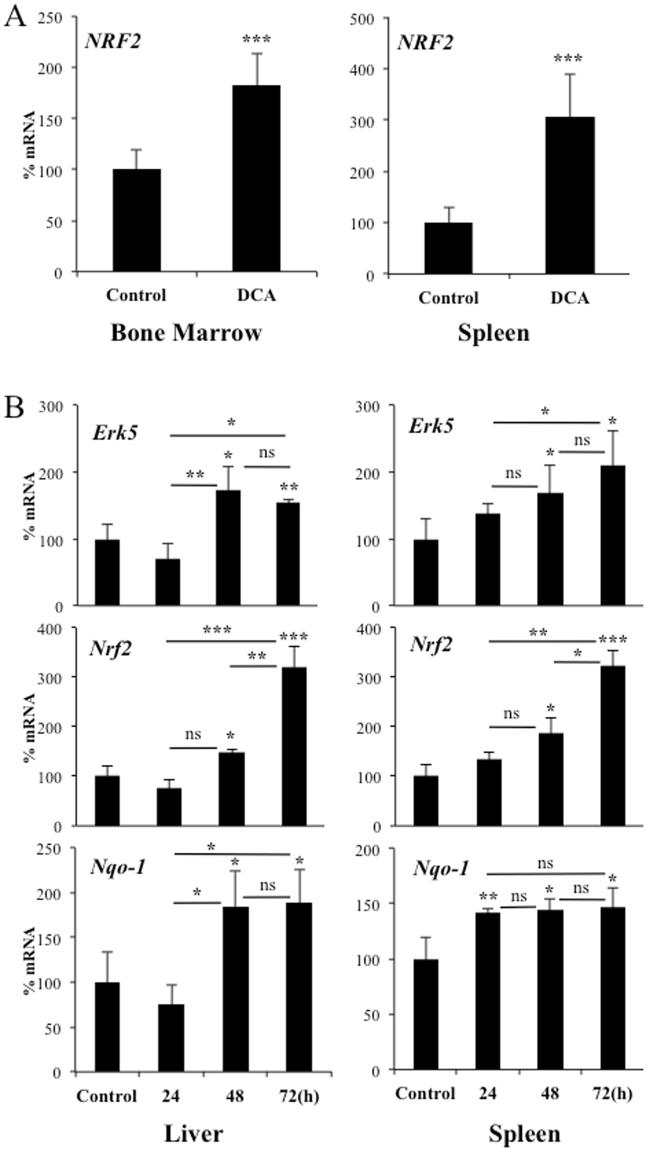
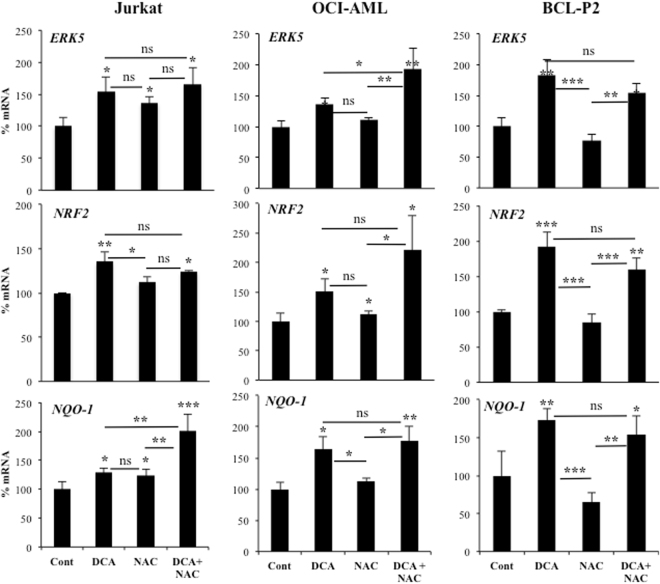
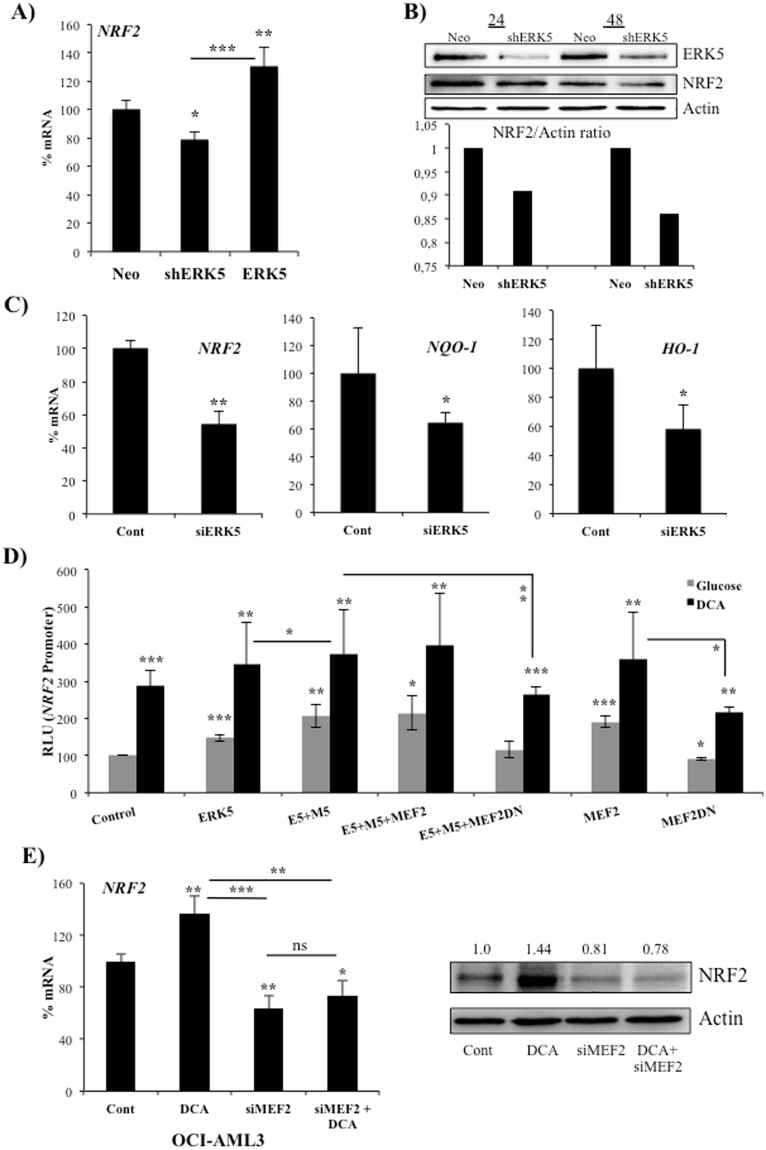
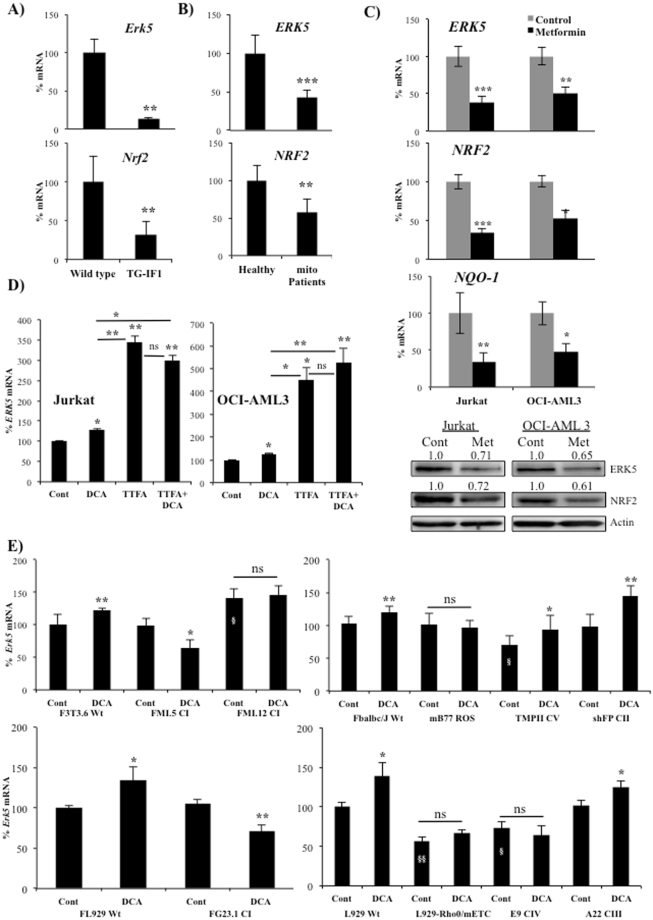
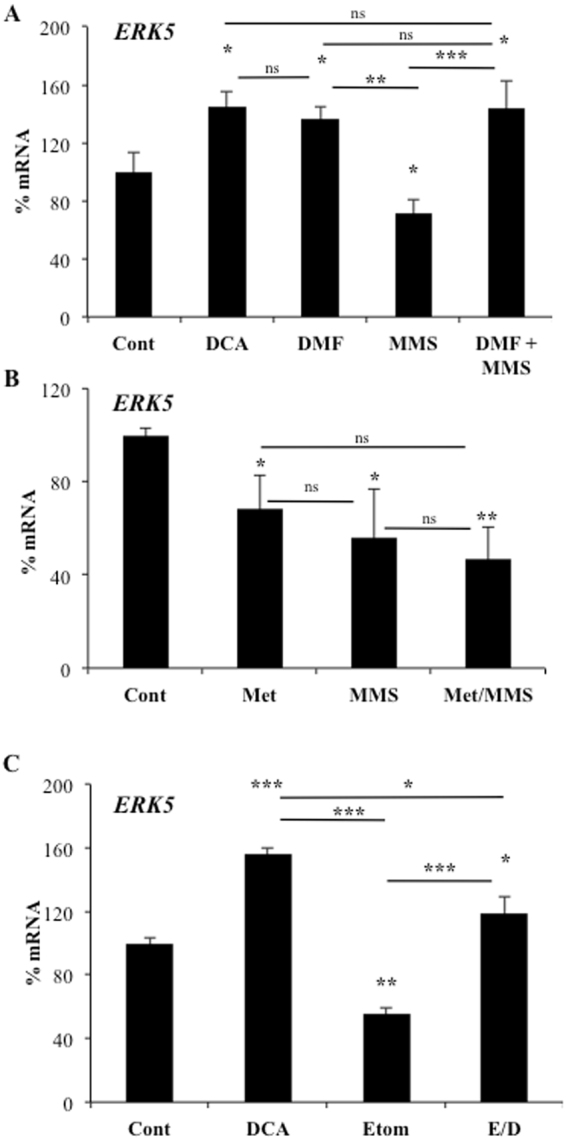
Oxidative phosphorylation (OXPHOS) generates ROS as a byproduct of mitochondrial complex I activity. ROS-detoxifying enzymes are made available through the activation of their antioxidant response elements (ARE) in their gene promoters. NRF2 binds to AREs and induces this anti-oxidant response. We show that cells from multiple origins performing OXPHOS induced NRF2 expression and its transcriptional activity. The NRF2 promoter contains MEF2 binding sites and the MAPK ERK5 induced MEF2-dependent NRF2 expression. Blocking OXPHOS in a mouse model decreased Erk5 and Nrf2 expression. Furthermore, fibroblasts derived from patients with mitochondrial disorders also showed low expression of ERK5 and NRF2 mRNAs. Notably, in cells lacking functional mitochondrial complex I activity OXPHOS did not induce ERK5 expression and failed to generate this anti-oxidant response. Complex I activity induces ERK5 expression through fumarate accumulation. Eukaryotic cells have evolved a genetic program to prevent oxidative stress directly linked to OXPHOS and not requiring ROS.


Conflict of interest statement

The authors declare no competing interests.

Figures

Figure 1
Figure 1
Cells performing OXPHOS upregulated NRF2 expression. (A) Different hematopoietic cells were incubated in OXPHOS medium or treated with 5 mM DCA for 2 weeks. NRF2 mRNA was quantified by qPCR and values normalized to β-actin mRNA. Results were represented as the % of mRNA compared to cells growing only in glucose medium. Bars show average ± SD of 3 independent experiments performed in triplicate. (B) NRF2 protein expression was analyzed in several cell lines by western blotting (upper panel) or by flow cytometry in OCI-AML3 cells. (C) Hepatocytes from 4 donors were treated with the indicated concentration of DCA for 24 h and ERK5, NRF2, NQO-1 and HO-1 mRNA were analyzed. Bars show average ± SD of the four donors performed in duplicate.
Figure 2
Figure 2
OXPHOS induced NRF2 translocation into the nucleus. (A) Huh7 cells were treated with 10 mM DCA for 48 h and nuclear translocation was revealed by immunofluorescence. (B) Jurkat cells were treated with 10 mM DCA for 48 h and NRF2 nuclear translocation was revealed by subcellular fractionation and western blotting.
Figure 3
Figure 3
Cells performing OXPHOS induce NRF2 expression in vivo. (A) NSG mice were engrafted with primary human AML cells. At day 80 post-graft, they were treated with DCA (n = 4) or leave untreated (n = 4). At day 140, mRNA from bone marrow or spleen was isolated and the expression of different human mRNA was quantified by qPCR. (B) B6 wt mice (n = 4/5 per group) were treated with a dose of DCA (50 mg/kg) everyday intraperitoneally and mouse Erk5, Nrf2 and Nqo-1 mRNA was analyzed in spleen and liver at different times. The data represent means ± SD; statistics were performed using student t-test (A) or One-way ANOVA with post-hoc Tukey test (B); *p < 0.05, **p < 0.01, ***p < 0.001. Different times posttreatment were compared to non-treated mice (control) if not specified in the graph.
Figure 4
Figure 4
Increase in ROS levels is not required for NRF2 expression. OCI-AML and HuH7 cell lines and primary leukemic cells from a BCL patient were treated with 2 mM NAC 1 h before adding DCA (10 mM) for 24 h. mRNA was analyzed as described in Fig. 1. Experiments were done in triplicate and data represent means ± SD; statistics were performed using One-way ANOVA with post-hoc Tukey test; *p < 0.05, **p < 0.01, ***p < 0.001. Treatments were compared to non-treated cells (control) if not specified in the graph.
Figure 5
Figure 5
ERK5 controls NRF2 expression. (A) 107 Jurkat-TAg cells were transfected with 5 µg of the empty pSUPER Neo vector or with this vector containing a small hairpin RNA for ERK5 (shERK5) or with a pcDNA vector expressing ERK5. Forty-eight hours later mRNA expression was analyzed by qPCR and represented as the % of mRNA compared to cells transfected with the control vector. (B) Cell transfected with control (Neo) or shERK5 were analyzed for protein expression by western blotting at 24 and 48 h post-transfection. Graphic bars show the NRF2/actin ratio of the depicted experiment. (C) Primary human hepatocytes were double transfected with control siRNA or with siRNA against ERK5 (siERK5). 96 h later mRNA was collected and mRNA expression was analyzed by qPCR. (D) 107 Jurkat-TAg cells were co-transfected with 5 μg of the following vectors ERK5 wild type, a constitutively active MEK5 mutant (MEK5D, M5), MEF2C and MEF2C with dominant negative function (MEF2DN) together with 2 μg of a luciferase reporter plasmid driven by the NRF2 promoter along with 1 μg of β-galactosidase expression vector. Cells were incubated in regular glucose media (gray bars) or containing 10 mM DCA (black bars) 24 h after transfection and analyzed 2 days later for luciferase and β-galactosidase activities. The graphic represents the relative luciferase units (RLU). (E) OCI-AML3 cells were transfected with siRNA for MEF2A and C and 24 h later treated with 10 mM DCA for 36 h. NRF2 mRNA and NRF2 protein were analyzed as in in (A) and (B) respectively. Experiments were done in triplicate. The data represent means ± SD; statistics were performed using student t-test (C) or One-way ANOVA with post-hoc Tukey test (A,D and E); *p < 0.05, **p < 0.01, ***p < 0.001. Treatments were compared to empty vector transfected cells (control) if not specified in the graph.
Figure 6
Figure 6
Inhibition of mitochondrial complex I and II signals ERK5 expression. (A) Erk5 and Nrf2 mRNA expression in the liver of wild-type and T/H (Tet-Off-H49K (h-IF1) mice. mRNA from 3 mice of each genotype was quantified by qPCR and represented as the % of mRNA compared to wild-type mice. (B) ERK5 and NRF2 mRNA expression in fibroblasts derived from a group of 8 healthy donors or 8 patients suffering from mitochondrial defects (Supplemental Table 1). (C) Different hematopoietic cell lines were incubated for 24 h with 5 mM metformin. mRNA expression was quantified by qPCR and represented as the % of mRNA compared non-treated cells. ERK5 and NRF2 protein expression was analyzed in these cell lines by western blotting (lower panel). (D) Jurkat and OCI-AML3 cells were treated with 10 mM DCA and 300 µM TTFA for 24 h. NRF2 mRNA expression was quantified by qPCR and represented as the % of mRNA compared to control cells. (E) Different cell lines described in Supplemental Table 2 were treated with 20 mM DCA during 24 hours. ERK5 mRNA was quantified by qPCR and represented as the % of mRNA compared to non-mutant control cells. Experiments were done in triplicate and data represent means ± SD; statistics were performed using student t-test (AC) or One-way ANOVA with post-hoc Tukey test (D and E); *p < 0.05, **p < 0.01, ***p < 0.001; §p < 0.05, §§p < 0.01 compare to the respective control cell lines. Treatments were compared to non-treated cells (control) if not specified in the graph.
Figure 7
Figure 7
Fumarate/succinate regulate ERK5 expression. OCI-AML3 were treated with different drug combinations and the expression of ERK5 mRNA was analyzed by qPCR. (A) OCI-AML3 cells were treated with 10 mM DCA, 5 mM MMS and/or 300 µM DMF for 24 h. (B) OCI-AML3 cells were treated with 5 mM metformin and/or 5 mM MMS for 24 h. (C) OCI-AML3 cells were treated with 5 mM DCA and/or 100 µM Etomoxir for 48 h. The data represent means ± SD; *p < 0.05, **p < 0.01, ***p < 0.005 ANOVA with post-hoc Tukey test. Treatments were compared to non-treated cells (control) if not specified in the graph.

Similar articles

Cited by

References

    1. Willems PH, Rossignol R, Dieteren CE, Murphy MP, Koopman WJ. Redox Homeostasis and Mitochondrial Dynamics. Cell Metab. 2015;22:207–218. doi: 10.1016/j.cmet.2015.06.006. - DOI - PubMed
    1. Kensler TW, Wakabayashi N. Nrf2: friend or foe for chemoprevention? Carcinogenesis. 2010;31:90–99. doi: 10.1093/carcin/bgp231. - DOI - PMC - PubMed
    1. Krajka-Kuzniak V, Paluszczak J, Baer-Dubowska W. The Nrf2-ARE signaling pathway: An update on its regulation and possible role in cancer prevention and treatment. Pharmacological reports: PR. 2017;69:393–402. doi: 10.1016/j.pharep.2016.12.011. - DOI - PubMed
    1. Scarpulla RC. Nuclear control of respiratory gene expression in mammalian cells. J Cell Biochem. 2006;97:673–683. doi: 10.1002/jcb.20743. - DOI - PubMed
    1. Kovac S, et al. Nrf2 regulates ROS production by mitochondria and NADPH oxidase. Biochim Biophys Acta. 2015;1850:794–801. doi: 10.1016/j.bbagen.2014.11.021. - DOI - PMC - PubMed

Publication types

Substances