. 2018 May 9;8(1):7358.
doi: 10.1038/s41598-018-25556-9.

Reprogramming, oscillations and transdifferentiation in epigenetic landscapes

Affiliations

Reprogramming, oscillations and transdifferentiation in epigenetic landscapes

Bivash Kaity et al. Sci Rep. .

Abstract

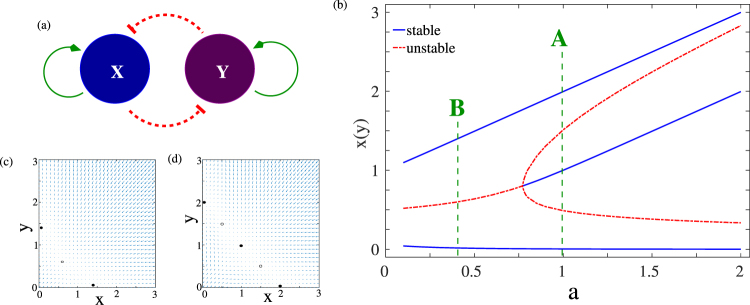
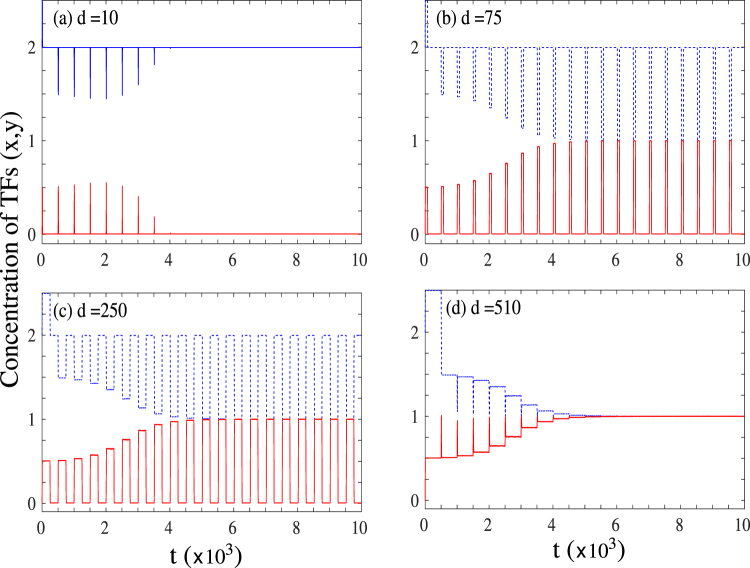
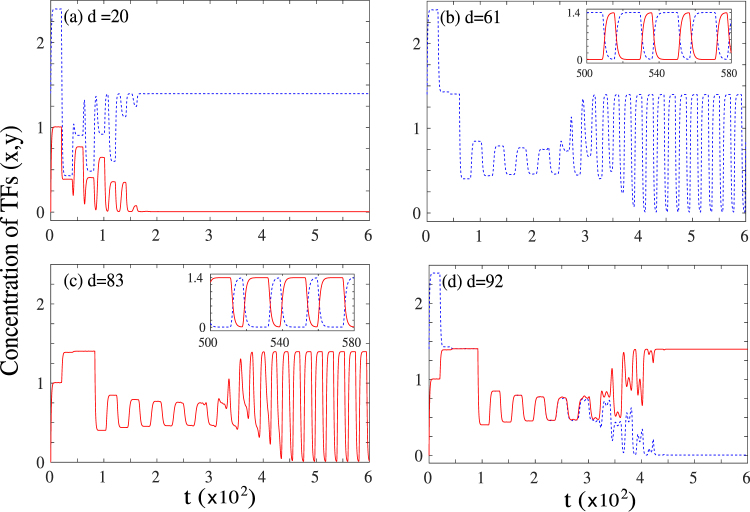
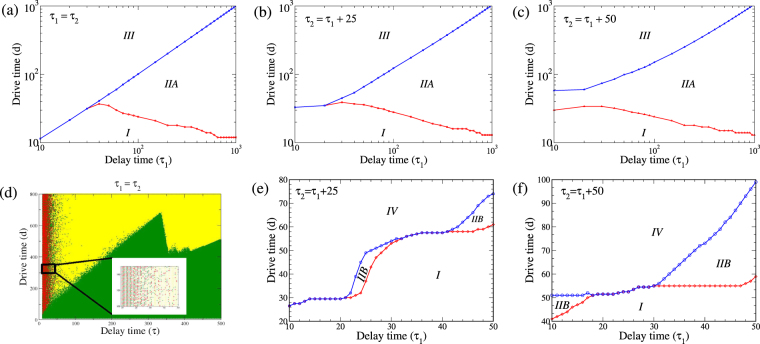
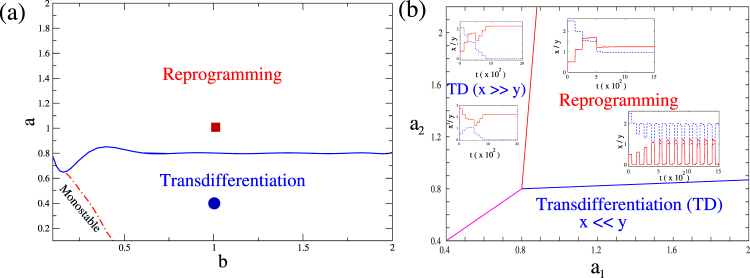
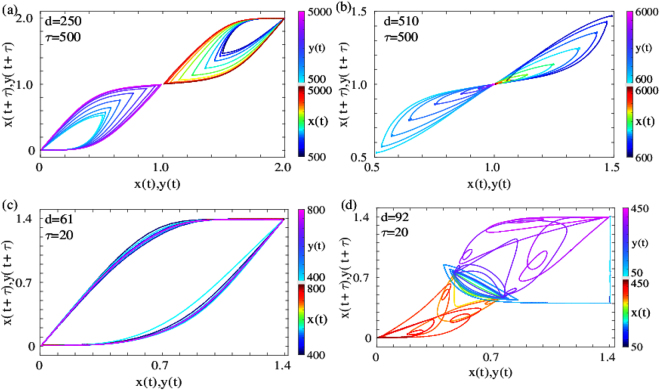
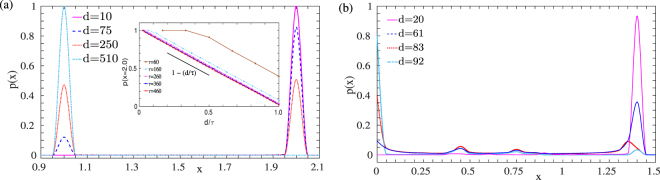
Waddington's epigenetic landscape provides a phenomenological understanding of the cell differentiation pathways from the pluripotent to mature lineage-committed cell lines. In light of recent successes in the reverse programming process there has been significant interest in quantifying the underlying landscape picture through the mathematics of gene regulatory networks. We investigate the role of time delays arising from multi-step chemical reactions and epigenetic rearrangement on the cell differentiation landscape for a realistic two-gene regulatory network, consisting of self-promoting and mutually inhibiting genes. Our work provides the first theoretical basis of the transdifferentiation process in the presence of delays, where one differentiated cell type can transition to another directly without passing through the undifferentiated state. Additionally, the interplay of time-delayed feedback and a time dependent chemical drive leads to long-lived oscillatory states in appropriate parameter regimes. This work emphasizes the important role played by time-delayed feedback loops in gene regulatory circuits and provides a framework for the characterization of epigenetic landscapes.


Conflict of interest statement

The authors declare no competing interests.

Figures

Figure 1
Figure 1
(a) A schematic of gene regulatory network. The two transcription factors X and Y are self-activating, and mutually inhibiting; (b) The bifurcation diagram of the non-delayed system of equations Eq. 1. The dashed green lines correspond to the two values of the feedback parameter a that were analysed in subsequent section. The other parameters were fixed at a0 = 0.5, b = 1.0, k = 1.0, n = 4, and S = 0.5. The velocity vector plots in the (x, y) plane for these two points are shown in (c) Regime B and (d) Regime A.
Figure 2
Figure 2
Time series of the concentrations of the two transcription factors (x/y) in regime A for four different drive times for τ = τ1 = τ2 = 500. (a) d = 10: System stays in initial undifferentiated state; (b) d = 75: Sustained oscillations with the system spending more time in the vicinity of one state than the other; (c) d = 250: Sustained oscillations with the system spending approximately equal times in the vicinity of the two states; (d) d = 510: Successful reprogramming to the undifferentiated state.
Figure 3
Figure 3
Time series of the concentrations of the two transcription factors (x/y) in regime B for four different drive times for τ = τ1 = τ2 = 20. (a) d = 20: System stays in initial undifferentiated state; (b) d = 51: Sustained oscillations in concentration of TFs. The main panel shows a single TF (x) while the inset shows a magnified view of both the TFs in a narrow window of time; (c) d = 83: Sustained oscillations in concentration of TFs. The main panel shows a single TF (y) while the inset shows a magnified view of both the TFs in a narrow window of time; (d) d = 92: Transdifferentiation to the other differentiated state.
Figure 4
Figure 4
Phase space in the drive time (d) vs. the delay time (τ1) plane for (a) Regime A: τ2 = τ1; (b) Regime A: τ2 = τ1 + 25; (c) Regime A: τ2 = τ1 + 50; (d) Regime B: τ2 = τ1. The inset shows a magnified view of a small region of this phase space to illustrate the chaotic behaviour in this regime; (e) Regime B: τ2 = τ1 + 25; (f) Regime B: τ2 = τ1 + 50. All other parameters for regime A and regime B are as defined in the text.
Figure 5
Figure 5
(a) Parameter phase plane in the positive feedback (a) vs negative feedback (b) plane for the case of symmetric parameters, a = a1 = a2 and b = b1 = b2. The parameter point shown as a red square corresponds to the parameter set for the trajectories shown in Fig. 2, while the point shown as a blue circle corresponds to the parameter set for the trajectories shown in Fig. 3. (b) Parameter phase plane in the a1 vs. a2 plane for the case of asymmetric parameters for b = 1. The insets in the reprogramming region of the phase plane show the time trajectories of the transcription factors for a1 = 1.0, a2 = 1.2, d = 150 for the reprogramming to the central attractor and a1 = 1.0, a2 = 1.2, d = 50 for the long-lived oscillatory state. The insets in the transdifferentiation region of the phase plane show the time trajectories for a1 = 0.6, a2 = 1.2, d = 500 starting from two different initial states, one with xy, which shows transdifferentiation, and the other with xy, which does not. All other parameters for both panels are the same as those in Fig. 1. All results are shown for Δτ = 25.
Figure 6
Figure 6
Trajectory plots in the x/y(t) vs. x/y(t + τ) plane for (a) Oscillatory state in regime A (state IIA). The oscillations are between the differentiated states and the central undifferentiated state, which are represented as half-cycles in this phase plane. (b) Reprogramming to the undifferentiated state in regime A (state III). Note the decaying transient oscillations in both x and y, which converge to the central steady state. (c) Oscillatory state in regime B (state IIB). The oscillations are between the two differentiated states in this regime, which is represented by single limit cycle in this phase plane. (d) Transdifferentiated state in regime B (state IV). Note the unstable oscillations around the central state preceding transdifferentiation. In all four cases, the trajectories are coloured by the time values, as shown in the corresponding colorbars.
Figure 7
Figure 7
Probability of the concentration of any one transcription factor for different values of the drive time for (a) regime A with τ = 500. The inset shows the probability near one differentiated state (x = 2) as a function of the ration of the drive to delay times d/τ; and (b) regime B with τ = 20.

References

    1. Takahashi K, Yamanaka S. Induction of Pluripotent Stem Cells from Mouse Embryonic and Adult Fibroblast Cultures by Defined Factors. Cell. 2006;126:663–676. doi: 10.1016/j.cell.2006.07.024. - DOI - PubMed
    1. Takahashi K, et al. Induction of pluripotent stem cells from adult human fibroblasts by defined factors. cell. 2007;131:861–872. doi: 10.1016/j.cell.2007.11.019. - DOI - PubMed
    1. Yu J, et al. Induced pluripotent stem cell lines derived from human somatic cells. science. 2007;318:1917–1920. doi: 10.1126/science.1151526. - DOI - PubMed
    1. Maherali N, et al. A high-efficiency system for the generation and study of human induced pluripotent stem cells. Cell Stem Cell. 2008;3:340–345. doi: 10.1016/j.stem.2008.08.003. - DOI - PMC - PubMed
    1. Ebert AD, et al. Induced pluripotent stem cells from a spinal muscular atrophy patient. Nat. 2009;457:277. doi: 10.1038/nature07677. - DOI - PMC - PubMed

Publication types