. 2018 May 9;8(1):7424.
doi: 10.1038/s41598-018-25454-0.

qSR: a quantitative super-resolution analysis tool reveals the cell-cycle dependent organization of RNA Polymerase I in live human cells

Affiliations

qSR: a quantitative super-resolution analysis tool reveals the cell-cycle dependent organization of RNA Polymerase I in live human cells

J O Andrews et al. Sci Rep. .

Abstract

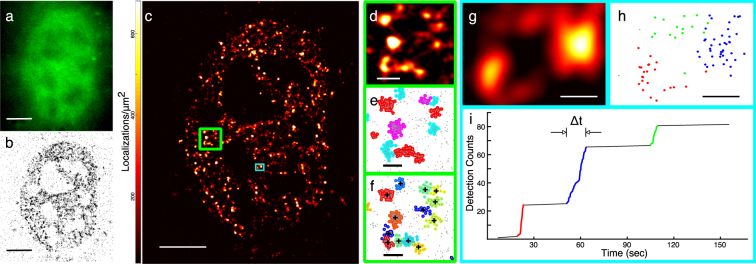
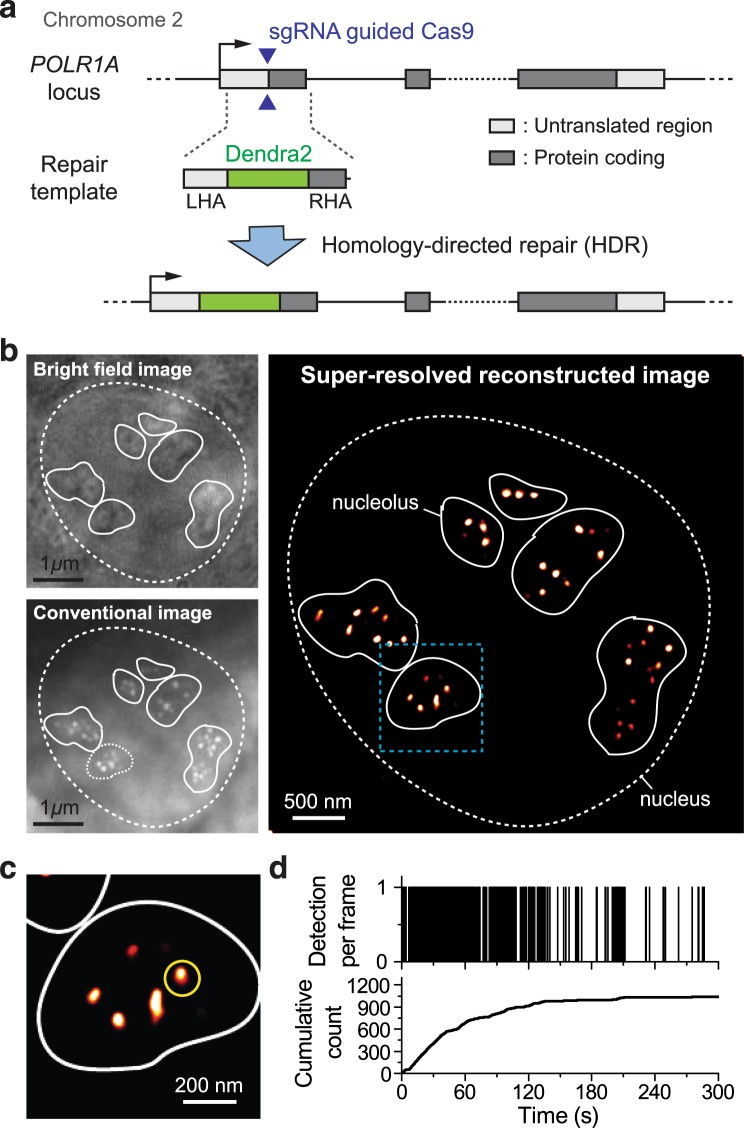
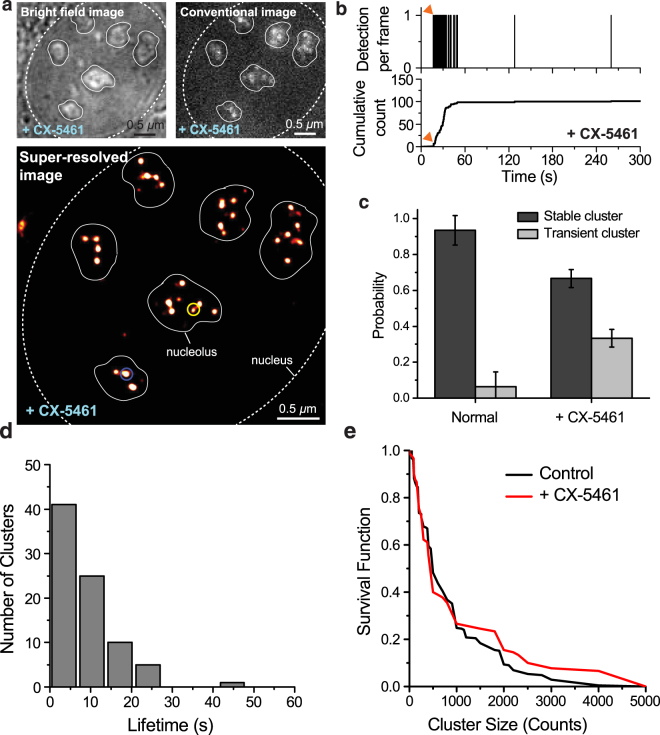
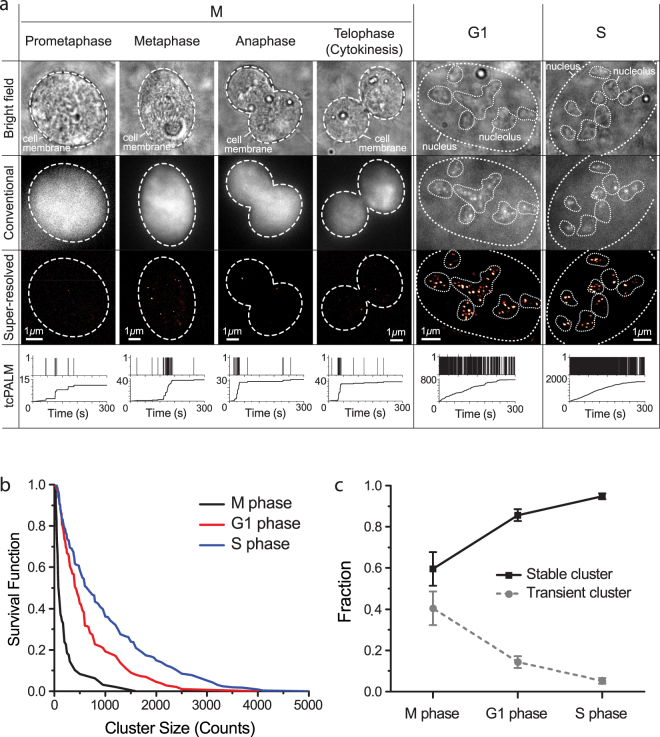
We present qSR, an analytical tool for the quantitative analysis of single molecule based super-resolution data. The software is created as an open-source platform integrating multiple algorithms for rigorous spatial and temporal characterizations of protein clusters in super-resolution data of living cells. First, we illustrate qSR using a sample live cell data of RNA Polymerase II (Pol II) as an example of highly dynamic sub-diffractive clusters. Then we utilize qSR to investigate the organization and dynamics of endogenous RNA Polymerase I (Pol I) in live human cells, throughout the cell cycle. Our analysis reveals a previously uncharacterized transient clustering of Pol I. Both stable and transient populations of Pol I clusters co-exist in individual living cells, and their relative fraction vary during cell cycle, in a manner correlating with global gene expression. Thus, qSR serves to facilitate the study of protein organization and dynamics with very high spatial and temporal resolutions directly in live cell.


Conflict of interest statement

The authors declare no competing interests.

Figures

Figure 1
Figure 1
qSR facilitates analysis of the spatial organization and temporal dynamics of proteins in live cell super-resolution data. (ac) Conventional fluorescence image, pointillist image, and super-resolution reconstruction image of RNA Polymerase II inside a living cell. (d,e) Spatial clustering of the data within the region highlighted in the large green box shown in (c) is performed using the DBSCAN algorithm embedded in qSR. (f) Spatial clustering of the same region is performed using the FastJet algorithm embedded in qSR. (gi) Time-correlation super-resolution analysis (tcPALM) reveals temporal dynamics within a region of interest (ROI) shown in (g), and highlighted in the small cyan box in (c). In (i), for the selected ROI, a plot of the cumulative number of localizations as a function of time is represented. Localizations belonging to the three temporal clusters highlighted in (i) are plotted spatially in their corresponding (red, blue, green) colors in (h). Clusters of localizations which are grouped by time in (i) are also distinctly clustered in space. Scale Bars: (ac) 5 µm; (df) 500 nm (g,h) 200 nm.
Figure 2
Figure 2
Interphase Organization and Dynamics of RNA Pol I. (a) A homologous donor vector containing the Dendra2 fluorescence protein flanked by two 500 bp homologous arms. When co-transfected with a plasmid expressing Cas9 along with a targeted sgRNA, homology directed repair at the protospacer adjacent motif (PAM) cut site induces insertion of the Dendra2 sequence onto the N-terminus of the RPA194, the largest subunit of RNA Pol I. We imaged a total of 77 cells on seven separate days. (b) Bright-field and conventional fluorescence imaging of the pre-converted state of Dendra2-RPA194 in a U2OS cell line. The nucleus is demarcated with a dashed line while the contours of the nucleoli are demarcated with a solid white line. The polymerase appears to cluster in distinct foci within the nucleoli. (c) Super-resolution reconstruction of the Dendra2-RPA194. At the super-resolution level, foci remain visible. (d) A sample time trace of the cluster marked in yellow in the super-resolution image. In the cumulative trace, the detections show an initial linear slope indicating that the cluster was pre-existing and slowly level off suggesting that the cluster is stable.
Figure 3
Figure 3
Pol I Response to CX-5461 Initiation Inhibition. (a) Bright-field, conventional and super-resolution reconstruction images of the Dendra2-RPA194 U2OS cell line after 48 hours of treatment with CX-5461. Sparse foci appear against a stronger background like in the untreated, interphase nucleus. Many dimmer foci that were not visible in the conventional image appear in the super-resolution reconstruction. (b) A sample time trace of a transient cluster (yellow circle in panel a) in the CX-5461 treated nucleus. The burst of detections occurs after a delay (~15 s, red arrow) after the beginning of acquisition, then abruptly stops, signatures of a transiently lived cluster (Supplementary Fig S3). (c) The fraction of stable vs. transient clusters in control and CX-5461 treated cells. (d) Histogram of transient cluster lifetimes in the CX-5461 treated cells. The mean lifetime is 8.7 ± 0.7 s. (e) Survival curve of stable clusters sizes for control and CX-5461 treated clusters. We analyzed a total of 10 cells imaged on three separate days. The cluster size is measured in counts, i.e., the number of localizations within the cluster.
Figure 4
Figure 4
Cell-cycle dependent organization and dynamics of RNA Polymerase I. (a) Bright-field, conventional, super-resolution images and tcPALM time traces of M, G1 and S phase cells. The upper panel of the tcPALM trace represents detections per frame; the lower panel represents the cumulative detection count. Magnified tcPALM time traces are available in Supplementary Fig. S4. (b) Survival curve of stable cluster size in M, G1 and S phase cells. The cluster size is measured in counts, i.e., the number of localizations within the cluster. (c) Portion of stable and transient clusters in M, G1 and S phase cells. We imaged a total of 29 M phase cells, 30 S phase cells and 27 G1 phase cells on nine separate days.

Similar articles

Cited by

References

    1. Betzig E, et al. Imaging Intracellular Fluorescent Proteins at Nanometer Resolution. Science. 2006;313:1642–1645. doi: 10.1126/science.1127344. - DOI - PubMed
    1. Hess ST, Girirajan TPK, Mason MD. Ultra-High Resolution Imaging by Fluorescence Photoactivation Localization Microscopy. Biophys. J. 2006;91:4258–4272. doi: 10.1529/biophysj.106.091116. - DOI - PMC - PubMed
    1. Rust MJ, Bates M, Zhuang X. Sub-diffraction-limit imaging by stochastic optical reconstruction microscopy (STORM) Nat. Methods. 2006;3:793–796. doi: 10.1038/nmeth929. - DOI - PMC - PubMed
    1. Abràmoff MD, Magalhães PJ, Ram SJ. Image processing with imageJ. Biophotonics International. 2004;11:36–41.
    1. Collins TJ. ImageJ for microscopy. BioTechniques. 2007;43:25–30. doi: 10.2144/000112517. - DOI - PubMed

Publication types