

Influences of climate change on area variation of Qinghai Lake on Qinghai-Tibetan Plateau since 1980s
- PMID: 29743516
- PMCID: PMC5943306
- DOI: 10.1038/s41598-018-25683-3
Influences of climate change on area variation of Qinghai Lake on Qinghai-Tibetan Plateau since 1980s
Abstract
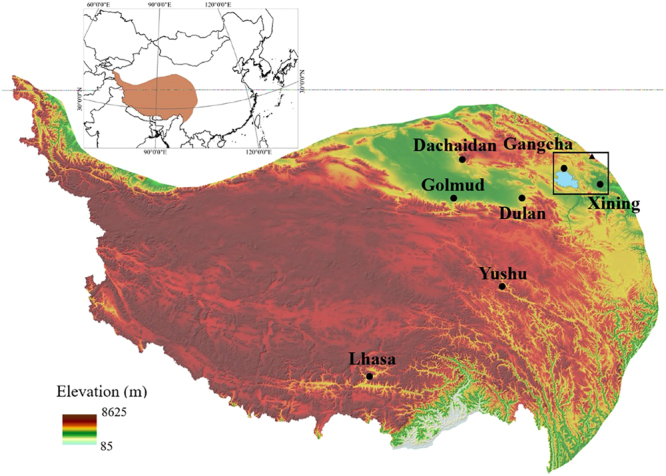
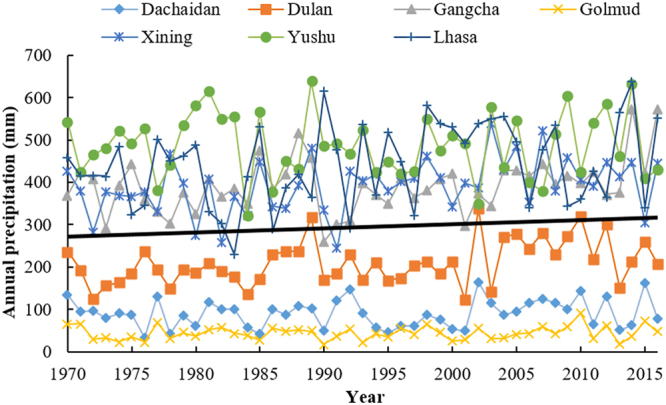
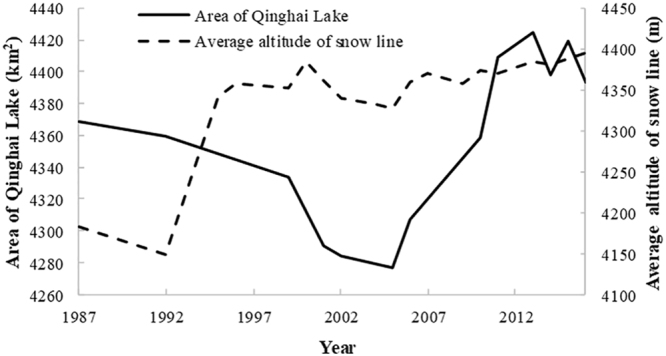
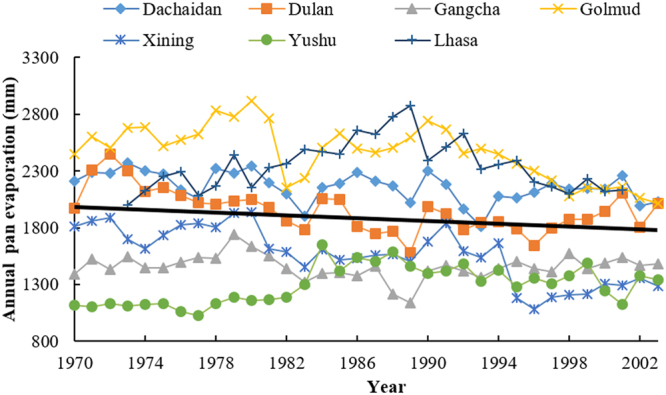
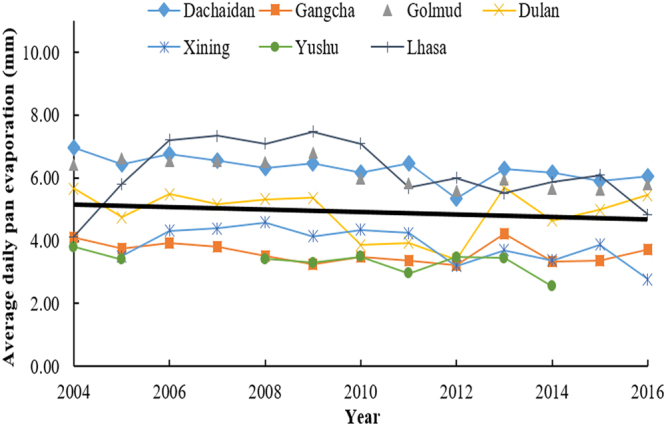
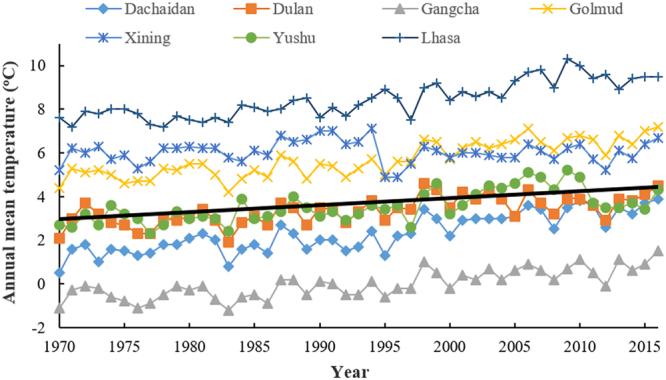
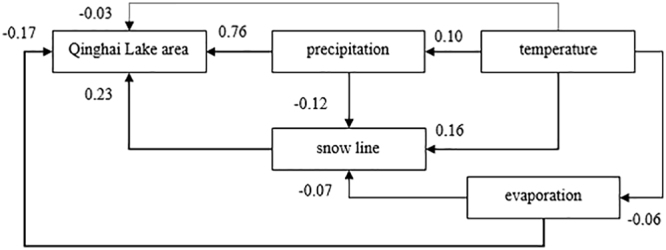
Qinghai-Tibetan Plateau is the most sensitive region to global warming on Earth. Qinghai Lake, the largest lake on the plateau, has experienced evident area variation during the past several decades. To quantify the area changes of Qinghai Lake, a satellite-based survey based on Landsat images from the 1980s to 2010s has been performed. In addition, meteorological data from all the seven available stations on Qinghai-Tibetan Plateau has been analyzed. Area of Qinghai Lake shrank ~2% during 1987-2005, and then increased ~3% from 2005-2016. Meanwhile, the average annual temperature increased 0.319 °C/10 y in the past 50 years, where the value is 0.415 °C/10 y from 2005-2016. The structural equation modeling (SEM) shows that precipitation is the primary factor influencing the area of Qinghai Lake. Moreover, temperature might be tightly correlated with precipitation, snow line, and evaporation, thereby indirectly causes alternations of the lake area. This study elucidated the significant area variation of water body on the Qinghai-Tibetan Plateau under global warming since 1980s.
Conflict of interest statement
The authors declare no competing interests.
Figures
References
-
- Mountain Research Initiative EDW Working Group. Elevation-dependent warming in mountain regions of the world. Nat. Clim. Change5, 424–430 (2015).
-
- Liu XJ, Lai ZP, Fan QS, Long H, Sun YJ. Timing for high lake levels of Qinghai Lake in the Qinghai-Tibetan Plateau since the Last Interglaciation based on quartz OSL dating. Quat. Geochron. 2010;5:218–222. doi: 10.1016/j.quageo.2009.03.010. - DOI
-
- Yan LJ, Zheng MP. The response of lake variations to climate change in the past forty years: A case study of the northeastern Tibetan Plateau and adjacent areas, China. Quat. Int. 2015;371:31–48. doi: 10.1016/j.quaint.2014.12.057. - DOI
-
- Hudson AM, Quade J. Long-term east-west asymmetry in monsoon rainfall on the Tibetan Plateau Reply. Geology. 2013;41:E312–E312. doi: 10.1130/G34774Y.1. - DOI
-
- You QL, Min JZ, Kang SC. Rapid warming in the Tibetan Plateau from observations and CMIP5 models in recent decades. Int. J. Climatol. 2016;36:2660–2670. doi: 10.1002/joc.4520. - DOI
Publication types
LinkOut - more resources
Full Text Sources
Other Literature Sources
Miscellaneous
