. 2018 May;557(7706):558-563.
doi: 10.1038/s41586-018-0104-4. Epub 2018 May 9.

Cellular milieu imparts distinct pathological α-synuclein strains in α-synucleinopathies

Affiliations

Cellular milieu imparts distinct pathological α-synuclein strains in α-synucleinopathies

Chao Peng et al. Nature. 2018 May.

Abstract

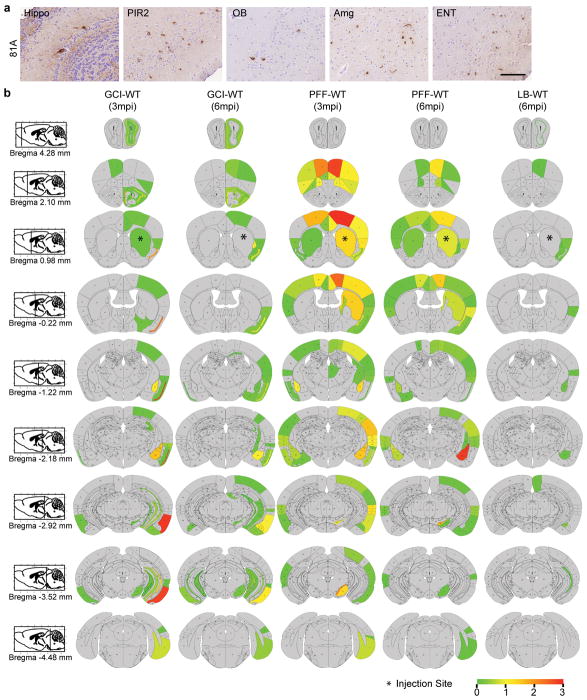
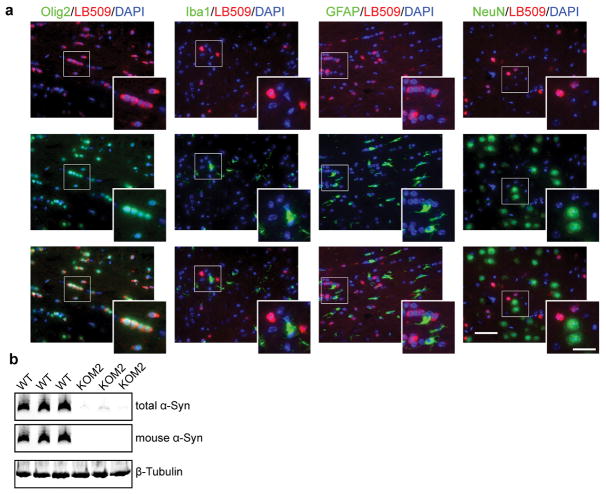
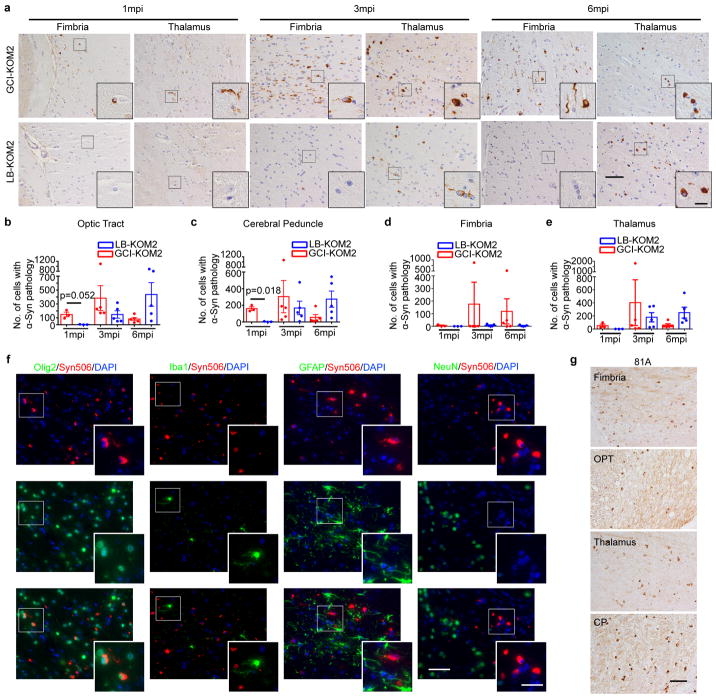
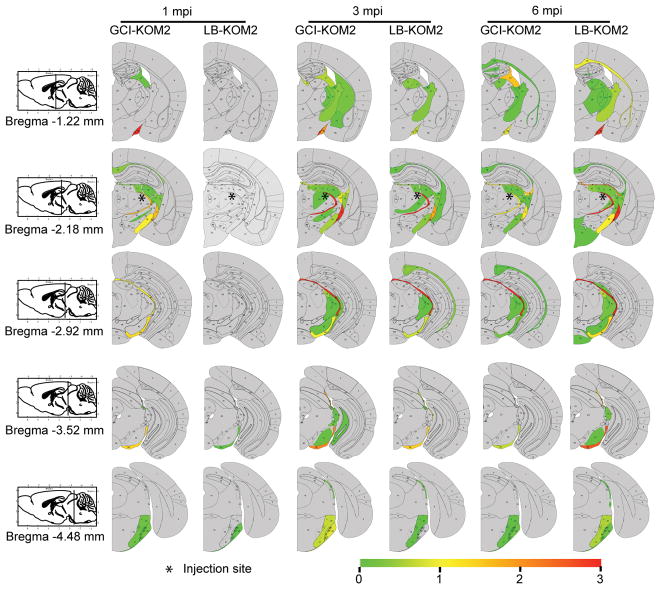
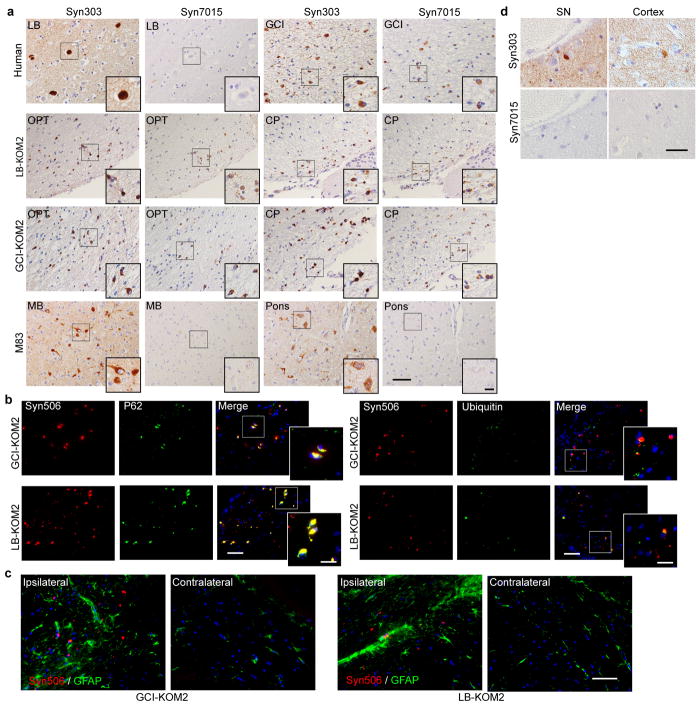
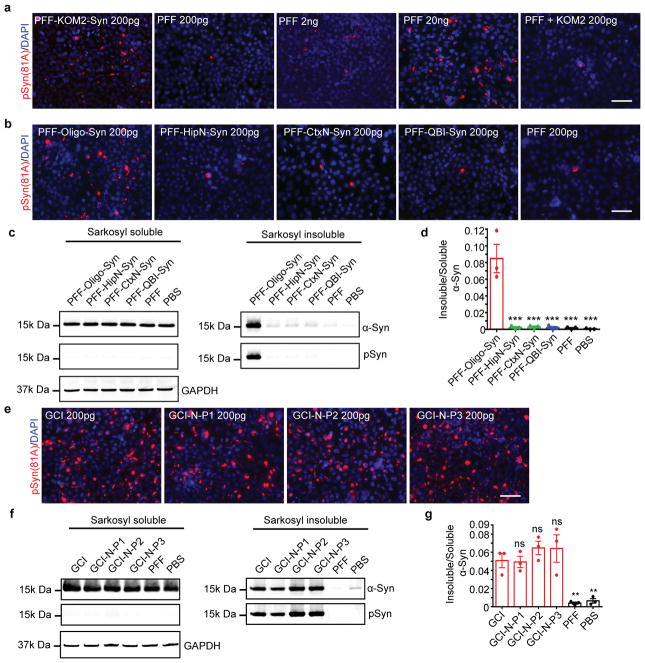
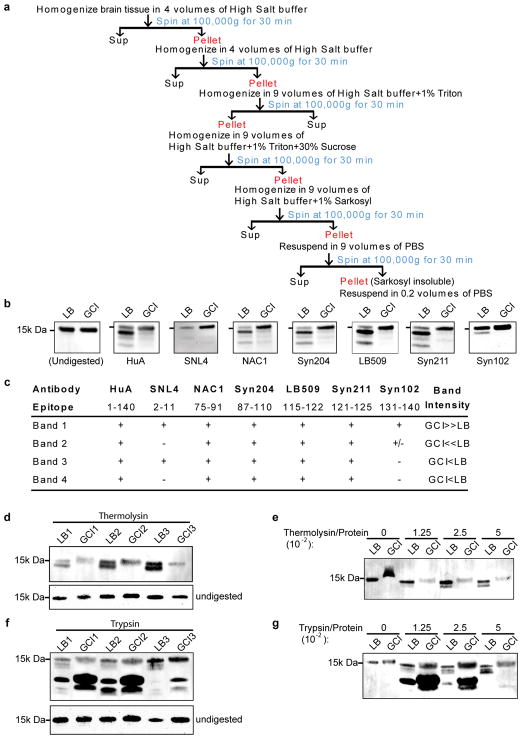
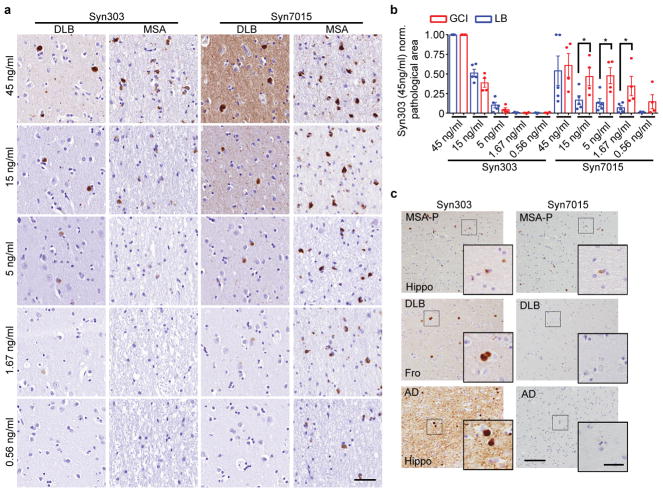
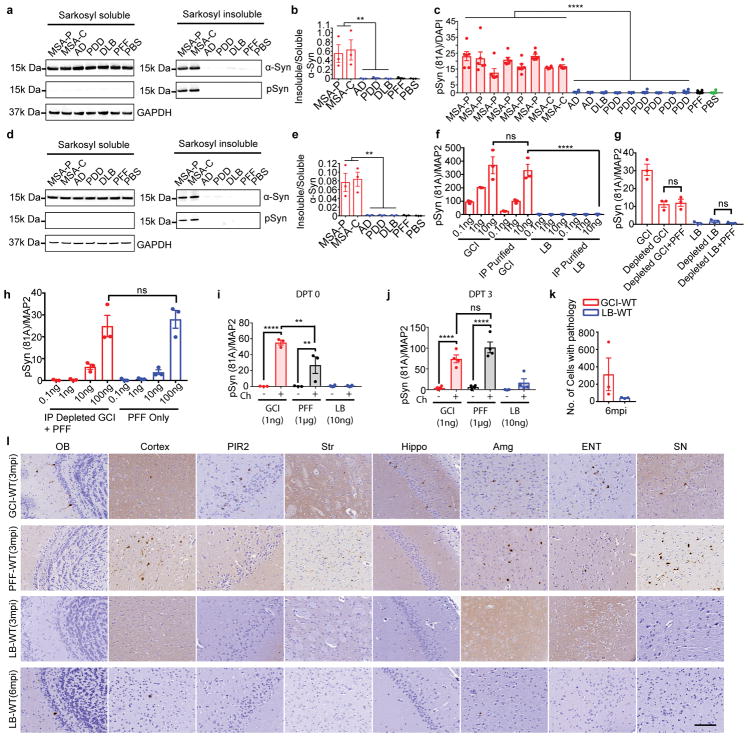
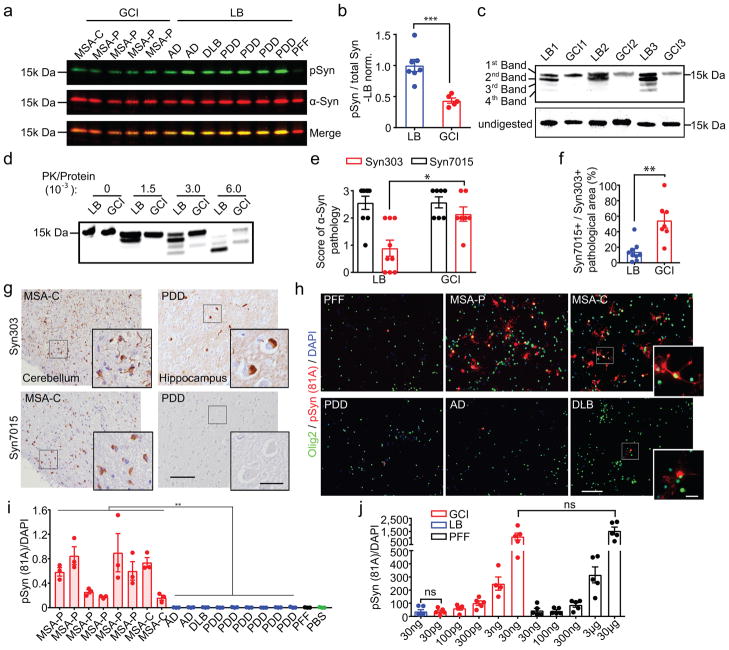
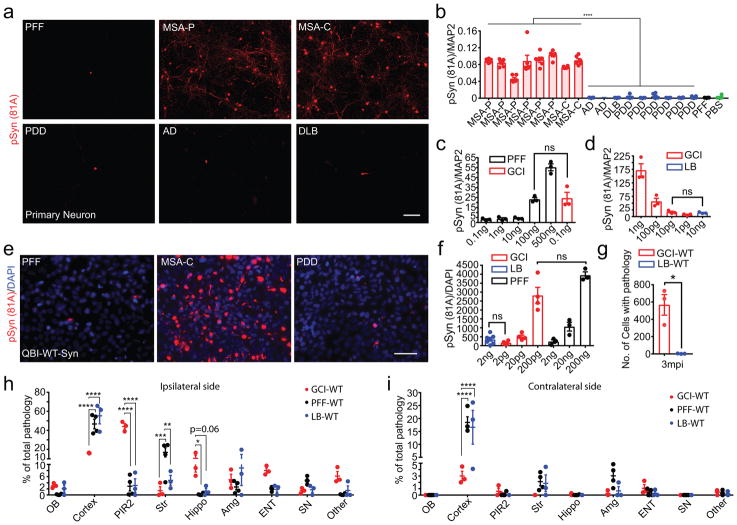
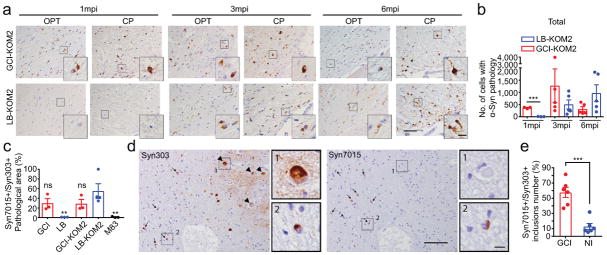
In Lewy body diseases-including Parkinson's disease, without or with dementia, dementia with Lewy bodies, and Alzheimer's disease with Lewy body co-pathology 1 -α-synuclein (α-Syn) aggregates in neurons as Lewy bodies and Lewy neurites 2 . By contrast, in multiple system atrophy α-Syn accumulates mainly in oligodendrocytes as glial cytoplasmic inclusions (GCIs) 3 . Here we report that pathological α-Syn in GCIs and Lewy bodies (GCI-α-Syn and LB-α-Syn, respectively) is conformationally and biologically distinct. GCI-α-Syn forms structures that are more compact and it is about 1,000-fold more potent than LB-α-Syn in seeding α-Syn aggregation, consistent with the highly aggressive nature of multiple system atrophy. GCI-α-Syn and LB-α-Syn show no cell-type preference in seeding α-Syn pathology, which raises the question of why they demonstrate different cell-type distributions in Lewy body disease versus multiple system atrophy. We found that oligodendrocytes but not neurons transform misfolded α-Syn into a GCI-like strain, highlighting the fact that distinct α-Syn strains are generated by different intracellular milieus. Moreover, GCI-α-Syn maintains its high seeding activity when propagated in neurons. Thus, α-Syn strains are determined by both misfolded seeds and intracellular environments.


Conflict of interest statement

There are no competing financial or non-financial interests.

Figures

Extended Data Fig. 1
Extended Data Fig. 1. Biochemical analysis of GCI-α-Syn and LB-α-Syn
(a) Schematic diagram for sequential extraction of α-synucleinopathy brains. Disease brain samples were sequentially extracted with buffer of increasing extraction strengths (1% Triton X-100 followed by 1% sarkosyl) to remove soluble proteins. (b) PK-digested GCI-α-Syn and LB-α-Syn were immunoblotted with a series of antibodies targeting specific domains of α-Syn that spanning the entire molecule. (c) Summary of the results for experiments described in (b). (d) Thermolysin-digested and undigested sarkosyl-insoluble fractions from 3 LB disease cases (LB1-LB3) and 3 MSA cases (GCI1-GCI3) were resolved on 12% Bis-Tris gel and immunoblotted with antibody against α-Syn (Syn211). (e) Sarkosyl-insoluble fractions from a pair of LB disease and MSA cases were incubated with increasing concentrations of thermolysin (with the ratio of thermolysin versus total protein range from 1.25 × 10⁻² to 5 × 10⁻²) and immunoblotted with antibody against α-Syn (Syn211). Undigested fractions were loaded on the same gel. (f) Trypsin-digested and undigested sarkosyl-insoluble fractions from 3 LB disease cases (LB1-LB3) and 3 MSA cases (GCI1-GCI3) were resolved on 12% Bis-Tris gel and immunoblotted with antibody against α-Syn (Syn211). (g) Sarkosyl-insoluble fractions from a pair of LB disease and MSA cases were incubated with increasing concentrations of trypsin (with the ratio of trypsin versus total protein range from 1.25 × 10⁻² to 5 × 10⁻²) and immunoblotted with antibody against α-Syn (Syn211). Undigested fractions were loaded on the same gel. The experiments shown in (b) and (d–g) have been repeated 3 times with similar results. For gel source data, see Supplementary Figure 1.
Extended Data Fig. 2
Extended Data Fig. 2. Syn7015 preferentially recognizes GCIs over LBs
(a) Immunohistochemistry (IHC) using a series dilution of Syn303 or Syn7015 on serial sections of a DLB brain and a MSA brain. At 45 ng/ml, Syn7015 recognized both LBs and GCIs. At lower concentrations, particularly 1.67 ng/ml and 0.56 ng/ml, Syn7015 preferentially recognizes GCIs over LBs (repeat with 4 cases). (b) Quantification of the area occupied by pathological α-Syn stained with serial dilutions of Syn7015 or Syn303 on serial sections of 2 MSA-P, 2 MSA-C, 1AD, 2PDD and 2DLB cases. The results for each case are normalized to Syn303 staining at 45 ng/ml. (GCI, n=4; LB, n=5 cases). (c) α-Syn pathology revealed by Syn303 or Syn7015 in adjacent sections from LB disease and MSA cases (repeat with 7 cases). Results shown as mean ± standard error of the mean [SEM] (*p < 0.05). Scale bar: 50μm (a), 100 μm (c), 25 μm [(c) inset]. See Supplementary Table 5 for statistical details.
Extended Data Fig. 3
Extended Data Fig. 3. GCI-α-Syn is more potent to induce α-Syn pathology in primary oligodendrocytes
(a) Oligodendrocytes treated with the same amount of GCI-α-Syn, LB-α-Syn or PFF were sequentially extracted with 1% Triton-X100 lysis buffer followed by 1% Sarkosyl lysis buffer, which were combined together as the Sarkosyl soluble fraction. The Sarkosyl insoluble pellets were resuspended in DPBS by sonication. Both soluble and insoluble fractions were immunoblotted with antibody against total or S129 phosphorylated α-Syn. (b) Densitometric quantification of insoluble/soluble α-Syn for experiments described in (a) (n=3 independent experiments). (c–d) Primary oligodendrocyte cultures were immunostained with antibodies against various cell type specific markers: CNP (oligodendrocytes), olig2 (oligodendrocytes), Iba1 (microglial cells), NeuN (neurons), GFAP (astrocytes), PLP (oligodendrocytes) at day in vitro 3 (DIV3) (c) or DIV9 (d). (e) Insoluble phosphorylated α-Syn induced in primary oligodendrocytes overexpressing α-Syn were co-stained with antibodies against various cell type specific markers demonstrating that the cells with α-Syn pathology are oligodendrocytes. (f) Percentage of different type of cells (oligodendrocytes, microglial and astrocytes) in oligodendrocyte culture, at DIV3 (the time point for virus infection), DIV9 (the time point for misfolded α-Syn treatment) and DIV23 (the time point for fixation) (DIV3, n=3; DIV9, n=5, DIV23, n=5 coverslips from three independent experiments). (g) Working hypotheses on the different cell-type distributions of GCI-α-Syn and LB-α-Syn strains in diseased brains. Hypothesis 1: The unique properties of GCI-α-Syn and LB-α-Syn strains determine their different cell type distribution. GCI-α-Syn strain (represented by red spheres) is more efficient in inducing α-Syn pathology in oligodendrocytes, while LB-α-Syn strain (green spheres) is more efficient in inducing α-Syn pathology in neurons. Hypothesis 2: GCI-α-Syn and LB-α-Syn strains do not have cell type preference, they could be initiated by the same misfolded α-Syn seeds (grey spheres), but the different intracellular environment of neurons and oligodendrocytes convert them to different strains. Results shown as mean ± standard error of the mean [SEM] (**p < 0.01). Scale bars: 100μm (c) and (d); 50μm (e). The experiments shown in (a) and (c–e) have been repeated 3 times with similar results. See Supplementary Table 5 for statistical details. For gel source data, see Supplementary Figure 1.
Extended Data. Fig. 4
Extended Data. Fig. 4. The seeding properties of GCI-α-Syn and LB-α-Syn do not show cell type preference
(a) Soluble and insoluble fractions from primary neurons treated with the same amount of GCI-α-Syn, LB-α-Syn or PFF were immunoblotted with antibodies against total or S129 phosphorylated α-Syn. (b) Densitometric quantification of insoluble/soluble α-Syn for experiments described in (a) (n=3 independent experiments). (c) Quantification of phosphorylated α-Syn in QBI-WT-Syn cells induced by equal amount of GCI-α-Syn (MSA-C, MSA-P), LB-α-Syn (PDD, DLB and AD) or PFFs. (GCI, n=8; LB, n=9 different preparations) (d) Soluble and insoluble fractions from QBI-Syn-WT cells treated with the same amount of GCI-α-Syn, LB-α-Syn or PFF were immunoblotted with antibody against total or S129 phosphorylated α-Syn. (e) Densitometric quantification of insoluble/soluble α-Syn for experiments described in (d) (n=3 independent expreiments). (f) Quantification of insoluble phosphorylated α-Syn in primary neurons induced by various concentrations of GCI-α-Syn and LB-α-Syn before or after IP purification (n=3 independent experiments). (g) Quantification of insoluble phosphorylated α-Syn in primary neurons incubated with (1) GCI-α-Syn and LB-α-Syn preparations; (2) the same preparations after IP depletion to remove α-Syn; and (3) the depleted preparation to which the same amount of α-Syn PFFs (1ng) was added (n=3 independent experiments). (h) PFFs combined with the GCI-α-Syn preparation depleted of α-Syn behave similar to α-Syn PFFs alone. Quantification of insoluble phosphorylated α-Syn in primary neurons seeded by PFFs alone or PFFs combined with depleted GCI preparation (subtract the amount of pathology induced by IP depleted GCI preparation alone) (n=3 independent experiments). (i–j) Primary neuron were treated with GCI-α-Syn, LB-α-Syn or PFF and incubate with chloroquine (Ch) at the day of misfolded α-Syn treatment (DPT0) or 3 days post treatment (DPT3). The amount of insoluble phosphorylated α-Syn were quantified 3 days after chloroquine treatment (DPT0-GCI and PFF, n=3; DPT0-LB, n=4; DPT3, n=4 independent experiments). (k) Quantification of the number of cells with α-Syn pathology in WT mice inoculated with 50 ng of GCI-α-Syn or LB-α-Syn at 6 mpi. (l) Representative photomicrographs of α-Syn pathology (stained by Syn506) in multiple brain regions ipsilateral to the injection site in GCI-α-Syn, PFF and LB-α-Syn injected WT mice. OB: olfactory bulb; Cortex: motor cortex; PIR2: pyramidal layer of piriform area; Str: striatum; Hippo: hippocampus; Amg: Amygdala; ENT: entorhinal cortex; SN: substantia nigra. Results shown as mean ± standard error of the mean [SEM] (*p < 0.05;**p < 0.01;****p < 0.0001; ns: not significant). Statistics shown in (c) is two-tail, unpaired t-test using the mean value of each case. Statistics shown in (f) is one-way Anova with Tukey’s multiple comparison test. Statistics shown in (g–h) are two-tail, unpaired t-test adjusted with Bonferroni correction for multiple comparison. Statistics shown in (i–j) are two-way ANOVA, with Sidak’s multiple comparisons test. The experiments in (a), (d) and (l) has been repeated 3 times with similar results. Scale bar: 100 μm. See Supplementary Table 5 for statistical details. For gel source data, see Supplementary Figure 1.
Extended Data Fig. 5
Extended Data Fig. 5. Distribution of α-Syn pathology in injected WT mice
(a) Representative photomicrographs of α-Syn pathologies stained by antibody against S129-phosphorylated α-Syn (81A) in multiple brain regions in GCI-α-Syn injected WT mice (repeat 3 times). (b) Heat map for the distribution of α-Syn pathology in wild-type mice injected with GCI-α-Syn, PFF or LB-α-Syn. GCI-α-Syn, LB-α-Syn and α-Syn PFF were unilaterally injected into the dorsal striatum of wild-type (WT) mice. The seeded α-Syn pathology was analyzed and graded by IHC with Syn506. The data were presented as heat maps to semi-quantitatively demonstrate the CNS distribution of α-Syn pathology. Each panel represents a coronal plane (Bregma 4.28, 2.10, 0.98, −0.22,−1.22,−2.18, −2.92, −3.52, −4.48mm) for each treatment group. Left column illustrates sagittal views of the corresponding coronal planes. (GCI-WT, n=3; PFF-WT, n=4; LB-WT, n=3 mice). Scale bar: 100 μm (a).
Extended Data Fig. 6
Extended Data Fig. 6. Characterization of KOM2 mice
(a) Brain sections from KOM2 mice were double labeled with antibodies against α-Syn (LB509) and various cell type specific markers: Olig2 (oligodendrocytes), Iba1 (microglial cells), GFAP (astrocytes) and NeuN (neuron). α-Syn is only expressed in oligodendrocytes in KOM2 mice. (b) Brain lysates of WT and KOM2 mice were immunoblotted with antibody against total α-Syn (Syn 9027), mouse α-Syn (Cell Signaling) and beta-tubulin. Scale bars: 50 μm (a); 25μm (a) inset. The experiments in (a–b) has been repeated 3 times with similar results. For gel source data, see Supplementary Figure 1.
Extended Data Fig. 7
Extended Data Fig. 7. Induction of oligodendroglial α-Syn pathology in KOM2 mice
(a) Syn506 positive α-Syn aggregates seeded by equal amounts of GCI-α-Syn or LB-α-Syn (18.75 ng) in KOM2 mice at 1, 3 and 6 month post-injection in fimbria and thalamus (b–e) Quantification of the number of oligodendrocytes with α-Syn pathology in optic tract (b), cerebral peduncle (c), fimbria (d), and thalamus (e) at different time points. (1mpi, n=3; 3&6 mpi, n=5 mice) (f) Brain sections from GCI-α-Syn injected KOM2 mice were double labeled with antibodies against misfolded α-Syn (Syn506) and various cell type specific markers. The induced α-Syn pathologies are located in oligodendrocytes in KOM2 mice. (g) GCI-α-Syn injected KOM2 mouse brain sections were stained with an antibody against phosphorylated α-Syn (81A). Results shown as mean ± SEM. Scale bars: 50 μm [(a), (f) & (g)]; 12.5 μm [(a) insets]; 25 μm [(f) insets]. The experiments in (a), (f) and (g) has been repeated 3 times with similar results. Statistics shown in (b–c) are two tail unpaired T-test adjusted with Bonferroni correction. See Supplementary Table 5 for statistical details.
Extended Data Fig. 8
Extended Data Fig. 8. Distribution of α-Syn pathology in injected KOM2 mice
Heat maps to semi-quantitatively demonstrate the CNS distribution of α-Syn pathology in KOM2 mice unilaterally injected with GCI-α-Syn or LB-α-Syn into thalamus. α-Syn pathologies were analyzed and graded by IHC with Syn506 at 1 month (n=3), 3 month (n=5) and 6 month (n=5) post injection. Each panel represents a coronal plane (bregma −1.22, −2.18, −2.92, −3.52, −4.48mm) for each treatment group. Since there is no α-Syn pathology in the contralateral side, only the ipsilateral side is shown. The left column illustrates sagittal views of the corresponding coronal planes.
Extended data Fig. 9
Extended data Fig. 9. Oligodendrocyte environment generate the GCI-α-Syn strain
(a) IHC of adjacent sections from human or mouse brains with Syn303 and Syn7015. First row: adjacent brain sections of LB disease and MSA cases used for the extraction of LB-α-Syn and GCI-α-Syn for injection. Second row: adjacent brain sections of KOM2 mice injected with LB-α-Syn prepared from the brain tissue shown in the first row. OPT and CP are shown here. While the LB-α-Syn used for the injections is Syn7015 negative, the induced oligodendrocyte pathology is Syn7015 positive. Third row: adjacent brain sections of KOM2 mice injected with GCI-α-Syn prepared from the brain sample shown in the first row. OPT and CP were shown. Forth row: adjacent brain sections of M83 mice with α-Syn pathology. Midbrain (MB) and pons are shown. (b) Brain sections from KOM2 mice injected with GCI-α-Syn or LB-α-Syn in the thalamus were double labeled with Syn506 and antibodies against P62 (left panel) or ubiquitin (right panel). (c) Brain sections from GCI-α-Syn or LB-α-Syn injection KOM2 mice were double labeled with Syn506 and GFAP. Both ipsilateral and contralateral optic tracts are shown here. (d) Adjacent sections of substantia nigra (SN) and cortex from 2 different MSA cases were stained with Syn7015 and Syn303. Scale bars: 50 μm (a,b,c); 12.5 μm [(a) insets]; 20μm [(b) inset]. 30 μm (d). The experiments in (a–d) has been repeated 3 times with similar results.
Extended Data Fig. 10
Extended Data Fig. 10. α-Syn pathology induced by passaged PFF and GCI
(a) Insoluble phosphorylated α-Syn in QBI-WT-Syn cells seeded by α-Syn PFFs, α-Syn PFFs that have been passaged in KOM2 mice (PFF-KOM2-Syn) or α-Syn PFFs that were combined with sarkosyl insoluble fraction prepared from uninjected KOM2 mice (PFF+KOM2). (b) Insoluble phosphorylated α-Syn in QBI-WT-Syn cells induced by equal amount (200pg) of PFF-Oligo-Syn, PFF-HipN-Syn, PFF-CtxN-Syn, PFF-QBI-Syn and α-Syn PFFs. (c) Soluble and insoluble fractions from QBI-Syn-WT cells treated with the same amount of PFF-oligo-Syn, PFF-HipN-Syn, PFF-CtxN-Syn, PFF-QBI-Syn and PFF were immunoblotted with antibodies against total or S129 phosphorylated α-Syn. (d) Densitometric quantification of insoluble/soluble α-Syn for experiments described in (c) (n=3 independent experiments). (e) Insoluble phosphorylated α-Syn in QBI-WT-Syn cells induced by GCI-α-Syn and GCI-α-Syn that has been passaged in primary neurons for multiple times, i.e. GCI-N-P1, GCI-N-P2, GCI-N-P3. (f) Soluble and insoluble fractions from QBI-Syn-WT cells treated with the same amount of GCI, GCI-N-P1, GCI-N-P2, GCI-N-P3 and PFF were immunoblotted with antibodies against total α-Syn or S129 phosphorylated α-Syn. (g) Densitometric quantification of insoluble/soluble α-Syn for experiments described in (f) (n=3 independent experiments). Statistics shown in (d), and (g) are one-way ANOVA followed by Dunnett post hoc test comparing each group with PFF-Oligo-Syn in (d) or GCI in (g). Results shown as mean ± standard error of the mean [SEM]; (**p<0.01; ***p<0.01; ns: not significant). Scale bars: 50 μm (a), (b) and (e). The experiments in (a–c) and (e–f) has been repeated 3 times with similar results. See Supplementary Table 5 for statistical details. For gel source data, see Supplementary Figure 1.
Fig. 1
Fig. 1. GCI-α-Syn and LB-α-Syn represent two distinct strains
(a) GCI and LB immunoblotted with antibodies against total or pS129 α-Syn. (b) Quantification of pS129 versus total α-Syn in (a) (GCI, n=5; LB, n=7 cases). (c) PK-digested LB-α-Syn and GCI-α-Syn from 6 cases immunoblotted with anti-α-Syn MAb (Syn211). (d) GCI-α-Syn and LB-α-Syn incubated with increasing concentrations of PK and immunoblotted with Syn211 (repeat 3 times). (e) Semi-quantitative scores (0–3) to quantify α-Syn pathology revealed by Syn303 or Syn7015 immunohistochemistry (IHC) in adjacent MSA or LB disease brain sections. (LB, n=9; GCI, n=7 cases) (statistics: Mann Whitney U test). (f) Quantification of area occupied by Syn7015+ versus Syn303+ α-Syn pathology for experiments in (e). (LB, n=9, GCI, n=7 cases). (g) Representative photomicrographs for experiments in (e) (repeat with 7 cases). (h) Primary oligodendrocytes expressing α-Syn-mCherry incubated with 13 ng GCI-α-Syn, LB-α-Syn or PFFs were stained with 81A (pS129 α-Syn) and anti-olig2 (repeat 4 times). (i) Quantification of pS129 α-Syn induced by GCI-α-Syn, LB-α-Syn and PFF in oligodendrocytes expressing α-Syn (GCI, n=8; LB, n=9 different preparations). (statistics: two tail, unpaired t-test using the mean value of each case). (j) Quantification of pS129 α-Syn induced by various amounts of PFFs, GCI-α-Syn or LB-α-Syn in oligodendrocytes expressing α-Syn (LB, n=6; GCI 3ng, n=4; other groups, n=5 biological replicates) (statistics: adjusted with Bonferroni correction). Results shown as mean ± standard error of the mean (SEM) (*p < 0.05, **p < 0.01; ***p < 0.001; ****p < 0.0001; ns: not significant). Scale bars: 100 μm [(g) and (h)], 25 μm [(g) inset], 10 μm [(h) inset]. For gel source data, see Supplementary Figure 1. See Supplementary Table 5 for statistical details.
Fig. 2
Fig. 2. The seeding properties of GCI-α-Syn and LB-α-Syn do not show any cell type preference
(a) pS129 α-Syn induced by 1 ng GCI-α-Syn, LB-α-Syn or PFFs in primary neurons (repeat 7 times). (b) Quantification of α-Syn pathology for experiments in (a) (GCI, n=8, LB, n=9 different preparations) (statistics: two tail, unpaired t-test using the mean value of each case.). (c–d) Quantification of pS129 α-Syn induced by various concentrations of PFFs, GCI-α-Syn or LB-α-Syn in neurons (n=3 biological replicates) (statistics: adjusted with Bonferroni correction). (e) pS129 α-Syn induced by 2 ng GCI-α-Syn, LB-α-Syn or PFFs in QBI-WT-Syn (repeat 7 times). (f) Quantification of pS129 α-Syn induced by various concentration of PFFs, GCI-α-Syn or LB-α-Syn in QBI-WT-Syn Cells. (LB, n=7; GCI, n=4; PFF, n=3 biological replicates) (statistics: adjusted with Bonferroni correction). (g) Quantification of the number of cells with α-Syn pathology in WT mice inoculated with 50 ng GCI-α-Syn or LB-α-Syn at 3 mpi (n=3 mice). (h–i) Quantification of the distribution of α-Syn pathology seeded by GCI-α-Syn (GCI-WT, n=3 mice) or PFFs (PFF-WT, n=4 mice) at 3 mpi and LB-α-Syn (LB-WT, n=3 mice) at 6mpi. OB: olfactory bulb; Cortex: cortex except pyramidal layer of piriform area (PIR2) and entorhinal cortex (ENT); Str: striatum; Hippo: hippocampus; SN: substantia nigra. Results shown as mean ± SEM. Statistics shown in (h–i) are two-way ANOVA followed by Tukey’s HSD. Scale bars: 100 μm (a), 50 μm (e). See Supplementary Table 5 for statistical details.
Fig. 3
Fig. 3. Oligodendrocyte environment generate the GCI-α-Syn strain
(a) Syn506+ α-Syn aggregates seeded by 18.75 ng GCI-α-Syn or LB-α-Syn in KOM2 mice. OPT: optic tract; CP: cerebral peduncle (repeat 3 times). (b) Quantification of the number of oligodendrocytes with α-Syn pathology in injected KOM2 mice (1 mpi, n=3; 3 and 6 mpi, n=5 mice). (Statisitcs: adjusted with Bonferroni correction.) (c) Quantification of the ratio of area occupied by Syn7015+ versus Syn303+ α-Syn pathology in adjacent sections of MSA, LB disease, injected KOM2 or M83 TG mouse brains (GCI, n=3 cases; LB n=3 cases; GCI-KOM2, LB-KOM2 and M83 n=4 mice). (Statisitcs: one-way ANOVA followed by Dunnett post hoc test comparing each group with LB-KOM2.) (d) Adjacent sections of the medulla from an MSA case stained with Syn303 and Syn7015 (repeat with 4 cases). Arrows: GCIs; arrowheads: NIs. (e) Quantification of the ratio of Syn7015+ versus Syn303+ GCIs and NIs on adjacent sections of MSA brains (n=6 cases). Results shown as mean ± SEM. Scale bars: 50 μm (a); 12.5 μm [(a) insets]; 100 μm (d); 10 μm [(d) insets]. See Supplementary Table 5 for statistical details.
Fig. 4
Fig. 4. Oligodendrocytes convert misfolded α-Syn to a GCI-α-Syn-like strain but neurons could not convert GCI-α-Syn to a LB-α-Syn like strain
(a) Schematic diagram for passaging α-Syn PFFs in KOM2 mice. (b) α-Syn pathology in PFF injected KOM2 mice (repeat 3 times). (c) Quantification of pS129 α-Syn in QBI-WT-Syn cells seeded by PFFs, passaged PFFs (PFF-KOM2-Syn) or PFFs combined with insoluble fraction from uninjected KOM2 mice (PFF+KOM2). (PFF-KOM2-Syn, n=6; PFF, n=3; PFF+KOM2, n=5 independent experiments) (d) Quantification of pS129 α-Syn in QBI-WT-Syn cells seeded by equal amount LB-α-Syn or LB-α-Syn passaged in KOM2 mice (LB-KOM2). (LB, n=3; LB-KOM2, n=7 independent experiments) (e) Schematic diagram for passaging PFFs in various cells. (f) Quantification of pS129 α-Syn in QBI-WT-Syn cells seeded by PFF passaged in cells. (PFF-Oligo-Syn, n=6; PFF-HipN-Syn and PFF-CtxN-Syn, n=4; PFF, n=3 independent experiments) (g) Schematic diagram for generating α-Syn PFFs in cell lysates. (h) Quantification of pS129 α-Syn in QBI-WT-Syn cells seeded by PFFs generated in oligodendrocyte lysate (Oligo-PFF), cortex and hippocampus neuron lysate (CtxN-PFF and HipN-PFF), or with α-Syn monomer alone (PFF) (Oligo-PFF, n=6; CtxN-PFF, n=4; HipN-PFF, n=4; PFF, n=4 independent experiments). (i) Schematic diagram for passaging GCI-α-Syn in primary neurons. (j) Quantification of pS129 α-Syn in QBI-WT-Syn cells seeded by α-Syn PFFs, GCI-α-Syn and GCI-α-Syn passaged in primary neurons (GCI, n=3; GCI-N-P1, n=5; GCI-N-P2, n=4; GCI-N-P3, n=4; PFF, n=3 independent experiments). (k) PK digested LB-α-Syn, GCI-α-Syn and GCI-N-P1 to P3 were immunoblotted with anti-α-Syn antibody (repeat 3 times). (l) Quantification of insoluble pS129 α-Syn in QBI-WT-Syn cells seeded by equal amount of GCI-α-Syn, LB-α-Syn or GCI-α-Syn and LB-α-Syn passaged in M83 mice (GCI, n=8; GCI-M-P1, n=6; LB, n=8 independent experiments). Results shown as mean ± SEM. Statistics shown in (c), (f), (h), (j) and (l) are one-way ANOVA followed by Dunnett post hoc test comparing each group with PFF-KOM2-Syn in (c), PFF-Oligo-Syn in (f), Oligo-PFF in (h), GCI 200pg in (j) and GCI in (l). Scale bars: 1 mm (b); 50 μm [(b) middle inset]; 15 μm [(b) right inset]. For gel source data, see Supplementary Figure 1. See Supplementary Table 5 for statistical details.

Comment in

References

    1. Lippa CF, et al. Lewy bodies contain altered alpha-synuclein in brains of many familial Alzheimer’s disease patients with mutations in presenilin and amyloid precursor protein genes. The American journal of pathology. 1998;153:1365–1370. - PMC - PubMed
    1. Spillantini MG, et al. Alpha-synuclein in Lewy bodies. Nature. 1997;388:839–840. doi: 10.1038/42166. - DOI - PubMed
    1. Tu PH, et al. Glial cytoplasmic inclusions in white matter oligodendrocytes of multiple system atrophy brains contain insoluble alpha-synuclein. Annals of neurology. 1998;44:415–422. doi: 10.1002/ana.410440324. - DOI - PubMed
    1. Bousset L, et al. Structural and functional characterization of two alpha-synuclein strains. Nature communications. 2013;4:2575. doi: 10.1038/ncomms3575. - DOI - PMC - PubMed
    1. Guo JL, et al. Distinct alpha-synuclein strains differentially promote tau inclusions in neurons. Cell. 2013;154:103–117. doi: 10.1016/j.cell.2013.05.057. - DOI - PMC - PubMed

Publication types

MeSH terms

Substances