. 2018 May;557(7705):375-380.
doi: 10.1038/s41586-018-0103-5. Epub 2018 May 9.

Diverse reprogramming codes for neuronal identity

Affiliations

Diverse reprogramming codes for neuronal identity

Rachel Tsunemoto et al. Nature. 2018 May.

Abstract

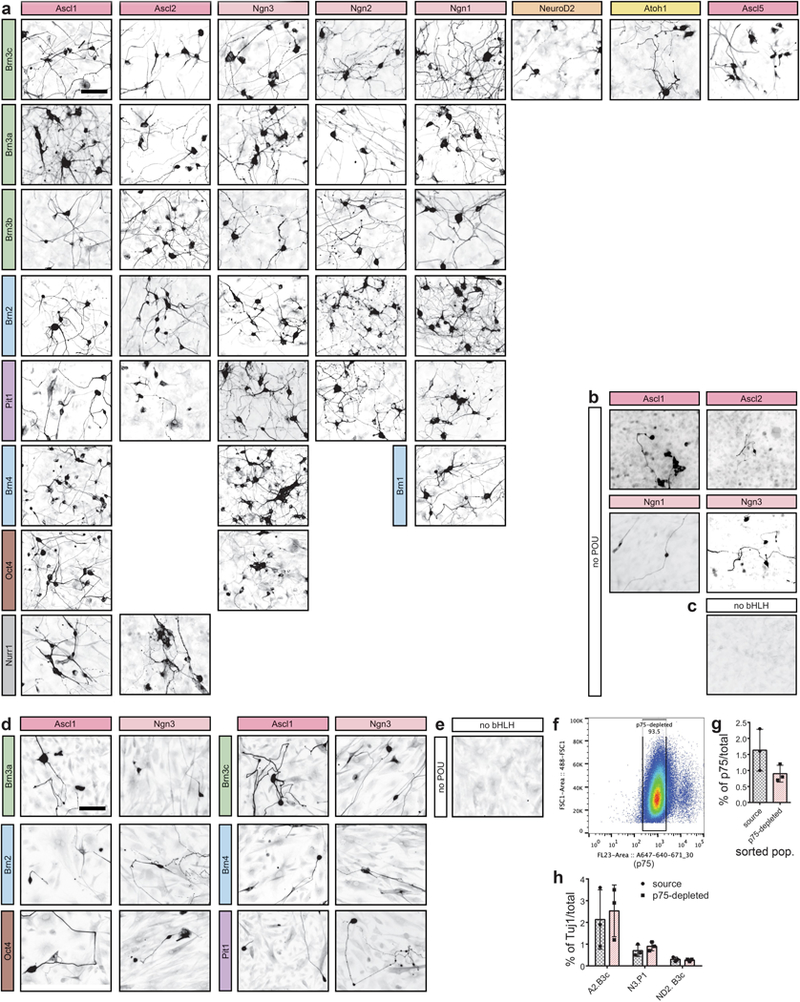
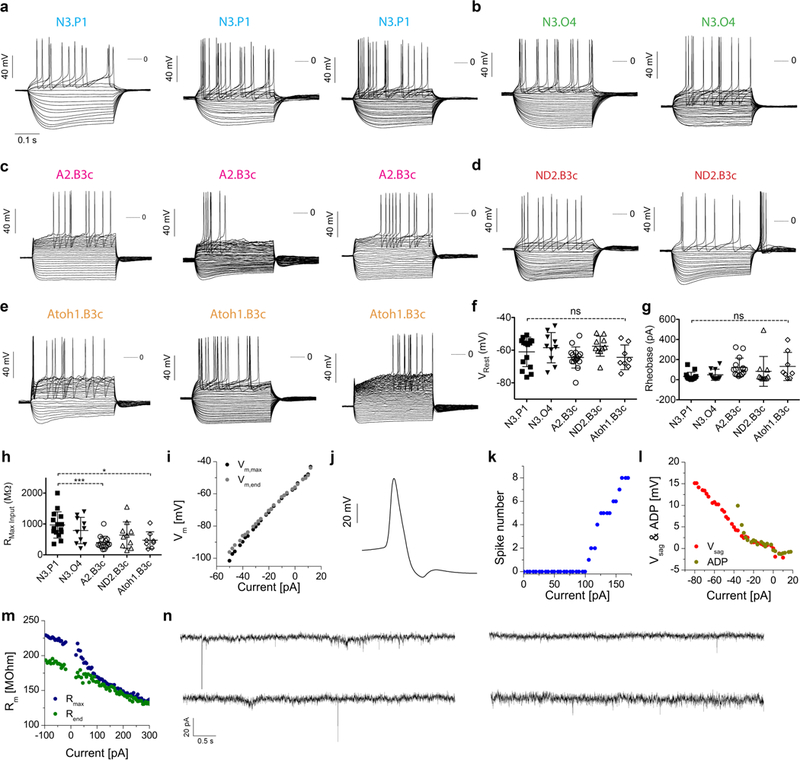
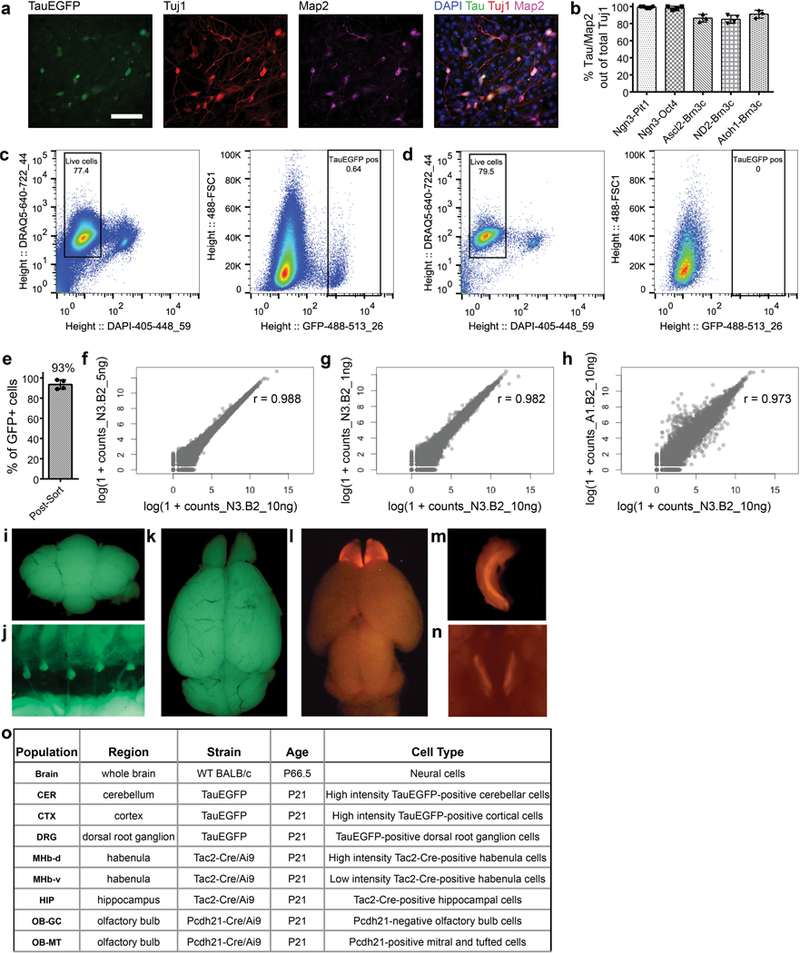
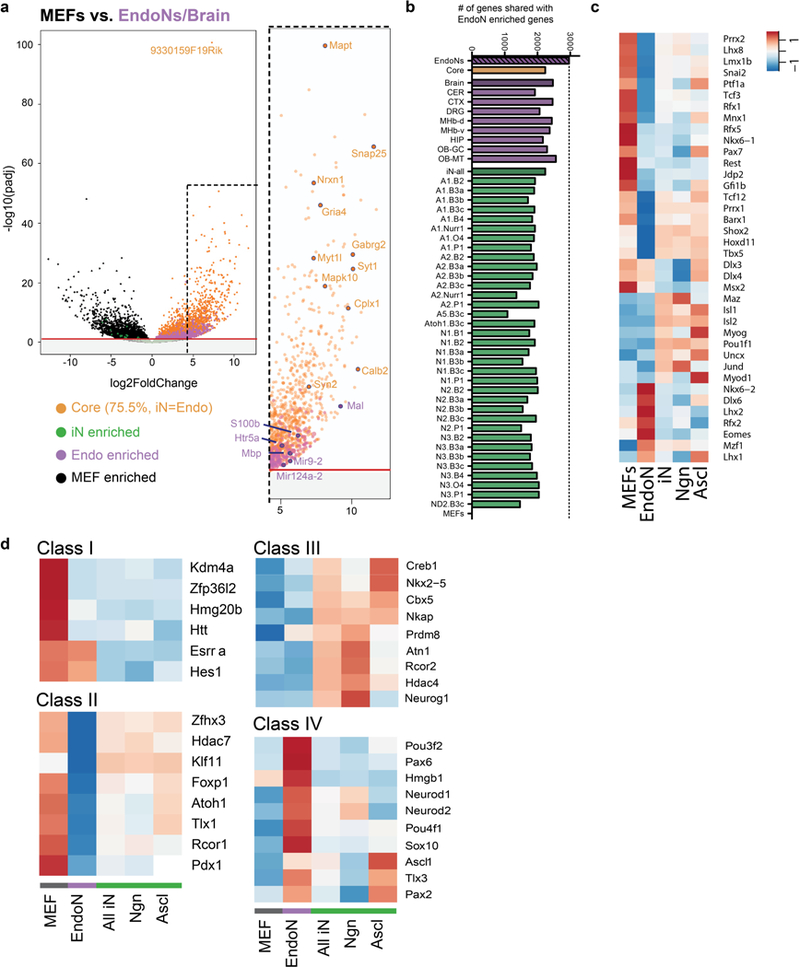
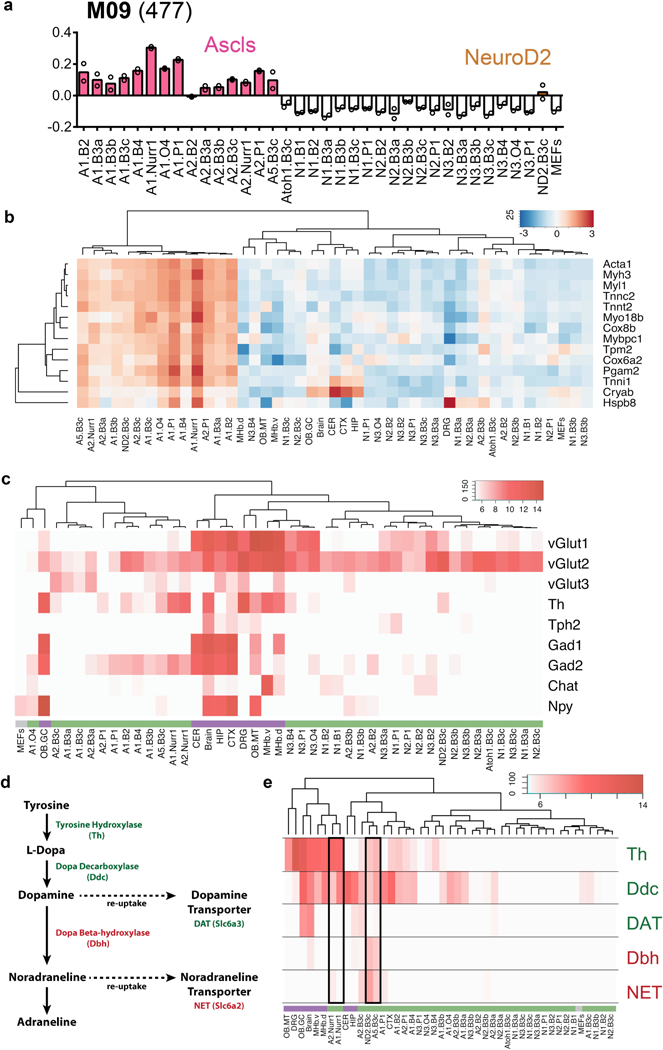
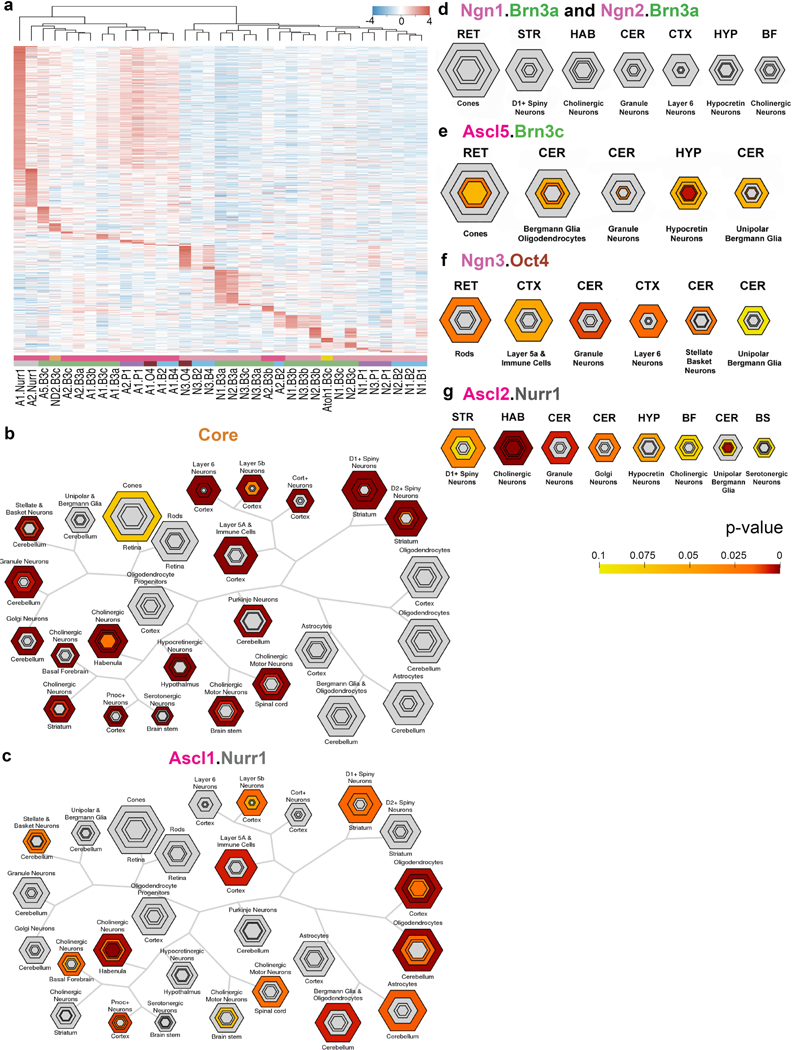
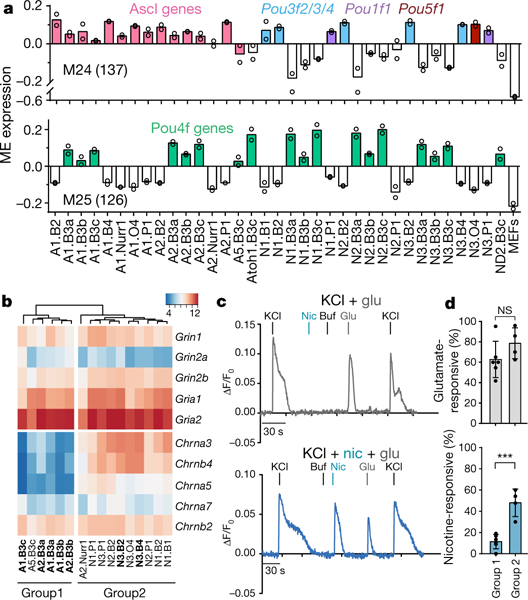
The transcriptional programs that establish neuronal identity evolved to produce the rich diversity of neuronal cell types that arise sequentially during development. Remarkably, transient expression of certain transcription factors can also endow non-neural cells with neuronal properties. The relationship between reprogramming factors and the transcriptional networks that produce neuronal identity and diversity remains largely unknown. Here, from a screen of 598 pairs of transcription factors, we identify 76 pairs of transcription factors that induce mouse fibroblasts to differentiate into cells with neuronal features. By comparing the transcriptomes of these induced neuronal cells (iN cells) with those of endogenous neurons, we define a 'core' cell-autonomous neuronal signature. The iN cells also exhibit diversity; each transcription factor pair produces iN cells with unique transcriptional patterns that can predict their pharmacological responses. By linking distinct transcription factor input 'codes' to defined transcriptional outputs, this study delineates cell-autonomous features of neuronal identity and diversity and expands the reprogramming toolbox to facilitate engineering of induced neurons with desired patterns of gene expression and related functional properties.


Figures

Extended Data Fig. 1 |
Extended Data Fig. 1 |. TUJ1 immunostaining of MEF- and TTF-derived iN cells and the p75-depletion experiment.
a, TUJ1 immunofluorescence labelling on day 14–16 post-induction of 35 of the 76 hits that were selected for whole-transcriptome analysis. n = 3 independent experiments. b, TUJ1 immunofluorescence labelling of conditions with individual bHLH factors Ascl1, Ascl2, Neurog1 and Neurog3. n = 3 independent experiments. c, TUJ1 immunofluorescence labelling of MEFs treated with only reverse tetracycline-controlled transactivator (rtTA), without reprogramming factors. n = 3 independent experiments. d, TUJ1 immunofluorescence labelling of TTFs derived from three-day-old mice and transduced with selected reprogramming combinations following the same reprogramming methods used with MEFs. Fixed and stained on day 16 post-induction. n = 1 independent experiment. e, TUJ1 immunofluorescence of TTFs treated with only rtTA, without reprogramming factors, and fixed and stained on day 16 post-induction. n = 1 independent experiment. f, Representative FACS gates of MEFs (~180,000 cells shown). MEFs were depleted of p75+ neural crest cells by first gating for DAPI cells (not shown) and collecting only those that were p75 (~93% of the DAPI population). g, Quantification of immunostaining for p75+ cells in source and p75-depleted MEF populations after expansion for four days after FACS, on the day of transduction for reprogramming. Data are mean ± s.d., n = 3 biologically independent samples. h, Percentage of TUJ1+ cells derived from source and p75-depleted MEF populations 16 days after induction. A2, Ascl2; N3, Neurog3; ND2, NeuroD2; B3c, Pou4f3; P1, Poulf1. Data are presented as the mean ± s.d., n = 3 biologically independent samples. Percentages of TUJ1+ cells were not significantly different between source and p75-depleted conditions (two-way ANOVA, Sidak’s multiple comparison test. A2.B3c, P = 0.895; N3.P1, P = 0.985; ND2.B3c, P > 0.999). Scale bars, 100 μm.
Extended Data Fig. 2 |
Extended Data Fig. 2 |. Additional electrophysiological recordings of iN cells from five transcription factor combinations.
ae, Example voltage responses of representative iN cells from five transcription factor combinations: Neurog3/Pou1f1 (a; n = 3 cells), Neurog3/Pou5f1 (b; n = 2 cells), Ascl2/Pou4f3 (c; n = 3 cells), Neurod2/Pou4f3 (d; n = 2 cells) and Atoh1/Pou4f3 (e; n = 3 cells). Cells were stimulated using incremental levels of intracellular current starting at –100 to –50 pA and reaching levels where intense firing of action potentials was observed. fg, Quantification of resting membrane potential (f), rheobase (g) and membrane input resistance (h) for cells that exhibited current-induced action potentials. Neurog3/Pou1f1 (N3.P1, n = 15 cells), Neurog3/Pou5f1 (N3.O4; n = 10 cells), Ascl2/Pou4f3 (A2.B3c; n = 15 cells), Neurod2/Pou4f3 (ND2.B3c; n = 10 cells) and Atoh1/Pou4f3 (Atoh1.B3c; n = 8 cells). Data are mean ± s.d.; ***P = 0.0006, *P = 0.0228; ns, not significant. One-way ANOVA, Tukey’s multiple comparison test. im, Physiological properties of the cells. i, Current–voltage relationship obtained by plotting the observed membrane potential as a function of the injected current of both maximal voltage deflections (black) and the membrane potential at the end of the current step (grey). Data from the third Neurog3/Pou1f1 cell in a. j, Selected action potential of the second Neurog3/Pou5f1 cell in b. The dual spike after-hyperpolarization is indicative of Ca-dependent K+ currents in this neuron. k, Input–output curve of the number of spikes as a function of the injected current. This cell starts firing at + 100 pA (rheobase). l, Plot of the voltage sag (red) and after depolarization (dark yellow) as a function of the current. The Neurod2/Pou4f3 cells in d exhibit characteristic voltage sags under negative currents. The second Neurod2/Pou4f3 cell also produces post-inhibitory rebound spikes. m, Plot of membrane resistance versus current. Blue symbols are resistance values calculated from maximal voltage deflections and green symbols were obtained from voltage levels just before the termination of the current step of the third Atoh1/Pou4f3 cell in e. The decrease of membrane resistance as a function of current indicates the action of potent outward-rectifying K+ currents. n, Representative current traces from four cells showing EPSCs from tau–eGFP+, synapsin+ cells generated with Neurog3/Pou5f1 and Neurod2/Pou4f3.
Extended Data Fig. 3 |
Extended Data Fig. 3 |. Transcription factor pairs generate functional human iN cells from HEFs.
a, Representative TUJ1 immunofluorescence labelling of human iN cells reprogrammed from HEFs using mouse Neurog3/Pou1f1 or human NEUROG3/POU1F1. Scale bar, 100 μm. b, Quantification of TUJ1+ DAPI+ cells for mouse and human iN cells derived from mouse (m) or human (h) Neurog3 and Pou1f1 or rtTA only. Data from n = 2 biologically independent samples. c, Representative images of human iN cells reprogrammed from HEFs using pairs of mouse transcription factors. TUJ1 and MAP2 immunofluorescence labelling of 15 of the 76 positive pairwise combinations derived from the unbiased mouse screen. Fixed and stained on day 16–18 post-induction. Scale bar, 100 μm. Repeated with n = 2 independent experiments. d, Representative images of human iN cells reprogrammed from HEFs in an independent experiment from c. TUJ1 and MAP2 immunofluorescence labelling of four pairwise mouse transcription factor combinations. Fixed and stained on day 18 post-induction. Scale bar, 100 μm. e, Percentage fraction of MAP2+TUJ1+ cells from the four transcription factor combinations represented in d. Imaging from n = 2 biologically independent samples, 100 fields of view each. Number of TUJ1+ cells is as follows: Neurog1/Pou4f1 (n = 166 cells); Neurog3/Pou3f4 (n = 343 cells); Neurog3/Pou1f1 (n = 235 cells); Neurog3/Pou5f1 (n = 146 cells). Data are mean ± s.d. f, Representative synapsin (SYN1) and TUJ1 immunofluorescence labelling of human iN cells reprogrammed with Neurog3/Pou1f1 (91.5% positive for both). Scale bar, 100 μm. Repeated with n = 3 biologically independent samples. gj, Electrophysiological recordings were performed on human iN cells generated with mouse Neurog3/Pou1f1 between 26 and 31 days postinduction. g, Representative voltage responses from a Syn1–TdTomato+ cell with neuronal morphology; 21 of 27 fluorescent cells tested (77%) generated action potentials upon current injection. h, Representative whole-cell currents evoked by hyperpolarizing and depolarizing voltage steps delivered from a holding potential of –65 mV i, Passive membrane properties of human iN cells. Quantification of resting membrane potential (left), capacitance (middle) and membrane resistance (right) is shown as mean ± s.d. (n = 15 cells). j, Steady-state currents versus voltage in individual cells reflect the expression of depolarization-induced voltage-gated outward currents (n = 9 cells).
Extended Data Fig. 4 |
Extended Data Fig. 4 |. FACS, RNA-seq library preparation and characterization of iN cell and endogenous neuron populations
.a, Representative immunofluorescence labelling of tau–EGFP+ iN cell population (Ascl2/Pou4f2) on day 12 post-induction using neuronal antibodies TUJ1 and MAP2. Scale bars, 100 μm. Pou4f2 is also known as Brn3b. b, Quantification of co-labelling of tau–eGFP and MAP2 in Tuj1+ cells on day 12 post-induction calculated from various reprogramming transcription factor pairs. Data are presented as mean ± s.d. from n = 4 independent experiments and n = 574 cells. c, d, Representative FACS gates of an Ascl2/Pou4f2 iN cell population (500,000 cells shown) (c) and a negative rtTA-only control (40,000 cells shown) (d) sorted on day 16 post-induction. Live tau–eGFP+ cells were enriched by first gating DRAQ5+ DAPI cells, then collecting only those that were GFP+. For Ascl2/Pou4f2, n = 2 independent experiments showed similar results, while for rtTA only, n = 40 independent experiments showed similar results. For all other iN cell populations, at least n = 2 independent experiments were performed to obtain biological replicates. e, Per cent of tau–eGFP+ cells out of total number of cells collected post-FACS, presented as mean ± s.d. (n = 4 sorts, > 100 cells per sort). f, g, Correlation plots between aligned counts from single sequenced libraries of a Neurog3/Pou3f2-iN cell population generated from 10 ng versus 5 ng input RNA (f) and 10 ng versus 1 ng input RNA (g). Pou3f2 is also known as Brn2. r, Pearson correlation coefficient. h, Correlation plots between aligned counts from single sequenced libraries of a Neurog3/Pou3f2 (10 ng input RNA) population and an Ascl1/Pou3f2 (10 ng input RNA) population. in, Representative images taken while dissecting tissue from various brain regions of appropriate mouse reporter strains used to isolate specific endogenous cell-type populations used for RNA-seq: cerebellum (CER) (i), DRG (j), cortex (CTX) (k), olfactory bulb mitral and tufted cells (OB-MT) and olfactory bulb granule cells (OB-GC) (l), hippocampus (HIP) (m), and dorsal-medial habenula (MHb-d) and ventral-medial habenula (MHb-v) (n). n = 2 independent RNA-seq experiments. o, Characteristics of the endogenous neuron populations used for RNA-seq.
Extended Data Fig. 5 |
Extended Data Fig. 5 |. Upstream regulator analysis for core neuronal genes.
a, Complete volcano plot of log2(fold change) versus –log(adjusted P value per gene) for MEFs (black) versus the pooled endogenous neuron and brain (endogenous neuron/brain) RNA-seq data. Genes enriched in MEFs and endogenous neuron/brain are plotted as negative and positive log2(fold change), respectively. Plotted are enriched core genes shared between iN cells and endogenous neuron/brain (orange, 75.5% of the significantly enriched endogenous neuron/brain genes), genes enriched in endogenous neuron/brain (purple, endo enriched), and genes enriched in iN cells (green, iN cell enriched). Red line, –log(0.05 P-adjusted value). Selected neural genes are labelled. b, Number of shared enriched genes between endogenous neurons and MEFs, individual endogenous neurons (purple) or iN cell (green) populations. Core genes (orange) are those shared collectively among iN cells and endogenous neurons. c, Heat map of expression of significant transcriptional regulators identified by HOMER only. Expression levels are defined as DESeq2 vsd-normalized RNA-seq counts with replicates averaged and scaled by row. d, Heat map of expression of significant class I–IV transcriptional regulators identified by IPA only. Class I, putative uniform neuronal repressor; Class II, putative non-uniform neuronal repressor; Class III, putative neuronal activator in iN cells; Class IV, putative neuronal activator in endogenous neurons. Expression levels are defined as DESeq2 vsd-normalized RNA-seq counts with groups averaged and scaled by row.
Extended Data Fig. 6 |
Extended Data Fig. 6 |. scRNA-seq analysis of iN cell populations.
a, t-SNE projection of single cells collected from four iN cell populations, Neurog3/Pou5f1 (N3.O4, n = 415 cells), Neurog3/Pou3f4 (N3.B4, n = 313 cells), Neurog1/Pou4f1 (N 1.B3a, n = 134 cells) and Ascl2/Nr4a2 (A2. NR1, n = 90 cells), coloured by log of UMI counts per cell. Arrows point to subpopulations of cells with low UMI, which includes a cluster composed of cells from each iN cell population. b, t-SNE projection of the same single cells shown in a, coloured by the log of UMI counts for the myogenic genes Acta1, Tnnc2 and Myl1. Inset areas are magnified to highlight the small fraction of cells positive for the myogenic genes (3 out of 90, threshold set at log(UMI counts) > 1) in the Ascl2/Nr4a2 (A2. NR1) population. The three myogenic genes plotted were those identified previously that were not highly expressed in any of our endogenous neuron populations. c, t-SNE projection of single cells collected from MEFs and five iN cell populations: Neurog3/Pou5f1 (N3.O4), Neurog3/Pou3f4 (N3.B4), Neurog1/Pou4f1 (N1.B3a), Ascl2/Nr4a2 (A1.NR1) and Neurog3/Pou1f1 (N3.P1). Cells are coloured by the log of UMI counts for genes Col1a2 and Lox, which represent MEF genes (10 out of 15 genes) that are highly expressed in the majority of the MEF population and in a small fraction of cells in the iN cell populations. Fifteen MEF genes were selected, based on the top genes enriched in MEFs compared to endogenous neuron/brain according to population RNA-seq that were not also expressed in endogenous neuronal single cells (data not shown). d, t-SNE projection of the same single cells as shown in c, coloured by the log of UMI counts for the genes Postn and Mmp2, which represent MEF genes (5 out of 15 genes) that are highly expressed in the majority of the MEF population and in a large fraction of cells in the iN cell populations. e,t-SNE projections of single cells coloured by log of UMI counts per cell for each of the individual iN cell populations sequenced: Neurog3/Pou3f4 (N3.B4), Neurog3/Pou5f1 (N3.O4), Neurog1/Pou4f1 (N1.B3a) and Ascl2/Nr4a2 (A1.NR1). The number of cells for each transcription factor combination is the same as in a. f, Expression of receptors and transmembrane proteins among the top 20 differentially expressed genes in each transcription factor pair relative to all other combinations, plotted as a simplified violin plot. One representative gene shown for each transcription factor pair.
Extended Data Fig. 7 |
Extended Data Fig. 7 |. Diversity across iN cell populations.
a, WGCNA module eigengene expression of the 35 iN cell populations (in duplicate) shown as bar plots of average module eigengene expression for module 09 (M09, n = 477 genes) correlated with bHLH subclasses. Colours highlight iN cells populations generated with the Ascl family of bHLH factors or an iN cell combination generated with the bHLH factor, Neurod2. b, Heat map of expression of myogenic genes reflects higher levels of expression in iN cell populations derived with the Ascl family of reprogramming factors compared to the Neurog family. The myogenic gene list is as described. Expression levels are defined as DESeq2 vsd-normalized RNA-seq counts with replicates averaged and scaled by row. The dendrogram represents hierarchical clustering based on correlation distance. c, Heat map of expression of select neurotransmitter-associated genes. Expression levels in iN cell (green), endogenous neuron/brain (purple) and MEF populations (grey) are defined as DESeq2 vsd-normalized RNA-seq counts with replicates averaged. Dendrogram represents hierarchical clustering based on correlation distance. d, Schematic of dopamine and noradrenaline biosynthesis pathway. e, Heat map of expression of genes involved in dopamine and noradrenaline biosynthesis and re-uptake across all iN cell (green), endogenous neurons (purple) and MEF (grey) populations. Expression patterns for populations generated with Ascl1/Nr4a2, Ascl2/Nr4a2, Ascl5/Pou4f3 and Neurod2/Pou4f3 are outlined with a black frame. Expression levels are defined as DESeq2 vsd-normalized RNA-seq counts with replicates averaged. Dendrogram represents hierarchical clustering based on correlation distance.
Extended Data Fig. 8 |
Extended Data Fig. 8 |. Diverse glutamate and nicotine responses of iN cell populations.
a, Heat map of expression of glutamate and nicotinic acetylcholine receptor subunit genes across all iN cell populations. Expression levels are defined as DESeq2 vsd-normalized RNA-seq counts with replicates averaged. Dendrogram represents hierarchical clustering based on correlation distance. b, Percentages of glutamate- and nicotine- responsive cells out of total KCl-responsive cells in each individual iN cell population (n = 218 total cells). Group 1 (n = 6 independent experiments) and group 2 (n = 4) comprise iN cell populations with the lowest and highest overall expression of nicotinic acetylcholine receptors, respectively. ***P = 0.0004; ns, not significant (unpaired Student’s t-test). Data are mean ± s.d.
Extended Data Fig. 9 |
Extended Data Fig. 9 |. Comparison of iN cell and endogenous neuron populations.
a, Heat map of expression of uniquely enriched genes in individual iN cell populations as defined by genes significantly enriched (P-adjusted value < 0.05) in each iN cell population versus all other iN cell populations and MEFs determined by DESeq2. Expression levels are defined as DESeq2 vsd-normalized RNA-seq counts with replicates averaged and scaled by row. Dendrogram represents hierarchical clustering based on Euclidean distance. b–g, Overlap of gene lists with a particular cell type or region for which data are currently available were identified by Fisher’s exact test (two-sided) with Benjamini–Hochberg correction using CSEA. Concentric, hexagonal plots represent each cell type or region. The sizes of the hexagons are scaled to the number of specifically enriched transcripts at set stringency thresholds with the innermost hexagon representing the most unique genes. Hexagons are colour coded by the P values of the Fisher’s exact test. RET, retina; HYP, hypothalamus; STR, striatum; HAB, habenula; BF, basal forebrain; BS, brainstem. b–d, CSEA of the core genes (enriched genes shared between iN cell and endogenous neuron/brain populations, n = 2,239 genes) (b) and uniquely enriched genes of iN cell populations Ascl1/Nr4a2 (A1. Nurr1, n = 282 genes) (c) and Neurog1/Pou4f1 and Neurog2/Pou4f1 (N1/N2.B3a, combined n = 93 genes total) (d). Uniquely enriched genes were defined in the same manner as in a. e–g, Modified CSEA visualization of uniquely enriched genes of individual iN cell populations: Ascl5/Pou4f3 (A5.B3c, n = 46 genes) (e), Neurog3/Pou5f1 (N3.O4, n = 51 genes) (f) and Ascl2/Nr4a2 (A2.NR1, n = 101 genes) (g). Uniquely enriched genes were defined in the same manner as in a.
Extended Data Fig. 10 |
Extended Data Fig. 10 |. Comparison of single-cell iN cell and endogenous neuron populations.
a, Pearson correlation values between individual single cells and bulk DRG plotted as kernel density distributions for each transcription factor pair, and colour-coded accordingly. To generate Pearson correlation values between endogenous populations and single cells, unique genes for each endogenous population (n = 1 population in duplicate biological samples) were defined using DESeq2 as the top 100 significant genes that were ranked by highest fold change when compared to all other endogenous populations (n = 5 in duplicate, n = 2 in triplicate biological samples). The expression level of these unique genes in their respective endogenous population was correlated with each single-cell for genes that were found in filtered gene-barcode matrices. Pearson correlation values were plotted as kernel density estimations to represent the distribution of single cells for each iN cell population: Neurog1/Pou4f1 (N1.B3a, n = 134 cells, green), Neurog3/Pou5f1 (N3. O4, n = 415 cells, pink), Neurog3/Pou3f4 (N3.B4, n = 313 cells, blue) and Ascl2/Nr4a2 (A2.NR1, 90 cells, orange). b, t-SNE projections of 952 single cells coloured by their correlation with bulk DRG. The Neurog1/Pou4f1 pair exhibits enrichment of highly correlated cells. c, Pearson correlation values between individual single cells (n = 952 cells) and bulk HIP plotted as kernel density distributions for each combination and colour coded accordingly. d, t-SNE projections of 952 single cells coloured by their correlation with bulk HIP. The Ascl2/Nr4a2 pair exhibits enrichment of highly correlated cells. e–g, Pearson correlation values between individual single cells and bulk CTX (e), MHb-v (f) and CER (g) plotted as kernel density distributions for each combination, and colour-coded accordingly.
Fig. 1 |
Fig. 1 |. Screening transcription factor pairs for iN cell induction.
a, Reprogramming schematic. Candidate iN cells were identified by expression of neuronal markers and neuronal morphologies. Red, TUJ1; green, tau–eGFP; blue, DAPI. b, Positive (76) and negative (522) transcription factor pairs identified in the screen. All tested POU and nuclear receptor factors are included but the 30 bHLH factors that did not produce iN cells are omitted for clarity. Each box contains the normalized average percentage of TUJ1+ cells per well (n = 3 wells, 2 × 10⁴ fibroblasts per well). c, MEFs were transfected with vectors encoding Neurog3/Pou1f1 to generate iN cells. Immunofluorescence showing co-labelling of TUJ1+ (red) candidate iN cells with tau–eGFP (green), MAP2 (green) and synapsin (green) with nuclei in blue (DAPI) from n = 5, 5 and 3 independent experiments, left to right, respectively. Scale bars, 100 μm. d, Percentage of TUJ1+ cells that co-express tau–eGFP (n = 574), MAP2 (n = 574) or synapsin (n = 293) for iN cells induced by Neurog3/Pou1f1 (N3.P1, n = 5, 5 and 3 independent experiments, respectively), Neurog3/Pou5f1 (N3.O4, n = 4, 4 and 3 independent experiments, respectively), Ascl2/Pou4f3 (A2.B3c, n = 3, 3 and 3 independent experiments, respectively), Neurod2/Pou4f3 (ND2.B3c, n = 4, 4 and 3 independent experiments, respectively) and Atoh1/Pou4f3 (Atoh1.B3c, n = 3, 3 and 3 independent experiments, respectively). Pou4f3 is also known as Brn3c. Data are mean ± s.d.
Fig. 2 |
Fig. 2 |. Electrophysiological properties of iN cells.
a, Representative whole-cell patch-clamped candidate iN cell expressing synapsin–TdTomato (red). TdTomato intensity was adjusted to show neurites and soma. Scale bar, 25 μm. b, Membrane voltage responses from an iN cell generated with Ascl2/Pou4f3 under whole-cell patch-clamp conditions at maximum current injection (top) and current steps until the first induction of action potentials (middle), with current traces (bottom). c, iN cells generated with five transcription factor pairs exhibit current-induced action potentials in the majority of cells: Neurog3/Pou1f1 (N3. P1, 15 of 15 cells), Neurog3/Pou5f1 (N3.O4; 10 of 10 cells), Ascl2/Pou4f3 (A2.B3c; 15 of 16 cells), Neurod2/Pou4f3 (ND2.B3c; 10 of 10 cells) and Atoh1/Pou4f3 (Atoh1.B3c; 8 of 9 cells). AP, action potential. d, Current trace showing EPSCs from an iN cell generated with Neurog3/Pou5f1. e, Membrane voltage responses to depolarizing current steps of iN cells with neuronal morphology generated from Neurog3/Pou5f1 (N3.O4, top) and Neurod2/Pou4f3 (ND2.B3c, bottom). f, Quantification of voltage sag (Vsag) behaviour for candidate iN cells that exhibited current-induced action potentials: N3.P1 (n = 15 cells), N3.O4 (n = 10), A2.B3c (n = 15), ND2.B3c (n = 10) and Atoh1.B3c (n = 8). Voltage sag is plotted as the slope of the voltage sag versus current. Coloured points correspond to the plotted cells. Data are mean ± s.d., *P = 0.0207, one-way ANOVA, Tukey’s multiple comparison test.
Fig. 3 |
Fig. 3 |. RNA-seq of iN cell populations.
a, RNA-seq schematic for MEFs, induced neurons (iN cells), endogenous neurons (EndoNs) and whole brain samples. b, PCA from MEF (n = 1 population in duplicate biological samples, grey), iN cell (n = 35 in duplicate; green), endogenous neuron (n = 6 in duplicate, n = 2 in triplicate; purple) and brain (n = 1 in duplicate; dark purple) RNA-seq data. Loadings for principal components PC1, PC2 and PC3 are reported on x, y and z axes, respectively. Larger spheres represent centroids of each set of samples. Right, candidate iN cell populations (green), MEFs (grey), endogenous neurons (purple) and brain samples (dark purple) plotted along a vertical axis (loadings) for the first three principal components. c, Enriched GO terms for the differentially expressed genes based on DESeq2 comparisons of the MEFs compared to the iN cells plotted at fold enrichment with the associated P value at the end of each bar. Pos., position; reg., regulation. d, Abbreviated volcano plot of log2(fold change) versus –log(adjusted P value per gene) for MEFs (black) versus the pooled endogenous neuron and brain RNAseq data. Plotted are enriched core genes that are shared between iN cell and endogenous neurons and brain populations (orange, 75.5% of the significantly enriched endogenous neurons and brain genes), genes enriched in endogenous neurons and brain (purple, endo-enriched) and genes enriched in iN cells (green, iN cell-enriched). The red line represents–log(0.05 P-adjusted value) (See Extended Data Fig. 5a). e, Schematic of predicted transcriptional repressors (R) and activators (A) that silence and activate neuronal genes in MEFs and neuronal populations, respectively. TSS, transcription start site. f, Expression of representative predicted transcriptional core gene regulators from each class identified by both HOMER and IPA plotted as DESeq2 vsd-normalized RNA-seq counts with groups averaged and scaled by row.
Fig. 4 |
Fig. 4 |. Single-cell RNA-seq of four iN cell populations.
a-c, Cells are colour-coded as Neurog1/Pou4f1 (N1.B3a, green, n = 134 cells), Neurog3/ Pou5f1 (N3.O4, pink, n = 415), Neurog3/Pou3f4 (N3.B4, blue, n = 313) and Ascl2/Nr4a2 (A2.NR1, orange, n = 90). a, t-SNE projection of 952 single cells derived from the four pairwise combinations of transcription factors. Black arrows indicate clusters of cells with low total UMI counts (Extended Data Fig. 5a). b, Single-cell log2 UMI expression of pan-neuronal (Mapt, Tubb3) and mature neuron (Map2, Snap25) markers. The rectangle of the box plot spans the interquartile range, the dividing segment denotes the median. The whiskers above and below the box represent the minimum and maximum. c, Single-cell log2 UMI expression of receptors and transmembrane proteins among the top 20 differentially expressed genes with each transcription factor combination relative to all other combinations (see Extended Data Fig. 5f). Pou3f4 is also known as Brn4.
Fig. 5 |
Fig. 5 |. Transcriptional and functional diversity of iN cell populations.
a, Average WGCNA module eigengene (ME) expression of the 35 iN cell populations (in duplicate) for representative modules correlated with POU subclasses (module 24 (M24), 137 genes assigned) and nonlinear or synergistic modules (module 25 (M25), 126 genes). Colours highlight populations generated with shared transcription factors. b, Expression of selected glutamate and nicotinic acetylcholine receptor subunit genes in iN cell populations, grouped using hierarchical clustering based on correlation distance. Expression is shown as the mean of two DESeq2 vsd-normalized RNA-seq counts. Bolded iN cell populations were used in calcium imaging experiments (Extended Data Fig. 8b). c, Calcium responses of two representative cells (group 1, top, grey; group 2, bottom, blue) to 100–250 mM KCl and 1 mM glutamate (glu), 100 μM nicotine (nic) and buffer alone (buf) plotted as ΔF/F0 versus time. d, Percentages of glutamate- and nicotine-responsive cells per group out of total KCl-responsive cells (n = 218 total cells). Group 1 and group 2 (n = 6 and 4 independendent experiments, respectively) comprise iN cell populations with the lowest and highest overall expression of nicotinic acetylcholine receptors, respectively. ***P = 0.0004, NS, not significant; unpaired Student’s t-test. Data are mean ± s.d.

Comment in

References

    1. Davis RL., Weintraub H. & Lassar AB. Expression of a single transfected cDNA converts fibroblasts to myoblasts. Cell 51, 987–1000 (1987). - PubMed
    1. Takahashi K. & Yamanaka S. Induction of pluripotent stem cells from mouse embryonic and adult fibroblast cultures by defined factors. Cell 126, 663–676 (2006). - PubMed
    1. Vierbuchen T. et al. Direct conversion of fibroblasts to functional neurons by defined factors. Nature 463, 1035–1041 (2010). - PMC - PubMed
    1. Caiazzo M. et al. Direct generation of functional dopaminergic neurons from mouse and human fibroblasts. Nature 476, 224–227 (2011). - PubMed
    1. Chanda S., Marro S., Wernig M. & Sudhof TC. Neurons generated by direct conversion of fibroblasts reproduce synaptic phenotype caused by autism-associated neuroligin-3 mutation. Proc. Natl Acad. Sci. USA 110, 16622–16627 (2013). - PMC - PubMed

Publication types

Substances