

Alpha Power Modulates Perception Independently of Endogenous Factors
- PMID: 29743869
- PMCID: PMC5930164
- DOI: 10.3389/fnins.2018.00279
Alpha Power Modulates Perception Independently of Endogenous Factors
Abstract
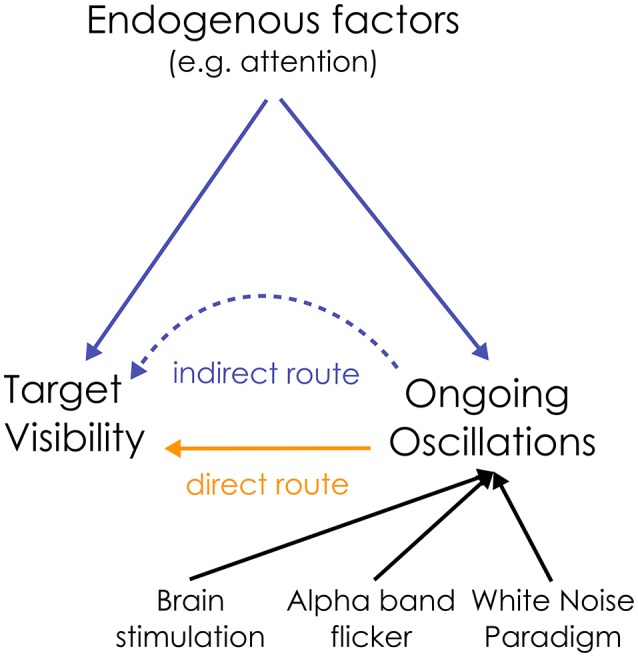
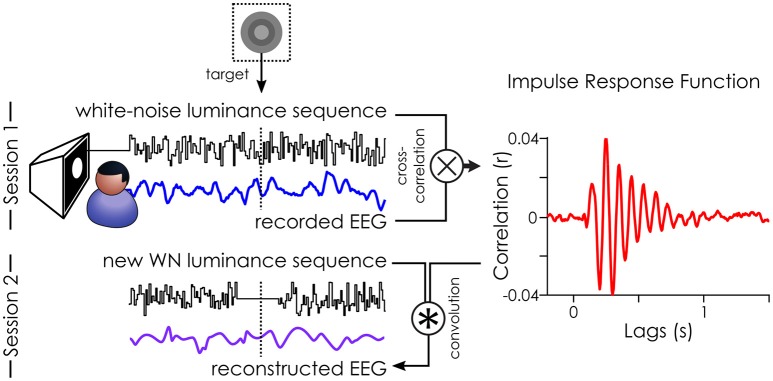
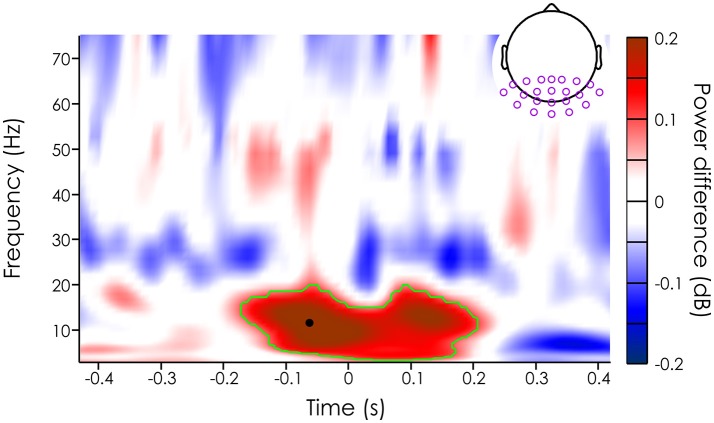
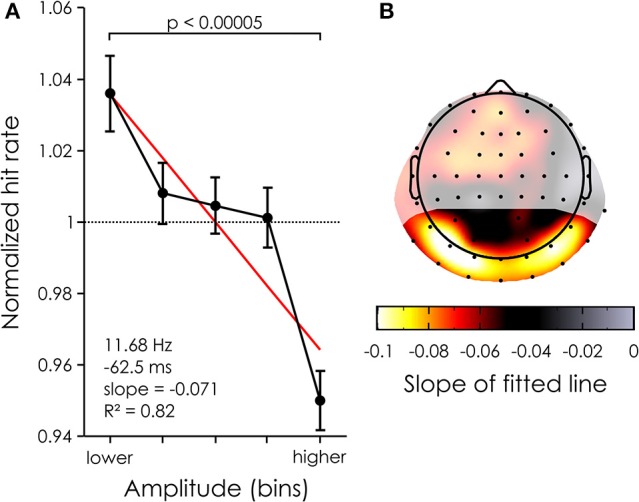
Oscillations are ubiquitous in the brain. Alpha oscillations in particular have been proposed to play an important role in sensory perception. Past studies have shown that the power of ongoing EEG oscillations in the alpha band is negatively correlated with visual outcome. Moreover, it also co-varies with other endogenous factors such as attention, vigilance, or alertness. In turn, these endogenous factors influence visual perception. Therefore, it remains unclear how much of the relation between alpha and perception is indirectly mediated by such endogenous factors, and how much reflects a direct causal influence of alpha rhythms on sensory neural processing. We propose to disentangle the direct from the indirect causal routes by introducing modulations of alpha power, independently of any fluctuations in endogenous factors. To this end, we use white-noise sequences to constrain the brain activity of 20 participants. The cross-correlation between the white-noise sequences and the concurrently recorded EEG reveals the impulse response function (IRF), a model of the systematic relationship between stimulation and brain response. These IRFs are then used to reconstruct rather than record the brain activity linked with new random sequences (by convolution). Interestingly, this reconstructed EEG only contains information about oscillations directly linked to the white-noise stimulation; fluctuations in attention and other endogenous factors may still modulate brain alpha rhythms during the task, but our reconstructed EEG is immune to these factors. We found that the detection of near-perceptual threshold targets embedded within these new white-noise sequences depended on the power of the ~10 Hz reconstructed EEG over parieto-occipital channels. Around the time of presentation, higher power led to poorer performance. Thus, fluctuations in alpha power, induced here by random luminance sequences, can directly influence perception: the relation between alpha power and perception is not a mere consequence of fluctuations in endogenous factors.
Keywords: EEG; IRF; alpha oscillations; power; visual perception.
Figures
References
-
- Carrasco M. (2014). Spatial covert attention: perceptual modulation, in The Oxford Handbook of Attention, eds Nobre A. C., Kastner S. (Oxford, UK: Oxford University Press; ), 183–230.
LinkOut - more resources
Full Text Sources
Other Literature Sources
Miscellaneous