

Arrhythmic hazard map for a 3D whole-ventricle model under multiple ion channel block
- PMID: 29745425
- PMCID: PMC6086978
- DOI: 10.1111/bph.14357
Arrhythmic hazard map for a 3D whole-ventricle model under multiple ion channel block
Abstract
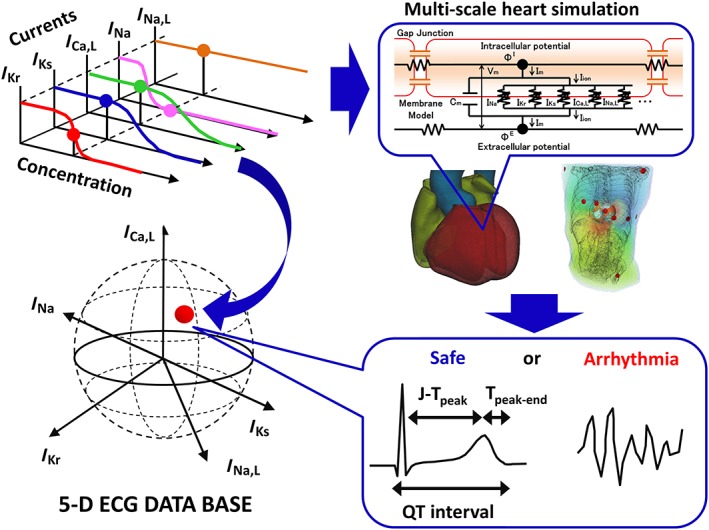
Background and purpose: To date, proposed in silico models for preclinical cardiac safety testing are limited in their predictability and usability. We previously reported a multi-scale heart simulation that accurately predicts arrhythmogenic risk for benchmark drugs.
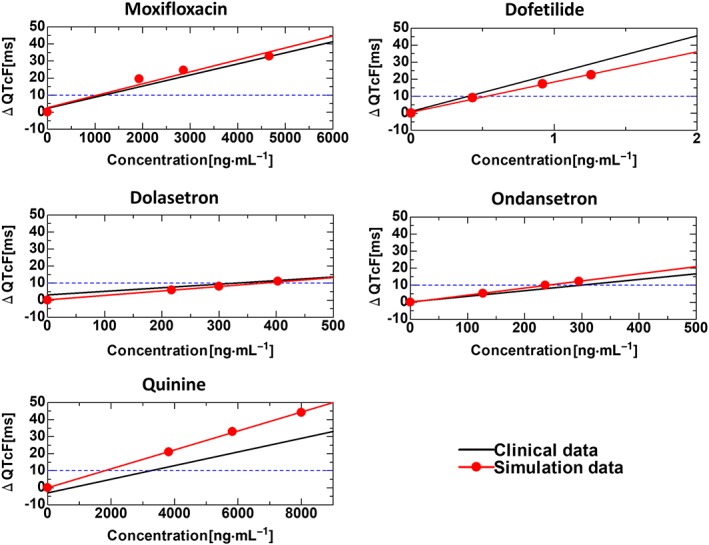
Experimental approach: We created a comprehensive hazard map of drug-induced arrhythmia based on the electrocardiogram (ECG) waveforms simulated under wide range of drug effects using the multi-scale heart simulator described here, implemented with cell models of human cardiac electrophysiology.
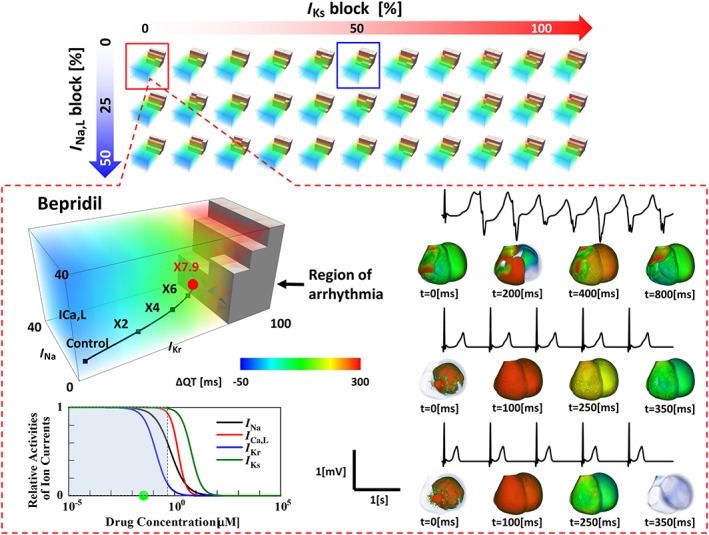
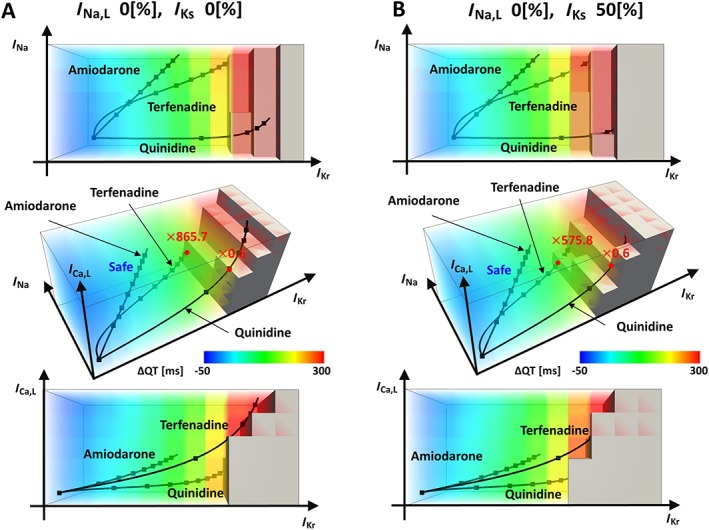
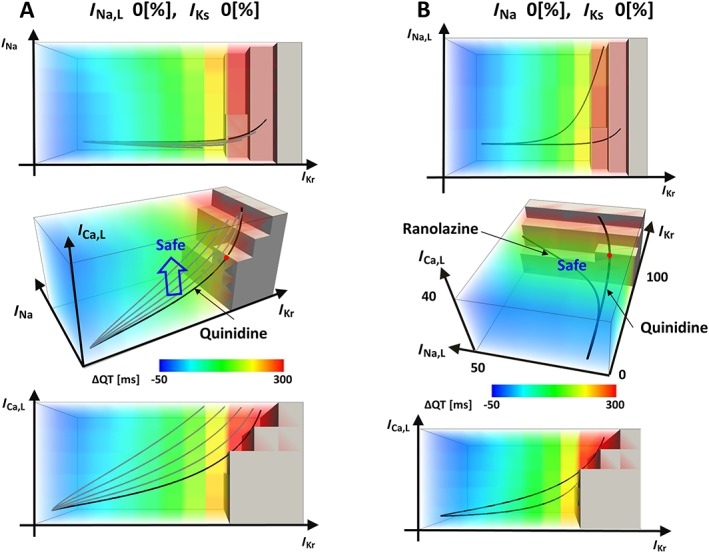
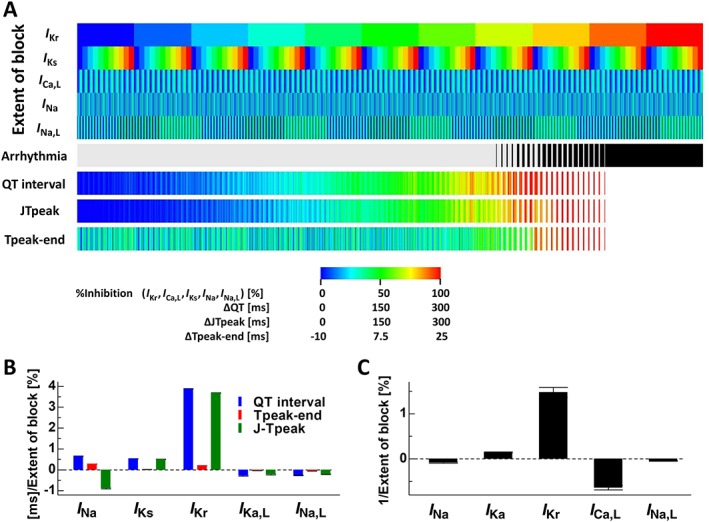
Key results: A total of 9075 electrocardiograms constitute the five-dimensional hazard map, with coordinates representing the extent of the block of each of the five ionic currents (rapid delayed rectifier potassium current (IKr ), fast (INa ) and late (INa,L ) components of the sodium current, L-type calcium current (ICa,L ) and slow delayed rectifier current (IKs )), involved in arrhythmogenesis. Results of the evaluation of arrhythmogenic risk based on this hazard map agreed well with the risk assessments reported in the literature. ECG databases also suggested that the interval between the J-point and the T-wave peak is a superior index of arrhythmogenicity when compared to the QT interval due to its ability to characterize the multi-channel effects compared with QT interval.
Conclusion and implications: Because concentration-dependent effects on electrocardiograms of any drug can be traced on this map based on in vitro current assay data, its arrhythmogenic risk can be evaluated without performing costly and potentially risky human electrophysiological assays. Hence, the map serves as a novel tool for use in pharmaceutical research and development.
© 2018 The Authors. British Journal of Pharmacology published by John Wiley & Sons Ltd on behalf of British Pharmacological Society.
Figures
Similar articles
-
Cardiac voltage-gated ion channels in safety pharmacology: Review of the landscape leading to the CiPA initiative.J Pharmacol Toxicol Methods. 2017 Sep;87:11-23. doi: 10.1016/j.vascn.2017.04.002. Epub 2017 Apr 11. J Pharmacol Toxicol Methods. 2017. PMID: 28408211 Review.
-
Enhanced QSAR models for drug-triggered inhibition of the main cardiac ion currents.J Appl Toxicol. 2015 Sep;35(9):1030-9. doi: 10.1002/jat.3095. Epub 2015 Jan 5. J Appl Toxicol. 2015. PMID: 25559930
-
In Silico QT and APD Prolongation Assay for Early Screening of Drug-Induced Proarrhythmic Risk.J Chem Inf Model. 2018 Apr 23;58(4):867-878. doi: 10.1021/acs.jcim.7b00440. Epub 2018 Mar 16. J Chem Inf Model. 2018. PMID: 29547274
-
[Ventricular arrhythmias. A potential risk associated with the use of non-cardiovascular drugs prolonging the QT interval].Minerva Med. 2002 Jun;93(3):181-97. Minerva Med. 2002. PMID: 12094149 Review. Italian.
-
Preclinical cardiac safety assessment of pharmaceutical compounds using an integrated systems-based computer model of the heart.Prog Biophys Mol Biol. 2006 Jan-Apr;90(1-3):414-43. doi: 10.1016/j.pbiomolbio.2005.06.006. Prog Biophys Mol Biol. 2006. PMID: 16321428
Cited by
-
HPC Framework for Performing in Silico Trials Using a 3D Virtual Human Cardiac Population as Means to Assess Drug-Induced Arrhythmic Risk.Methods Mol Biol. 2024;2716:307-334. doi: 10.1007/978-1-0716-3449-3_14. Methods Mol Biol. 2024. PMID: 37702946
-
In silico models for evaluating proarrhythmic risk of drugs.APL Bioeng. 2020 Jun 4;4(2):021502. doi: 10.1063/1.5132618. eCollection 2020 Jun. APL Bioeng. 2020. PMID: 32548538 Free PMC article. Review.
-
Machine learning approach to evaluate TdP risk of drugs using cardiac electrophysiological model including inter-individual variability.Front Physiol. 2023 Oct 4;14:1266084. doi: 10.3389/fphys.2023.1266084. eCollection 2023. Front Physiol. 2023. PMID: 37860622 Free PMC article.
-
Three-Dimensional Heart Model-Based Screening of Proarrhythmic Potential by in silico Simulation of Action Potential and Electrocardiograms.Front Physiol. 2019 Sep 4;10:1139. doi: 10.3389/fphys.2019.01139. eCollection 2019. Front Physiol. 2019. PMID: 31551815 Free PMC article.
-
Fast and accurate prediction of drug induced proarrhythmic risk with sex specific cardiac emulators.NPJ Digit Med. 2024 Dec 26;7(1):380. doi: 10.1038/s41746-024-01370-8. NPJ Digit Med. 2024. PMID: 39725693 Free PMC article.
References
-
- Aiba T, Tomaselli GF, Shimizu W (2010). Electrophysiological remodeling in heart failure dyssynchrony vs. resynchronization. J Arrhythmia 26: 79–90.
-
- Bottino D, Penland RC, Stamps A, Traebert M, Dumotier B, Georgieva A et al (2006). Preclinical cardiac safety assessment of pharmacological compounds using an integrated system‐based computer model of the heart. Prog Biophys Mol Biol 90: 413–443. - PubMed
-
- Chi KR (2013a). Speedy validation sought for new cardiotoxicity testing strategy. Nature Rev Drug Discov 12: 655. - PubMed
-
- Chi KR (2013b). Revolution dawning in cardiotoxicity testing. Nature Rev Drug Discov 12: 565–567. - PubMed
Publication types
MeSH terms
Substances
LinkOut - more resources
Full Text Sources
Other Literature Sources
Medical
Miscellaneous
