. 2018 May 11;67(18):509-514.
doi: 10.15585/mmwr.mm6718a1.

Deaths from Falls Among Persons Aged ≥65 Years - United States, 2007-2016

Deaths from Falls Among Persons Aged ≥65 Years - United States, 2007-2016

Elizabeth Burns et al. MMWR Morb Mortal Wkly Rep. .

Abstract

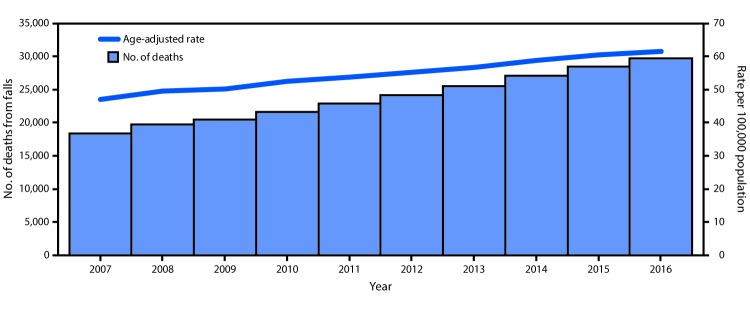
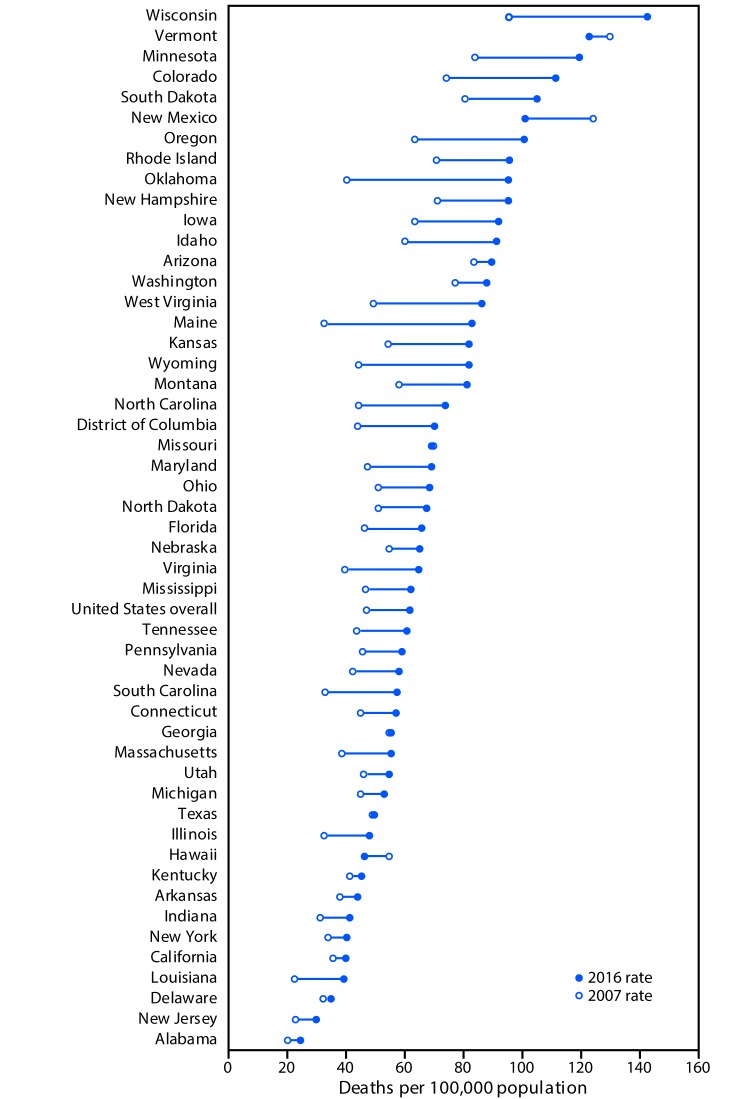
Deaths from unintentional injuries are the seventh leading cause of death among older adults (1), and falls account for the largest percentage of those deaths. Approximately one in four U.S. residents aged ≥65 years (older adults) report falling each year (2), and fall-related emergency department visits are estimated at approximately 3 million per year.* In 2016, a total of 29,668 U.S. residents aged ≥65 years died as the result of a fall (age-adjusted rate = 61.6 per 100,000), compared with 18,334 deaths (47.0) in 2007. To evaluate this increase, CDC produced age-adjusted rates and trends for deaths from falls among persons aged ≥65 years, by selected characteristics (sex, age group, race/ethnicity, and urban/rural status) and state from 2007 to 2016. The rate of deaths from falls increased in the United States by an average of 3.0% per year during 2007-2016, and the rate increased in 30 states and the District of Columbia (DC) during that period. In eight states, the rate of deaths from falls increased for a portion of the study period. The rate increased in almost every demographic category included in the analysis, with the largest increase per year among persons aged ≥85 years. Health care providers should be aware that deaths from falls are increasing nationally among older adults but that falls are preventable. Falls and fall prevention should be discussed during annual wellness visits, when health care providers can assess fall risk, educate patients about falls, and select appropriate interventions.


Conflict of interest statement

No conflicts of interest were reported.

Figures

FIGURE 1
FIGURE 1
Number of deaths from falls and age-adjusted rates among adults aged ≥65 years — United States, 2007–2016 * Age-adjusted death rates were calculated by applying age-specific death rates to the 2000 U.S standard population age distribution.
FIGURE 2
FIGURE 2
Age-adjusted rate of deaths from falls among persons aged ≥65 years, by state and overall — United States, 2007 and 2016 Source: CDC. National Vital Statistics System, Mortality. CDC WONDER. https://wonder.cdc.gov/. * Rates shown are the number of deaths per 100,000 population. Age-adjusted death rates were calculated by applying age-specific death rates to the 2000 U.S standard population age distribution. Deaths from falls were identified using International Classification of Diseases, Tenth Revision (ICD–10) underlying cause-of-death codes W00–W19. § Joinpoint regression examining changes in trends indicated that, from 2007 to 2016, the District of Columbia and 30 states had significant increases in the rate of deaths from falling (Arkansas, California, Connecticut, Florida, Idaho, Illinois, Indiana, Iowa, Kansas, Kentucky, Louisiana, Maine, Maryland, Massachusetts, Michigan, Minnesota, Montana, New Jersey, New York, North Carolina, Ohio, Oklahoma, Pennsylvania, Rhode Island, South Carolina, South Dakota, Virginia, Washington, West Virginia, and Wyoming). Colorado, Oregon, and Tennessee had initial increases, followed by stable rates during this period. Arizona, Nevada, and Wisconsin had an initial period of stability followed by a significant increase. In Missouri, there was a decrease from 2007 to 2012, followed by an increase from 2012 to 2016. In Utah there was an increase from 2007 to 2012 followed by a decrease to 2016. Eleven states had nonsignificant trends during this period (Alabama, Delaware, Georgia, Hawaii, Mississippi, Nebraska, New Hampshire, New Mexico, North Dakota, Texas, and Vermont). Alaska did not have enough data to examine trends.

References

    1. National Center for Health Statistics. Health, United States, 2016: with chartbook on long-term trends in health. Hyattsville, MD: US Department of Health and Human Services, CDC, National Center for Health Statistics; 2017. - PubMed
    1. Bergen G, Stevens MR, Burns ER. Falls and fall injuries among adults aged ≥65 years—United States, 2014. MMWR Morb Mortal Wkly Rep 2016;65:993–8. 10.15585/mmwr.mm6537a2 - DOI - PubMed
    1. Hu G, Baker SP. Recent increases in fatal and non-fatal injury among people aged 65 years and over in the USA. Inj Prev 2010;16:26–30. 10.1136/ip.2009.023481 - DOI - PubMed
    1. Cheng X, Wu Y, Yao J, Schwebel DC, Hu G. Mortality from unspecified unintentional injury among individuals aged 65 years and older by U.S. state, 1999–2013. Int J Environ Res Public Health 2016;13:763. 10.3390/ijerph13080763 - DOI - PMC - PubMed
    1. Maresh J, Guse C, Layde P. National trends and coding patterns in fall-related mortality among the elderly in the United States. J Public Health Policy 2012;33:202–14. 10.1057/jphp.2012.6 - DOI - PMC - PubMed