

Seasonal temperature variation influences climate suitability for dengue, chikungunya, and Zika transmission
- PMID: 29746468
- PMCID: PMC5963813
- DOI: 10.1371/journal.pntd.0006451
Seasonal temperature variation influences climate suitability for dengue, chikungunya, and Zika transmission
Abstract
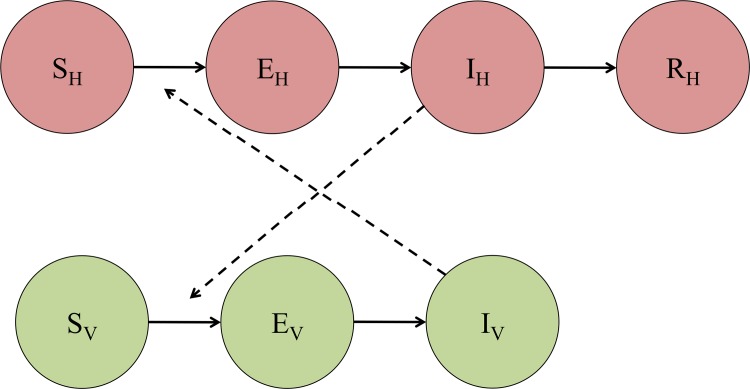
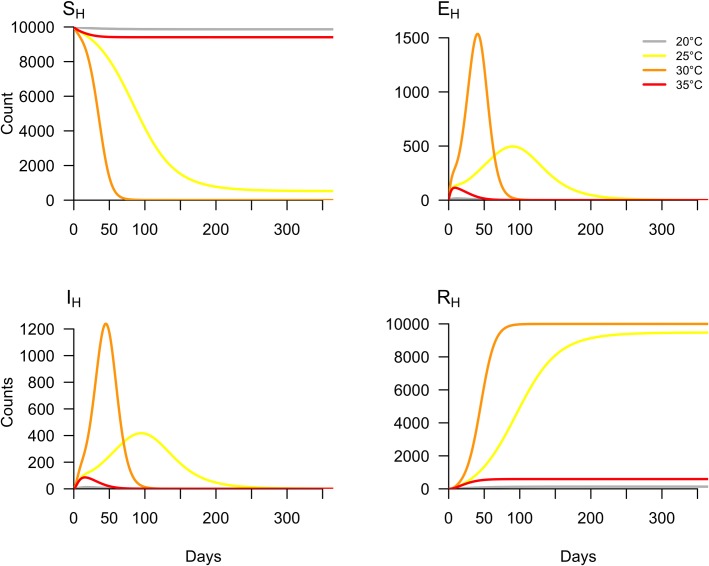
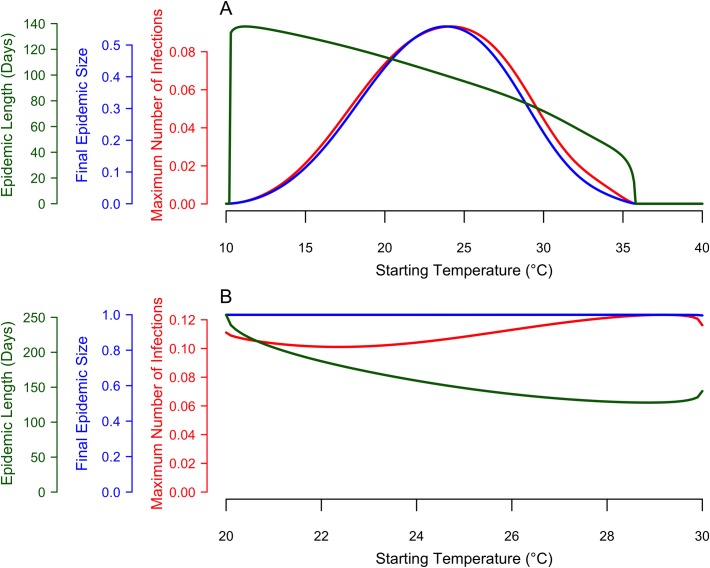
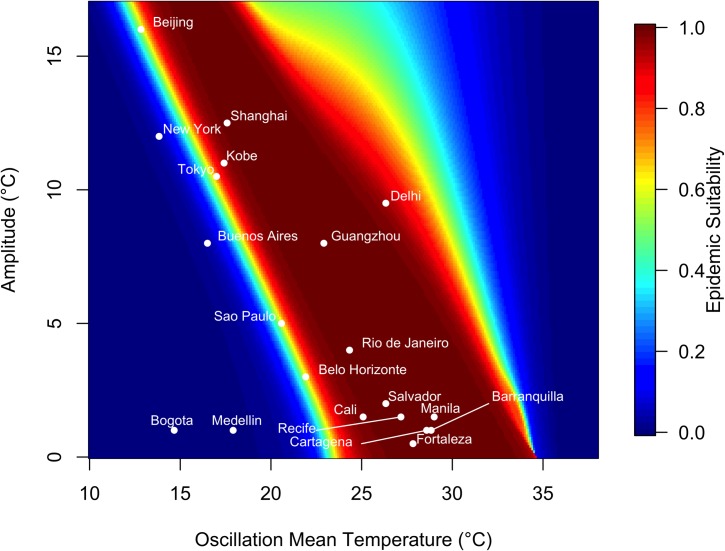
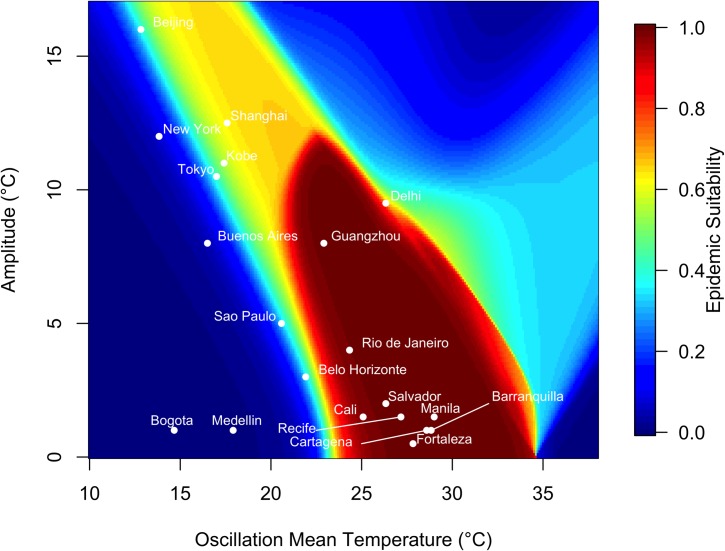
Dengue, chikungunya, and Zika virus epidemics transmitted by Aedes aegypti mosquitoes have recently (re)emerged and spread throughout the Americas, Southeast Asia, the Pacific Islands, and elsewhere. Understanding how environmental conditions affect epidemic dynamics is critical for predicting and responding to the geographic and seasonal spread of disease. Specifically, we lack a mechanistic understanding of how seasonal variation in temperature affects epidemic magnitude and duration. Here, we develop a dynamic disease transmission model for dengue virus and Aedes aegypti mosquitoes that integrates mechanistic, empirically parameterized, and independently validated mosquito and virus trait thermal responses under seasonally varying temperatures. We examine the influence of seasonal temperature mean, variation, and temperature at the start of the epidemic on disease dynamics. We find that at both constant and seasonally varying temperatures, warmer temperatures at the start of epidemics promote more rapid epidemics due to faster burnout of the susceptible population. By contrast, intermediate temperatures (24-25°C) at epidemic onset produced the largest epidemics in both constant and seasonally varying temperature regimes. When seasonal temperature variation was low, 25-35°C annual average temperatures produced the largest epidemics, but this range shifted to cooler temperatures as seasonal temperature variation increased (analogous to previous results for diurnal temperature variation). Tropical and sub-tropical cities such as Rio de Janeiro, Fortaleza, and Salvador, Brazil; Cali, Cartagena, and Barranquilla, Colombia; Delhi, India; Guangzhou, China; and Manila, Philippines have mean annual temperatures and seasonal temperature ranges that produced the largest epidemics. However, more temperate cities like Shanghai, China had high epidemic suitability because large seasonal variation offset moderate annual average temperatures. By accounting for seasonal variation in temperature, the model provides a baseline for mechanistically understanding environmental suitability for virus transmission by Aedes aegypti. Overlaying the impact of human activities and socioeconomic factors onto this mechanistic temperature-dependent framework is critical for understanding likelihood and magnitude of outbreaks.
Conflict of interest statement
The authors have declared that no competing interests exist.
Figures
References
-
- Gubler DJ. The global emergence/resurgence of arboviral diseases as public health problems. Arch Med Res. 2002;33: 330–342. - PubMed
-
- Faria NR, Azevedo R do S da S, Kraemer MUG, Souza R, Cunha MS, Hill SC, et al. Zika virus in the Americas: Early epidemiological and genetic findings. Science. 2016;352: 345–349. doi: 10.1126/science.aaf5036 - DOI - PMC - PubMed
-
- Staples JE, Breiman RF, Powers AM. Chikungunya Fever: An Epidemiological Review of a Re‐Emerging Infectious Disease. Clin Infect Dis. 2009;49: 942–948. doi: 10.1086/605496 - DOI - PubMed
-
- Special Programme for Research and Training in Tropical Diseases, World Health Organization, editors. Dengue: guidelines for diagnosis, treatment, prevention, and control. New ed. Geneva: TDR: World Health Organization; 2009.
-
- Gubler DJ. Dengue/dengue haemorrhagic fever: history and current status. Novartis Found Symp. 2006;277: 3–16; discussion 16–22, 71–73, 251–253. - PubMed
Publication types
MeSH terms
LinkOut - more resources
Full Text Sources
Other Literature Sources
Medical
