. 2018 May 10;13(5):e0197056.
doi: 10.1371/journal.pone.0197056. eCollection 2018.

Free water modeling of peritumoral edema using multi-fiber tractography: Application to tracking the arcuate fasciculus for neurosurgical planning

Affiliations

Free water modeling of peritumoral edema using multi-fiber tractography: Application to tracking the arcuate fasciculus for neurosurgical planning

Shun Gong et al. PLoS One. .

Abstract

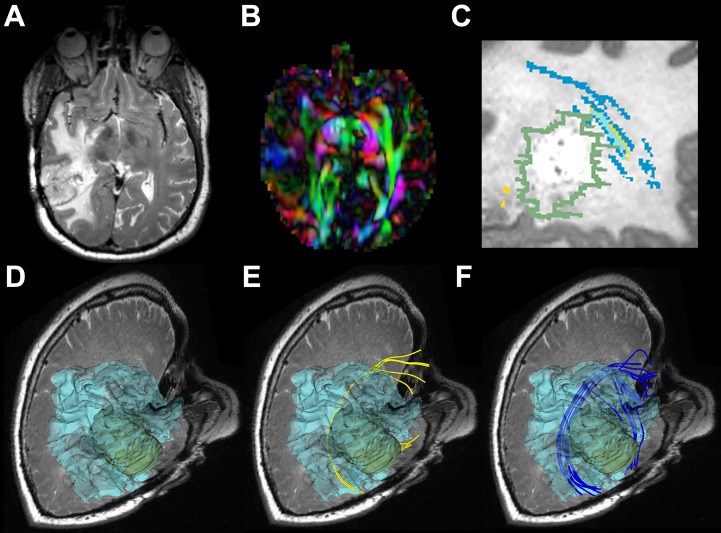
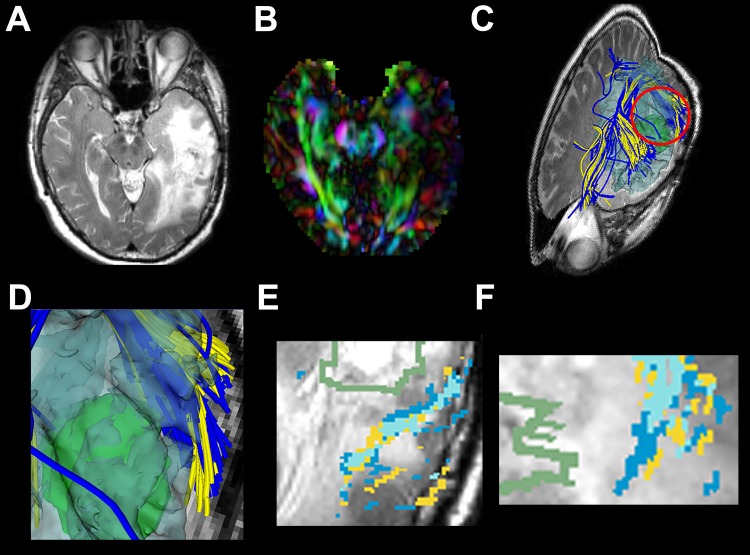
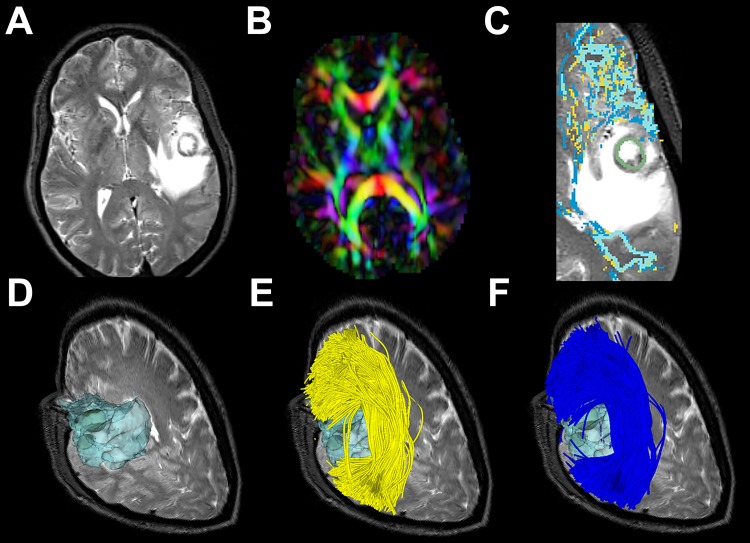
Purpose: Peritumoral edema impedes the full delineation of fiber tracts due to partial volume effects in image voxels that contain a mixture of cerebral parenchyma and extracellular water. The purpose of this study is to investigate the effect of incorporating a free water (FW) model of edema for white matter tractography in the presence of edema.

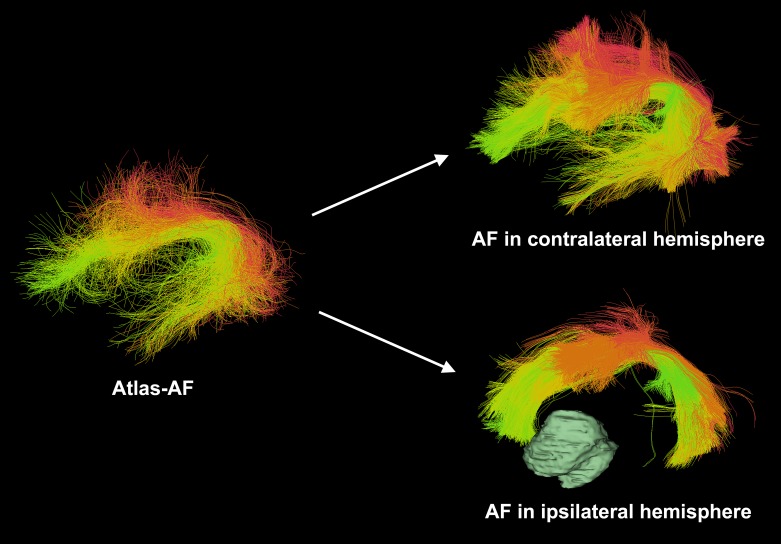
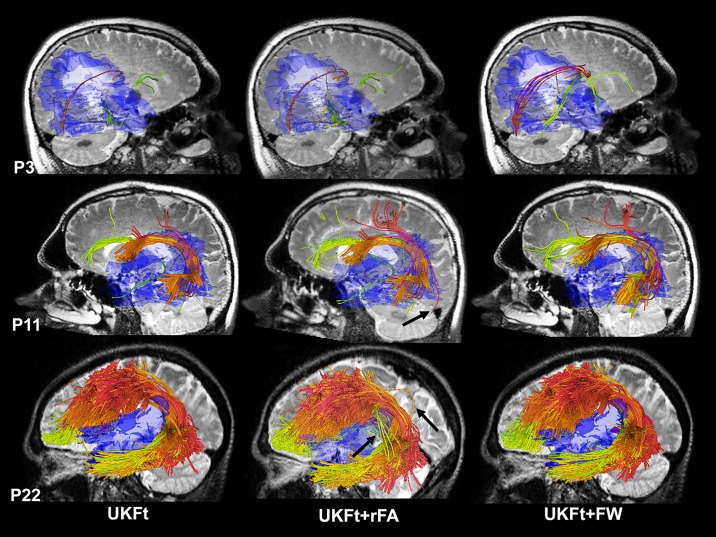
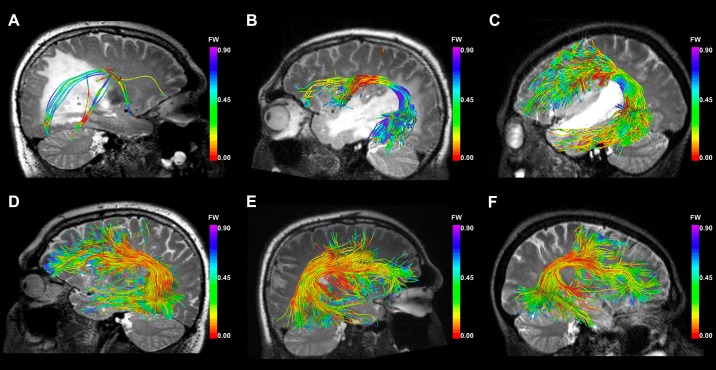
Materials and methods: We retrospectively evaluated 26 consecutive brain tumor patients with diffusion MRI and T2-weighted images acquired presurgically. Tractography of the arcuate fasciculus (AF) was performed using the two-tensor unscented Kalman filter tractography (UKFt) method, the UKFt method with a reduced fiber tracking stopping fractional anisotropy (FA) threshold (UKFt+rFA), and the UKFt method with the addition of a FW compartment (UKFt+FW). An automated white matter fiber tract identification approach was applied to delineate the AF. Quantitative measurements included tract volume, edema volume, and mean FW fraction. Visual comparisons were performed by three experts to evaluate the quality of the detected AF tracts.

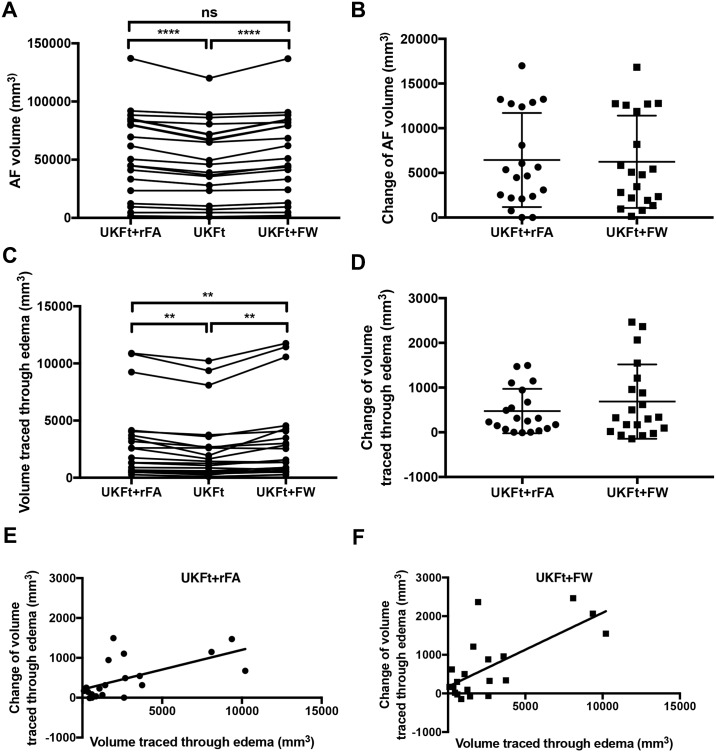
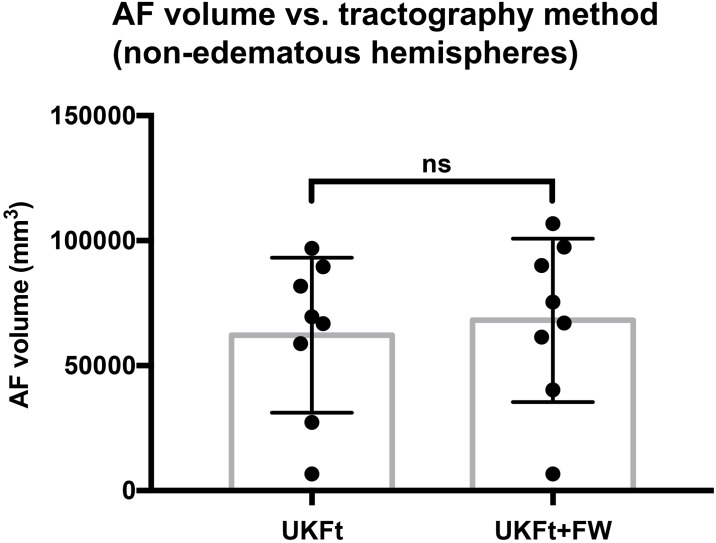
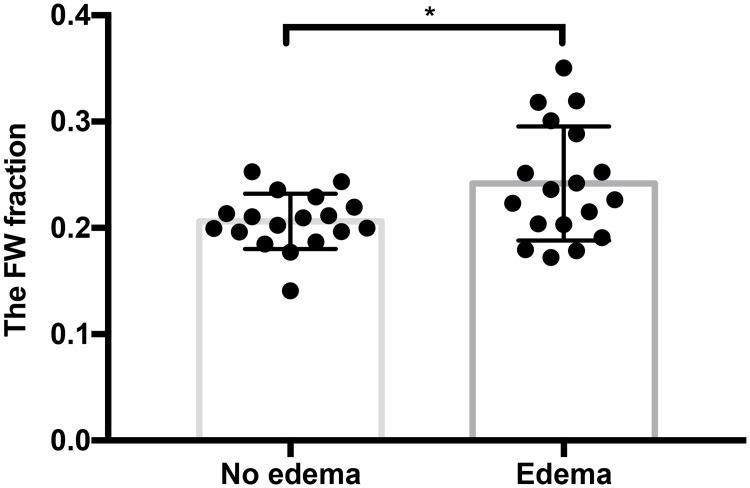
Results: The AF volume in edematous brain hemispheres was significantly larger using the UKFt+FW method (p<0.0001) compared to UKFt, but not significantly larger (p = 0.0996) in hemispheres without edema. The AF size increase depended on the volume of edema: a significant correlation was found between AF volume affected by (intersecting) edema and AF volume change with the FW model (Pearson r = 0.806, p<0.0001). The mean FW fraction was significantly larger in tracts intersecting edema (p = 0.0271). Compared to the UKFt+rFA method, there was a significant increase of the volume of the AF tract that intersected the edema using the UKFt+FW method, while the whole AF volumes were similar. Expert judgment results, based on the five patients with the smallest AF volumes, indicated that the expert readers generally preferred the AF tract obtained by using the FW model, according to their anatomical knowledge and considering the potential influence of the final results on the surgical route.

Conclusion: Our results indicate that incorporating biophysical models of edema can increase the sensitivity of tractography in regions of peritumoral edema, allowing better tract visualization in patients with high grade gliomas and metastases.


Conflict of interest statement

Competing Interests: The authors have declared that no competing interests exist.

Figures

Fig 1
Fig 1. Automated white matter fiber tract identification of the arcuate fasciculus (AF) tracts in patient data.
Visualization of AF tracts uses colors indicating individual fiber clusters as defined in the atlas, where each fiber cluster has a unique color, and similar clusters have similar colors (green surface model shows the brain tumor).
Fig 2
Fig 2. Automatically detected arcuate fasciculus tract clusters in example datasets from patients with edema.
Views are from left or right based on the involvement with edema, using the UKFt, UKFt+rFA and UKFt+FW methods of P3, P11, P22. A T2-weighted image is shown behind the fiber tracts. Edema is shown in transparent blue. Tract colors indicate individual fiber clusters as defined in the atlas. For the UKFt+rFA method, the FA thresholds were set to 0.03, 0.07 and 0.07 for the three cases, respectively, to achieve the most similar AF volumes to those obtained using the UKF+FW method. Overall, reducing the FA threshold and adding the FW model both resulted in visually larger AF tracts on the three cases compared to UKFt. In P3, the UKFt+FW method obtained more visually apparent anatomically correct AF fibers (red). In P11 and P22, while tracts obtained using the UFKt+rFA and UKFt+FW methods are visually similar, the UKFt+rFA method introduced more visually apparent false positive fibers (as indicated by the black arrows) than the UKFt+FW method.
Fig 3
Fig 3. Images from P3 with a right temporal lesion.
(a) T2-weighted image shows a temporal tumor with extensive edema around the lesion. (b) Directionally encoded color FA map shows reduced anisotropy in AF. (c) Magnified sagittal view of a T2-weighted image with overlaid label maps showing fibers reconstructed by the UKFt (yellow) and UKFt+FW (dark blue) methods and where they overlap (light blue) near the tumor (green outlined). (d) The reconstructed edematous area (transparent blue surface model) near the tumor (green model). (e) The AF using the UKFt method displayed in yellow. (f) The AF using the UKFt+FW method displayed in blue.
Fig 4
Fig 4. Images from P11 with a left temporal GBM.
(a) T2-weighted image shows a temporal tumor with extensive edema around the lesion. (b) Directionally encoded color FA map shows reduced anisotropy in AF. (c) The AF is reconstructed by the UKFt (yellow tracts) and UKFt+FW (blue tracts) methods. (d) The magnified red circle (in c) area shows a slight difference in fibers traced using the UKFt+FW vs the UKFt method near the tumor (green surface model). (e) Magnified axial view of a T2-weighted image with overlaid label maps showing fibers reconstructed by the UKFt (yellow) and UKFt+FW (dark blue) methods and where they overlap (light blue) near the tumor (green outlined). (f) Magnified sagittal view of a T2-weighted image with overlaid label maps showing fibers reconstructed by the UKFt and UKFt+FW methods and where they overlap near the tumor.
Fig 5
Fig 5. Images from P22 with a left frontal-parietal lesion.
(a) T2-weighted image shows a temporal tumor with extensive edema around the lesion. (b) Directionally encoded color FA map shows reduced anisotropy in AF. (c) Magnified axial view of a T2-weighted image with overlaid label maps showing fibers reconstructed by the UKFt (yellow) and UKFt+FW (dark blue) methods and where they overlap (light blue) near the tumor (green outlined). (d) The reconstructed edematous area (transparent blue surface model) near the tumor (green model). (e) The AF using the UKFt method displayed in yellow. (f) The AF using the UKFt+FW method displayed in blue.
Fig 6
Fig 6. Graphs of the volumes of the AF in edematous hemispheres.
(a) Significant differences between AF volumes (n = 20) using the UKFt and UKFt+rFA methods (p<0.0001) and using the UKFt and UKFt+FW methods (p<0.0001), two-tailed paired t-tests. No significant difference between the UKFt+FW and UKFt+rFA methods (p = 0.186), two-tailed paired t-test. (b) The volume changes of AF in edematous hemispheres with reduced FA threshold (UKFt+rFA) and with the addition of the FW model (UKFt+FW). (c) Significant differences between the volumes of the tract that intersected the edema using the UKFt and UKFt+rFA methods (p = 0.0004) and using the UKFt and UKFt+FW methods (p = 0.0015), two-tailed paired t-tests. A significant difference between the UKFt+FW and UKFt+rFA methods (p = 0.039), two-tailed paired t-test. (d) The volume changes of AF that intersected the edema with reduced FA threshold (UKFt+rFA) and with the addition of the FW model (UKFt+FW). (e) A significant correlation between the AF volume traced through edema using the UKFt+rFA method and the AF-edema intersection volume change using the UKFt vs UKFt+rFA methods, Pearson r = 0.695, p<0.0001. (f) A significant correlation between the AF volume traced through edema using the UKFt+FW method and the AF-edema intersection volume change using the UKFt vs UKFt+FW methods, Pearson r = 0.806, p<0.0001.
Fig 7
Fig 7. Graph of the volume of the AF in non-edematous tumor hemispheres.
Bar graph shows no significant difference between AF volumes using the UKFt and UKFt+FW methods in nonedematous tumor hemispheres, n = 8, p = 0.0996, two-tailed paired t-test.
Fig 8
Fig 8. Histogram of fiber lengths in AF.
Histogram shows the distribution of the number of fibers versus the fiber length of the AF tracts in all edematous hemispheres.
Fig 9
Fig 9. Mean FW fraction of AF fibers.
Bar graph shows a significant difference between the mean FW fraction of fibers that traverse and did not traverse edema in the UKFt+FW method, n = 18 (data from 2 patients were excluded due to no fibers traversing no edema area), p = 0.0271, two-tailed paired t-test.
Fig 10
Fig 10. FW fraction of fibers near the tumor.
Images show the fibers colored by the FW fraction near the tumor using the UKFt+FW method in edematous hemispheres of (a) P3, (b) P11, (c) P22 and non-edematous hemispheres of (d) P3, (e) P11, (f) P22. In these illustrative example cases, P3 has significant edema, P11 moderate edema, and P22 little edema affecting the AF. Along the fibers, the color scales are the same across the three patients: warm colors represent low FW fraction values, and cool colors represent high values (see color bar). A T2-weighted image is shown behind the fiber tracts.

References

    1. Matthews PM, Honey GD, Bullmore ET. Applications of fMRI in translational medicine and clinical practice. Nat Rev Neurosci. 2006;7: 732–744. doi: 10.1038/nrn1929 - DOI - PubMed
    1. Farshidfar Z, Faeghi F, Mohseni M, Seddighi A, Kharrazi HH, Abdolmohammadi J. Diffusion tensor tractography in the presurgical assessment of cerebral gliomas. Neuroradiol J. 2014;27: 75–84. doi: 10.15274/NRJ-2014-10008 - DOI - PMC - PubMed
    1. Niu C, Liu X, Yang Y, Zhang K, Min Z, Wang M, et al. Assessing Region of Interest Schemes for the Corticospinal Tract in Patients With Brain Tumors. Medicine. 2016;95: e3189 doi: 10.1097/MD.0000000000003189 - DOI - PMC - PubMed
    1. Petrella JR, Shah LM, Harris KM, Friedman AH, George TM, Sampson JH, et al. Preoperative functional MR imaging localization of language and motor areas: effect on therapeutic decision making in patients with potentially resectable brain tumors. Radiology. 2006;240: 793–802. doi: 10.1148/radiol.2403051153 - DOI - PubMed
    1. Wu J-S, Zhou L-F, Tang W-J, Mao Y, Hu J, Song Y-Y, et al. Clinical evaluation and follow-up outcome of diffusion tensor imaging-based functional neuronavigation: a prospective, controlled study in patients with gliomas involving pyramidal tracts. Neurosurgery. 2007;61: 935–48; discussion 948–9. doi: 10.1227/01.neu.0000303189.80049.ab - DOI - PubMed

Publication types