

Optic tract injury after closed head traumatic brain injury in mice: A model of indirect traumatic optic neuropathy
- PMID: 29746557
- PMCID: PMC5944994
- DOI: 10.1371/journal.pone.0197346
Optic tract injury after closed head traumatic brain injury in mice: A model of indirect traumatic optic neuropathy
Abstract
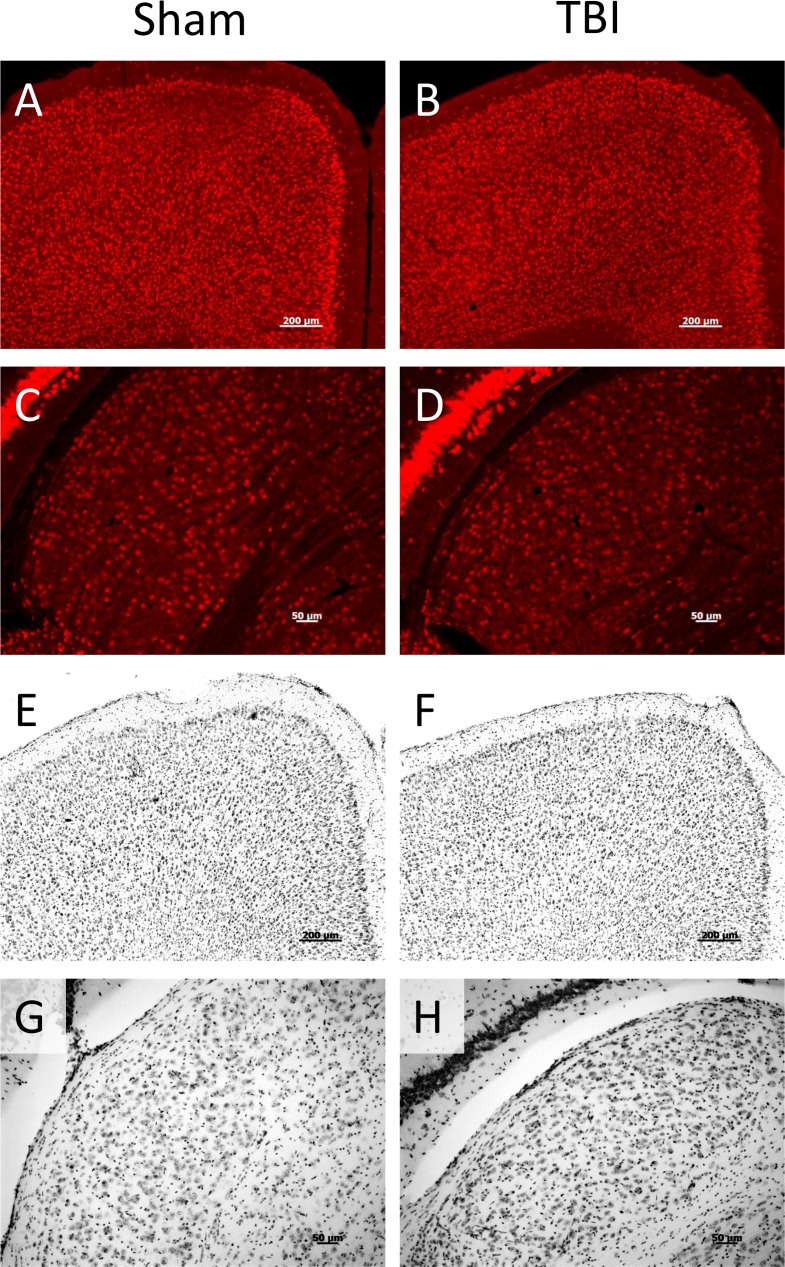
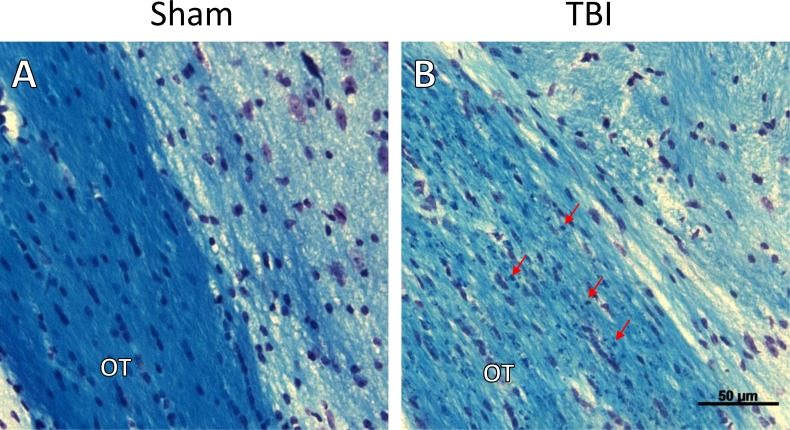
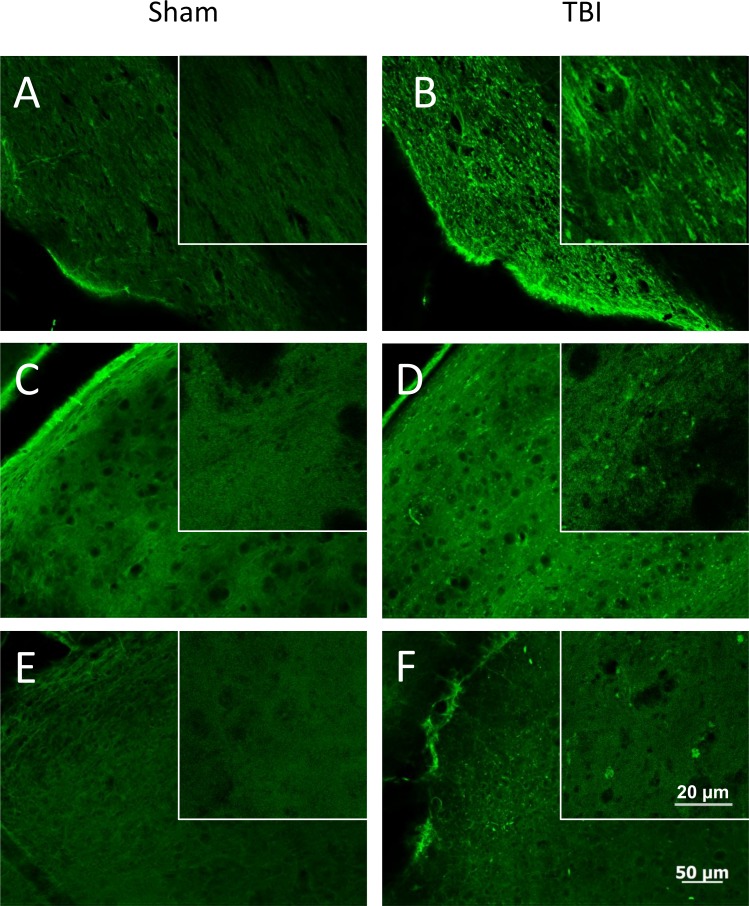
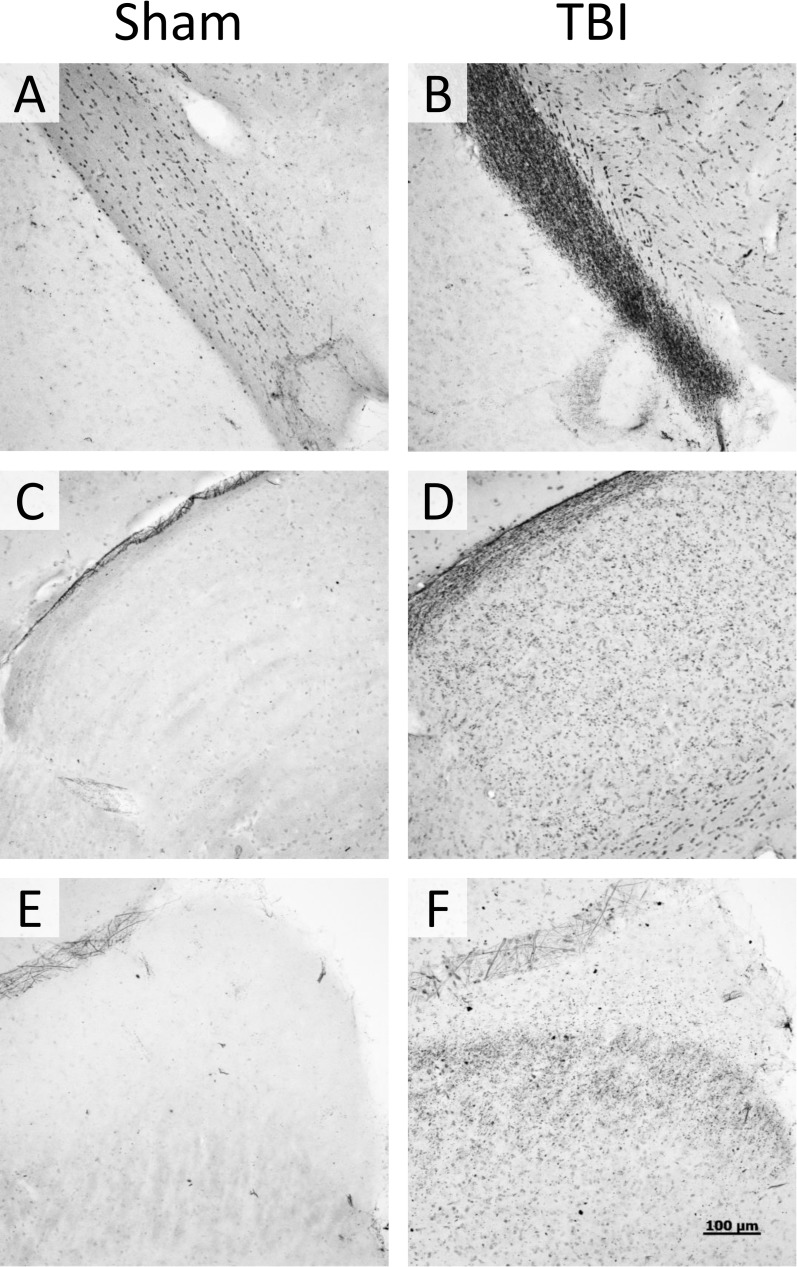
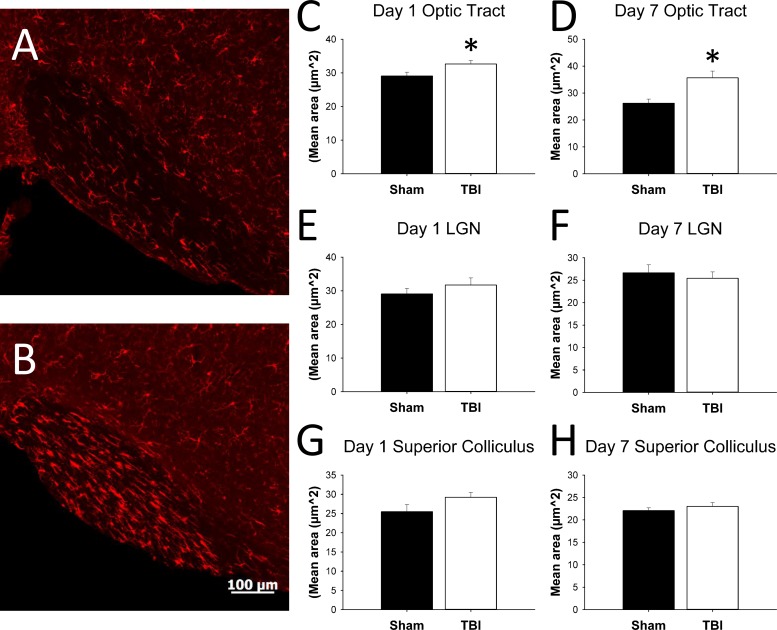
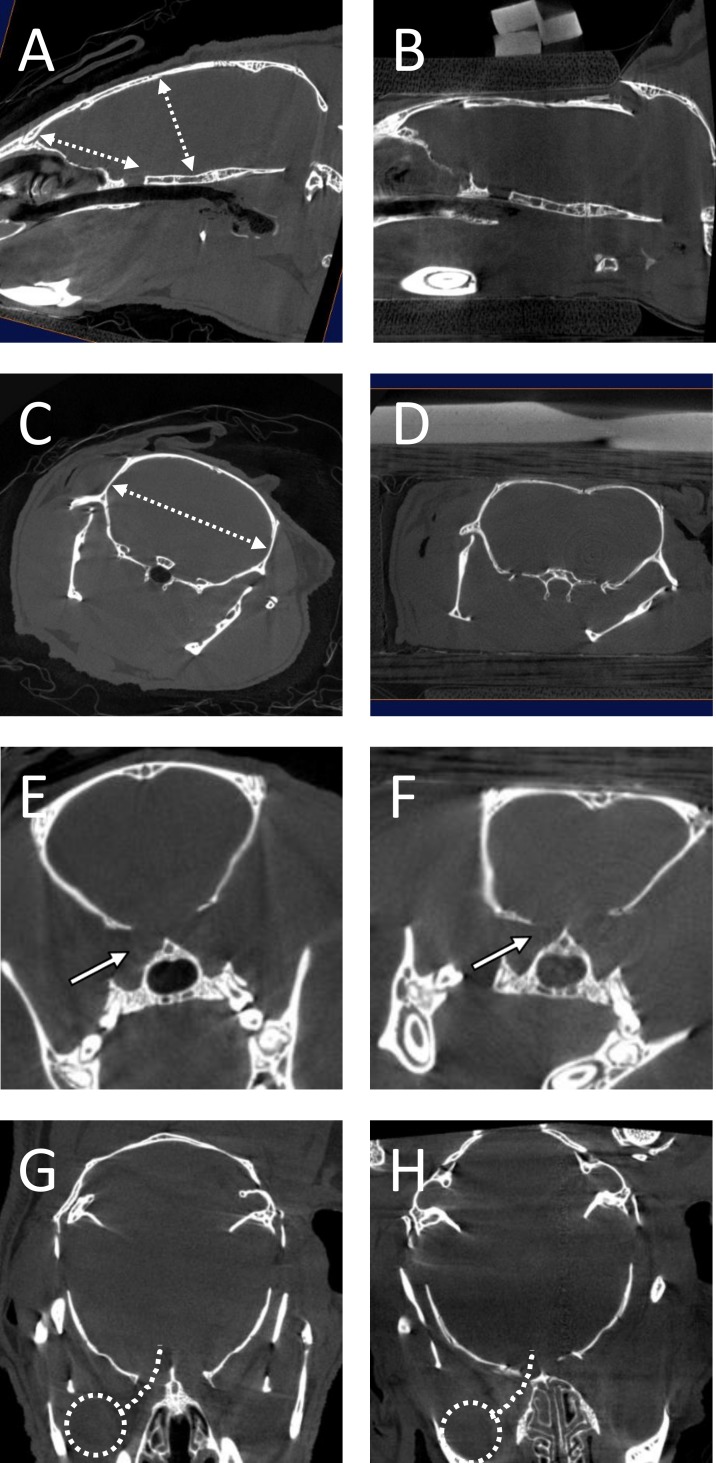
Adult male C57BL/6J mice have previously been reported to have motor and memory deficits after experimental closed head traumatic brain injury (TBI), without associated gross pathologic damage or neuroimaging changes detectable by magnetic resonance imaging or diffusion tensor imaging protocols. The presence of neurologic deficits, however, suggests neural damage or dysfunction in these animals. Accordingly, we undertook a histologic analysis of mice after TBI. Gross pathology and histologic analysis using Nissl stain and NeuN immunohistochemistry demonstrated no obvious tissue damage or neuron loss. However, Luxol Fast Blue stain revealed myelin injury in the optic tract, while Fluoro Jade B and silver degeneration staining revealed evidence of axonal neurodegeneration in the optic tract as well as the lateral geniculate nucleus of the thalamus and superior colliculus (detectable at 7 days, but not 24 hours, after injury). Fluoro Jade B staining was not detectable in other white matter tracts, brain regions or in cell somata. In addition, there was increased GFAP staining in these optic tract, lateral geniculate, and superior colliculus 7 days post-injury, and morphologic changes in optic tract microglia that were detectable 24 hours after injury but were more prominent 7 days post-injury. Interestingly, there were no findings of degeneration or gliosis in the suprachiasmatic nucleus, which is also heavily innervated by the optic tract. Using micro-computed tomography imaging, we also found that the optic canal appears to decrease in diameter with a dorsal-ventral load on the skull, which suggests that the optic canal may be the site of injury. These results suggest that there is axonal degeneration in the optic tract and a subset of directly innervated areas, with associated neuroinflammation and astrocytosis, which develop within 7 days of injury, and also suggest that this weight drop injury may be a model for studying indirect traumatic optic neuropathy.
Conflict of interest statement
Figures


Similar articles
-
Mouse closed head traumatic brain injury replicates the histological tau pathology pattern of human disease: characterization of a novel model and systematic review of the literature.Acta Neuropathol Commun. 2021 Jun 29;9(1):118. doi: 10.1186/s40478-021-01220-8. Acta Neuropathol Commun. 2021. PMID: 34187585 Free PMC article.
-
Traumatic Optic Neuropathy Is Associated with Visual Impairment, Neurodegeneration, and Endoplasmic Reticulum Stress in Adolescent Mice.Cells. 2021 Apr 23;10(5):996. doi: 10.3390/cells10050996. Cells. 2021. PMID: 33922788 Free PMC article.
-
Amelioration of visual deficits and visual system pathology after mild TBI with the cannabinoid type-2 receptor inverse agonist SMM-189.Exp Eye Res. 2019 May;182:109-124. doi: 10.1016/j.exer.2019.03.013. Epub 2019 Mar 26. Exp Eye Res. 2019. PMID: 30922891 Free PMC article.
-
Model matters: Differential outcomes in traumatic optic neuropathy pathophysiology between blunt and blast-wave mediated head injuries.Exp Neurol. 2024 Feb;372:114613. doi: 10.1016/j.expneurol.2023.114613. Epub 2023 Nov 22. Exp Neurol. 2024. PMID: 37995952 Free PMC article.
-
Myelin and oligodendrocyte lineage cells in white matter pathology and plasticity after traumatic brain injury.Neuropharmacology. 2016 Nov;110(Pt B):654-659. doi: 10.1016/j.neuropharm.2015.04.029. Epub 2015 May 9. Neuropharmacology. 2016. PMID: 25963414 Review.
Cited by
-
Visual Impairment in Pre-Clinical Models of Mild Traumatic Brain Injury.J Neurotrauma. 2024 Aug;41(15-16):1842-1852. doi: 10.1089/neu.2023.0574. Epub 2024 May 2. J Neurotrauma. 2024. PMID: 38497739 Review.
-
A microtubule stabilizer ameliorates protein pathogenesis and neurodegeneration in mouse models of repetitive traumatic brain injury.Sci Transl Med. 2023 Sep 13;15(713):eabo6889. doi: 10.1126/scitranslmed.abo6889. Epub 2023 Sep 13. Sci Transl Med. 2023. PMID: 37703352 Free PMC article.
-
Traumatic Axonal Injury in the Optic Nerve: The Selective Role of SARM1 in the Evolution of Distal Axonopathy.J Neurotrauma. 2023 Aug;40(15-16):1743-1761. doi: 10.1089/neu.2022.0416. Epub 2023 Mar 14. J Neurotrauma. 2023. PMID: 36680758 Free PMC article.
-
Greater neurodegeneration and behavioral deficits after single closed head traumatic brain injury in adolescent versus adult male mice.J Neurosci Res. 2020 Mar;98(3):557-570. doi: 10.1002/jnr.24535. Epub 2019 Sep 20. J Neurosci Res. 2020. PMID: 31541497 Free PMC article.
-
Mouse closed head traumatic brain injury replicates the histological tau pathology pattern of human disease: characterization of a novel model and systematic review of the literature.Acta Neuropathol Commun. 2021 Jun 29;9(1):118. doi: 10.1186/s40478-021-01220-8. Acta Neuropathol Commun. 2021. PMID: 34187585 Free PMC article.
References
-
- Finkelstein E, Corso PS, Miller TR. The incidence and economic burden of injuries in the United States Oxford; New York: Oxford University Press; 2006. xiii, 187 p. p.
-
- Levin HS, Robertson CS. Mild traumatic brain injury in translation. J Neurotrauma. 2013;30(8):610 doi: 10.1089/neu.2012.2394 - DOI - PMC - PubMed
-
- Chen Y, Constantini S, Trembovler V, Weinstock M, Shohami E. An experimental model of closed head injury in mice: pathophysiology, histopathology, and cognitive deficits. J Neurotrauma. 1996;13(10):557–68. Epub 1996/10/01. doi: 10.1089/neu.1996.13.557 . - DOI - PubMed
-
- Flierl MA, Stahel PF, Beauchamp KM, Morgan SJ, Smith WR, Shohami E. Mouse closed head injury model induced by a weight-drop device. Nature protocols. 2009;4(9):1328–37. Epub 2009/08/29. doi: 10.1038/nprot.2009.148 . - DOI - PubMed
-
- Yang SH, Gustafson J, Gangidine M, Stepien D, Schuster R, Pritts TA, et al. A murine model of mild traumatic brain injury exhibiting cognitive and motor deficits. J Surg Res. 2013;184(2):981–8. doi: 10.1016/j.jss.2013.03.075 ; PubMed Central PMCID: PMCPMC4073786. - DOI - PMC - PubMed
Publication types
MeSH terms
Grants and funding
LinkOut - more resources
Full Text Sources
Other Literature Sources
Medical
Miscellaneous
