. 2018 Jul 1;41(7):zsy086.
doi: 10.1093/sleep/zsy086.

Behavioral and genetic features of sleep ontogeny in Drosophila

Affiliations

Behavioral and genetic features of sleep ontogeny in Drosophila

Leela C Dilley et al. Sleep. .

Abstract

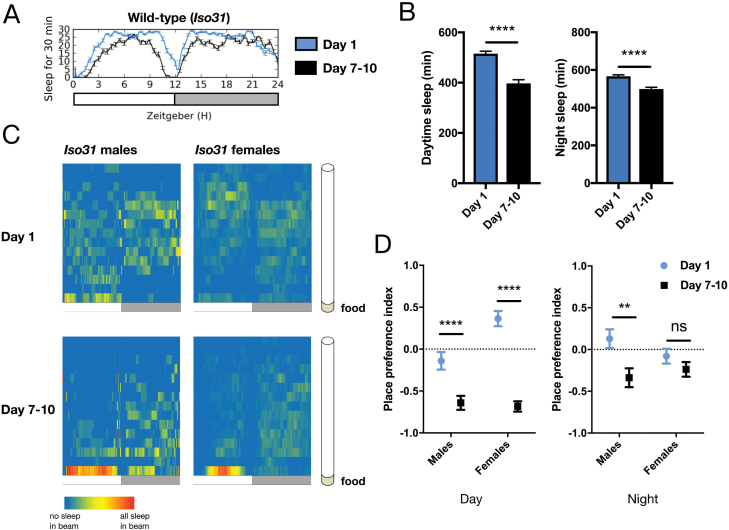
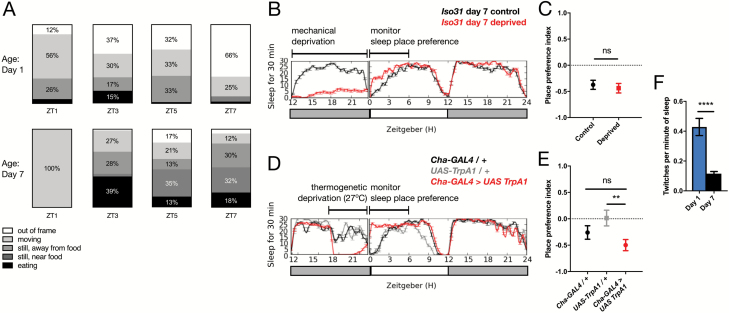
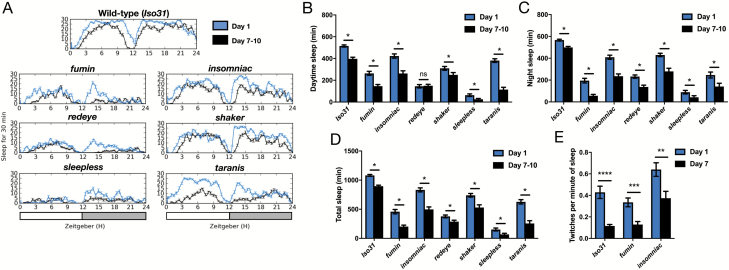
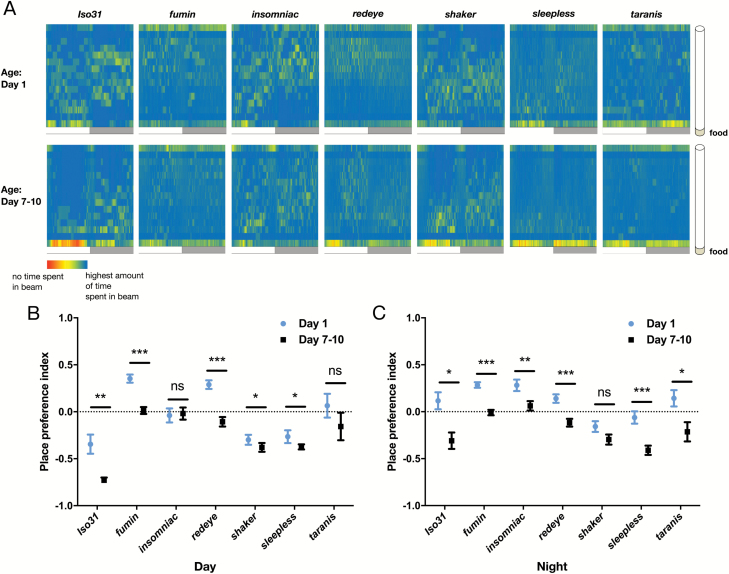
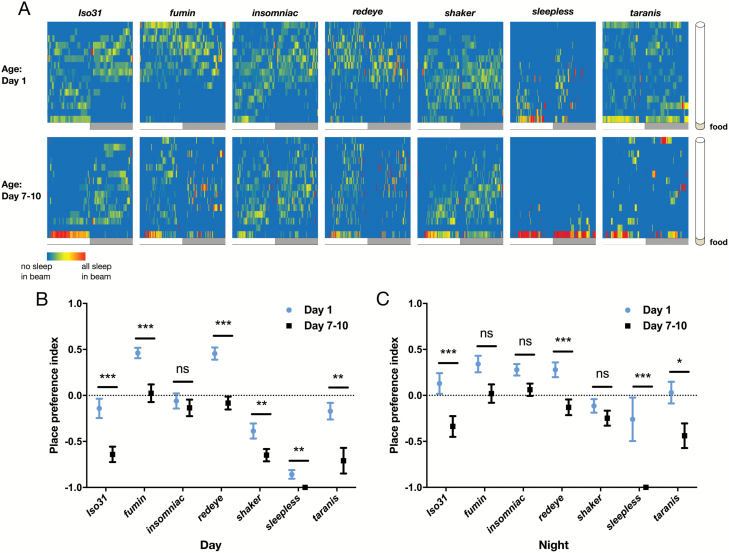
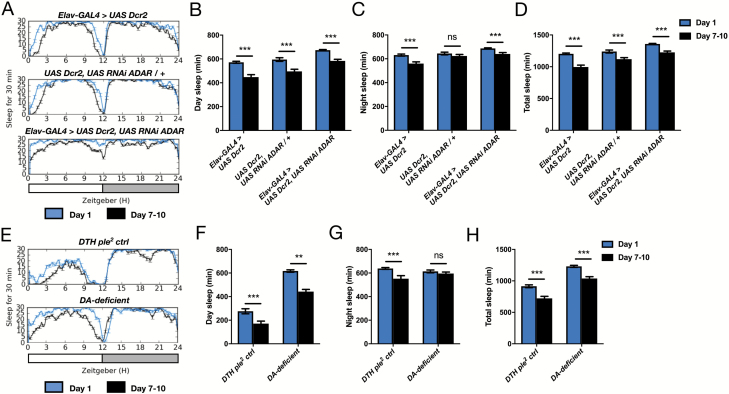
The fruit fly Drosophila melanogaster, like most organisms, exhibits increased sleep amount and depth in young compared to mature animals. While the fly has emerged as a powerful model for studying sleep during development, qualitative behavioral features of sleep ontogeny and its genetic control are poorly understood. Here we find that, in addition to increased sleep time and intensity, young flies sleep with less place preference than mature adults, and, like mammals, exhibit more motor twitches during sleep. In addition, we show that ontogenetic changes in sleep amount, twitch, and place preference are preserved across sleep mutants with lesions in distinct molecular pathways. Our results demonstrate that sleep ontogeny is characterized by multifaceted behavioral changes, including quantitative and qualitative alterations to sleep as animals mature. Further, the preservation of sleep ontogenetic changes despite mutations that alter sleep time suggests independent genetic control mechanisms for sleep maturation.


Figures

Figure 1.
Figure 1.
Sleep place preference is diminished in young adult flies. (A) Representative sleep trace of Iso31 male wild-type flies monitored in the multi-beam system. Sleep amount is plotted in a rolling 30-minute window across the 24-hour day; white = day (ZT0–ZT12), gray = night (ZT12–ZT24). (B) Quantification of day and night sleep amounts (n = 66 for age day 1, n = 67 for age day 7–10). (C) Heat map showing the proportion of sleep occurring at each position of the multi-beam tube (shown along the y-axis) in Iso31 male and female wild-type flies at age day 1 (top) or age day 7–10 (bottom); sleep in each beam is plotted in 1-minute bins (x-axis). White = day (ZT0–ZT12), gray = night (ZT12–ZT24). Tube orientation is shown at right, with the beam closest to the food at the bottom of each heat map. Value for each 1-minute bin = (# of sleep episodes for that minute in given beam / all sleep episodes occurring in the given minute). Blue indicates that 0% of the sleep episodes during that minute occurred in the given beam, while red indicates that 100% of the sleep episodes during that minute occurred in the given beam. (D) Sleep place preference index from heat maps in (C). A value of 1.0 corresponds to all sleep occurring in the beam farthest from the food, while a value of −1.0 corresponds to all sleep occurring in the beam closest to the food. Graphs in this figure and all others are presented as means ± SEM. ****p < 0.0001, **p < 0.01, *p < 0.05; unpaired two-tailed Student’s t-test plus Welch’s correction.
Figure 2.
Figure 2.
Video analysis of sleep place preference and twitch in young adult flies. (A) Proportion of time spent on each behavior in a 30-minute window beginning at indicated ZT time, based on video recording (n = 12 flies for day 1, 12 flies for day 7). (B) Representative sleep traces of Iso31 day 7 controls (black) and mechanically deprived (red) flies. (C) Sleep place preference index during the first 6 hours following deprivation in control (black) versus mechanically deprived (red) Iso31 males (n = 48 per condition). (D) Representative sleep traces of Cha-GAL4 > UAS TrpA1 (red) and genetic controls (black/gray). (E) Sleep place preference index during the first 6 hours following exposure to 27°C in genetic controls (black/gray) versus Cha-GAL4>UAS-TrpA1 (red) (n = 32 for genetic controls and 64 for experimental genotype). (F) Twitches per minute of sleep in Iso31 males at day 1 versus day 7 (n = 20 for both ages). **p < 0.01, unpaired two-tailed Student’s t-test plus Welch’s correction (B, F), ordinary one-way ANOVA with multiple comparisons and Tukey’s test (E).
Figure 3.
Figure 3.
Ontogenetic changes in sleep amount and twitch frequency are maintained in short-sleeping mutants. (A) Representative multi-beam sleep traces of Iso31 (wild-type) and short sleeping mutants fumin, redeye, sleepless, insomniac, shaker and taranis at day 1 (blue traces) and day 7–10 (black traces). (B–D) Quantification of day, night, and total sleep amounts in Iso31 and short sleeping mutants at day 1 versus day 7–10 post-eclosion (n for each genotype at day 1/day 7–10 is as follows: Iso31 66/67, fumin 24/24, insomniac 23/24, redeye 55/59, shaker 24/23, sleepless 38/39, taranis 38/38). (E) Twitches per minute of sleep from video recordings of Iso31, fumin, and insomniac day 1 versus day 7 males (n for each genotype at day 1/day 7–10 is as follows: Iso31 20/20, fumin 12/13, insomniac 17/13). ***p < 0.001, **p < 0.01, *p < 0.05; multiple Student’s t-tests with Holm-Sidak correction, α = 0.05 (B, C, D, E).
Figure 4.
Figure 4.
Location preferences of short-sleeping Drosophila mutants. (A) Representative heat maps showing the average percent of time spent in each beam for every 1-minute bin. Value for each 1-minute bin = percentage of time spent in beam during that minute, averaged over all flies. A red signal indicates that the highest average amount of time (across all genotypes/ages) was spent in that beam during that minute, while blue indicates that 0% of time on average was spent in the given beam during that minute. (B) Day and (C) night place preference indices from heat maps in (A). PPI = [(average time spent in 5 beams farthest from food) – (average time spent in 5 beams closest to food) / (total time in all beams)] (n for each genotype at day 1/day 7–10 is as follows: Iso31 66/67, fumin 24/24, insomniac 23/24, redeye 55/59, shaker 24/23, sleepless 38/39, taranis 38/38). *p < 0.05; multiple Student’s t-tests with Holm-Sidak correction, α = 0.05 (B and C).
Figure 5.
Figure 5.
Ontogenetic changes in sleep place preference persist in short-sleeping mutants. (A) Representative heat maps showing the proportion of sleep occurring in each beam in 1-minute bins. Value for each 1-minute bin = (# of sleep episodes for that minute in given beam / all sleep episodes occurring in the given minute). (B) Day and (C) night sleep place preference indices from heat maps in A (n for each genotype at day 1/day 7–10 is as follows: Iso31 66/67, fumin 24/24, insomniac 23/24, redeye 55/59, shaker 24/23, sleepless 38/39, taranis 38/38). ***p < 0.001, **p < 0.01; multiple Student’s t-tests with Holm-Sidak correction, α = 0.05 (B and C).
Figure 6.
Figure 6.
Ontogenetic changes in sleep amount persist in long sleepers. (A) Representative sleep traces of Elav-GAL4 > UAS Dcr2, UAS RNAi ADAR and genetic controls at day 1 (blue traces) and day 7–10 (black traces). (B–D) Quantification of day, night, and total sleep amounts in Elav-GAL4 > UAS Dcr2, UAS RNAi ADAR and genetic controls (n = 32 for all ages/genotypes). (E) Representative sleep traces of DTH ple [2] controls and DTHFS±Bac (“DA-deficient”) flies at day 1 (blue traces) and day 7–10 (black traces). (F–H) Quantification of day, night, and total sleep amounts in DTH ple [2] controls and DA-deficient flies (n = 24 for all ages/genotypes). ***p < 0.001, **p < 0.01; multiple Student’s t-tests with Holm-Sidak correction, α = 0.05 (B–D and F–H).

Similar articles

Cited by

References

    1. Roffwarg HP, et al. Ontogenetic development of the human sleep-dream cycle. Science. 1966;152(3722):604–619. - PubMed
    1. Kayser MS, et al. Sleep and development in genetically tractable model organisms. Genetics. 2016;203(1):21–33. - PMC - PubMed
    1. Kurth S, et al. Sleep and early cortical development. Curr Sleep Med Rep. 2015;1(1):64–73. - PMC - PubMed
    1. Gregory AM, et al. Parent-reported sleep problems during development and self-reported anxiety/depression, attention problems, and aggressive behavior later in life. Arch Pediatr Adolesc Med. 2008;162(4):330–335. - PubMed
    1. Ednick M, et al. A review of the effects of sleep during the first year of life on cognitive, psychomotor, and temperament development. Sleep. 2009;32(11):1449–1458. - PMC - PubMed

Publication types

Substances

LinkOut - more resources