. 2018 Aug 28:430:47-56.
doi: 10.1016/j.canlet.2018.05.009. Epub 2018 May 8.

Trastuzumab upregulates PD-L1 as a potential mechanism of trastuzumab resistance through engagement of immune effector cells and stimulation of IFNγ secretion

Affiliations

Trastuzumab upregulates PD-L1 as a potential mechanism of trastuzumab resistance through engagement of immune effector cells and stimulation of IFNγ secretion

Bharat K R Chaganty et al. Cancer Lett. .

Abstract

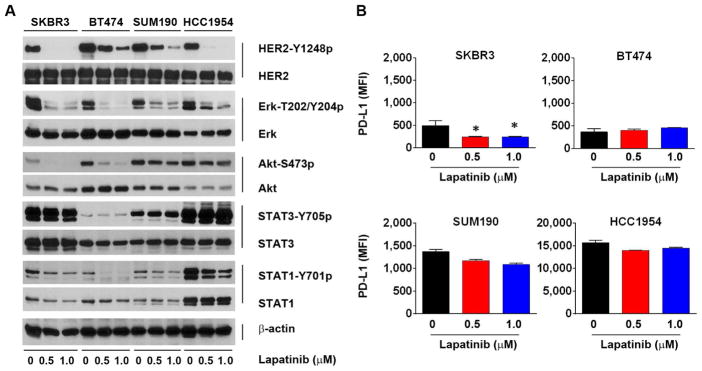
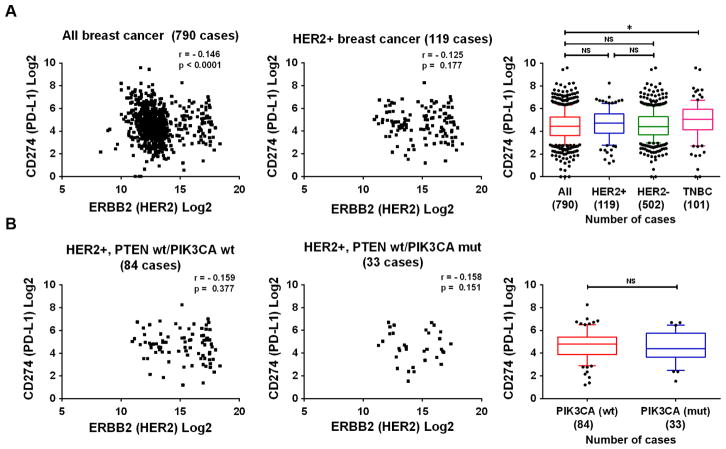
Here, we report that treatment of syngeneic mouse tumors transduced to overexpress human epidermal growth factor receptor-2 (HER2) with the anti-human HER2 antibody trastuzumab upregulated the level of programmed death-ligand 1 (PD-L1), an important negative regulator of T-cell response, in a transgenic mouse model immune-tolerant to human HER2. We further found that trastuzumab alone had no detectable effect on the level of PD-L1 expression in monocultures of HER2-overexpressing human breast cancer cells but upregulated PD-L1 in the same panel of HER2-overexpressing breast cancer cells when they were co-cultured with human peripheral blood mononuclear cells, and the upregulation of PD-L1 could be blocked by an IFNγ-neutralizing antibody. Inhibition of HER2 intrinsic signaling via HER2 expression knockdown or kinase inhibition had variable and cell-context-specific effects on downregulating the PD-L1 level. Analysis of The Cancer Genome Atlas database showed no direct correlation between HER2 and PD-L1 at the messenger RNA level. Trastuzumab-mediated upregulation of PD-L1 through engagement of immune effector cells may function as a potential mechanism of trastuzumab resistance. Our data justify further investigation of the value of adding anti-PD-1 or anti-PD-L1 therapy to trastuzumab-based treatment.

Keywords: Breast cancer; HER2; IFNγ; PD-L1; Trastuzumab.


Conflict of interest statement

Conflict of Interest Statement

The authors declare no conflict of interest related to the contents of this manuscript.

Figures

Fig. 1
Fig. 1
Upregulation of MHC-I, T-cell co-stimulatory molecules, and PD-L1 and downregulation of HER2 by trastuzumab in HER2-overexpressing tumors in vivo. Syngeneic B16-BL6 melanoma cells transduced to overexpress human HER2 were transplanted in hmHER2 transgenic mice. When the tumors became palpable, the mice were treated with 100 μg/mouse of trastuzumab (n=10) or control antibody bevacizumab (n=9) via intraperitoneal injection. The tumors were harvested 48 h after the treatment, and single tumor cell suspensions were prepared and subjected to multicolor flow cytometry analysis after staining or not with fluorescence-labeled anti-human HER2 antibody (A), anti-human IgG antibody (B), anti-mouse H-2Kb or H-2Db antibody (C), anti-mouse CD80 or CD86 antibody (D), or anti-mouse PD-L1 antibody (E). Analyses of the MFI values in (C), (D), and (E) were gated for HER2-positive cells only.
Fig. 2
Fig. 2
Effect of conditioned media from breast cancer cells in monoculture or co-culture with PBMC and treated with trastuzumab or control antibody on PD-L1 level in HER2-overexpressing breast cancer cells. A, The indicated HER2-overexpressing breast cancer cells were treated with trastuzumab (5 μg/ml, equivalent to ~30 nM) or a control IgG (rituximab) in monoculture or co-culture with PBMC (at a cancer cell: PBMC ratio of 1:5) for 48 h. After treatment, cell-free conditioned media from mono-cultures and co-cultures were collected and added into new cultures of the breast cancer cells by mixing the conditioned medium with fresh medium at a 1:1 ratio. After culture for another 48 h, the cells were harvested and stained with APC-conjugated anti-PD-L1 antibody and then subjected to flow cytometry analysis. The MFI values of PD-L1 are shown in bar graphs. The data represent results from two different experiments and donors. * p<0.05. NS, not significant. B, The conditioned media from co-culture with PBMC in (A) were measured for the level of IFNγ using a human IFNγ ELISA kit. *p<0.05 compared with corresponding control.
Fig. 3
Fig. 3
Role of IFNγ in upregulation of PD-L1 by conditioned medium from co-culture of PBMC and HER2-overexpressing breast cancer cells treated with trastuzumab. The indicated HER2-overexpressing breast cancer cells were treated for 48 h with conditioned medium (mixed with fresh medium at a 1:1 ratio) from mono-culture or co-culture as described in Fig. 2 or conditioned medium from co-culture plus an IFNγ-neutralizing antibody (10 μg/ml). The cells were harvested and stained with APC-conjugated anti-PD-L1 antibody and then subjected to flow cytometry analysis. The MFI values of PD-L1 are shown in bar graphs. *p<0.05.
Fig. 4
Fig. 4
Differential effects of IFNγ on PD-L1 and HLA-ABC expression in HER2-overexpressing breast cancer cells. The indicated HER2-overexpressing breast cancer cells were treated for 48 h with recombinant IFNγ (500 units/ml), trastuzumab (5 μg/ml, equivalent to ~30 nM), or both for 48 h. Cells were then double-stained with PE-conjugated anti-PD-L1 antibody and APC-conjugated anti-HLA-ABC antibody and then subjected to multicolor flow cytometry analysis. Left, Contour plots of flow cytometry data of PD-L1 and HLA-ABC expression in the indicated HER2-overexpressing breast cancer cells. Right, MFI values of PD-L1 and HLA-ABC expression from flow cytometry analysis.* p<0.05 compared with corresponding untreated control.
Fig. 5
Fig. 5
Effects of HER2 knockdown and overexpression on PD-L1 expression in respective HER2-overexpressing and low expressing breast cancer cells. A, The indicated HER2-overexpressing breast cancer cells were transfected with one of three different HER2-specific siRNAs or control siRNA. At 72 h after siRNA transfection, the cells were double-stained with APC-conjugated anti-PD-L1 antibody and trastuzumab plus FITC-conjugated anti-human IgG antibody and then subjected to multicolor flow cytometry analysis. Left, Contour plots of flow cytometry data on PD-L1 and HER2 expression in the indicated HER2-overexpressing breast cancer cells with and without HER2 knockdown. Right, MFI values of PD-L1 and HER2 expression from flow cytometry analysis. * p<0.05 compared with corresponding control siRNA-treated cells. B, Left, Contour plots of flow cytometry data of PD-L1 and HER2 expression in MCF7, MCF7-HER2, and HER18 cells. The cells were double-stained with antibodies and subjected to flow cytometry analysis as described in (A). Right, MFI values of PD-L1 and HER2 expression from flow cytometry analysis. * p<0.05 compared with parental MCF7 cells.
Fig. 6
Fig. 6
Effect of HER2 kinase inhibition on PD-L1 expression in HER2-overexpressing breast cancer cells. A, The indicated HER2-overexpressing breast cancer cells were treated with lapatinib (0.5 or 1.0 μM) or vehicle control (DMSO) for 24 h. After treatment, the cells were lysed and subjected to Western blot analysis with the indicated antibodies. B, Cells treated as described in (A) were stained with APC-conjugated anti-PD-L1 antibody and then subjected to flow cytometry analysis. The MFI values of PD-L1 are shown in bar graphs. * p<0.05 compared with vehicle control-treated cells.
Fig. 7
Fig. 7
Correlation analysis of CD274 (PD-L1) and ERBB2 (HER2) expression in breast cancer patient samples available in the TCGA database. A, Left and middle, Spearman correlation analyses of the RNAseq data from TCGA queried for CD274 and ERBB2 in all breast cancer specimens (left panel) and in HER2-overexpressing (HER2 immunohistochemistry score >2+) breast cancer specimens (middle panel). Right, Box-and-whisker plots (ends of whiskers at 10th and 90th percentiles) of CD274 RNAseq data in indicated subgroups. The subgroups were compared using Student’s t-test. *p<0.05, NS, not significant. B, Left and middle, Spearman correlation analyses of the RNAseq data from TCGA queried for CD274 and ERBB2 in HER2-overexpressing (HER2 immunohistochemistry score >2+) breast cancer specimens with wild-type PTEN and wild-type PIK3CA (left panel) and with wild-type PTEN and mutated PIK3CA (middle panel). Right, Box-and-whisker plots (ends of whiskers at 10th and 90th percentiles) of CD274 RNAseq data in indicated subgroups. The subgroups were compared using Student’s t-test. NS, not significant.

References

    1. Hortobagyi GN. Trastuzumab in the treatment of breast cancer. N Engl J Med. 2005;353:1734–1736. - PubMed
    1. Hudis CA. Trastuzumab--mechanism of action and use in clinical practice. N Engl J Med. 2007;357:39–51. - PubMed
    1. Swain SM, Baselga J, Kim SB, Ro J, Semiglazov V, Campone M, Ciruelos E, Ferrero JM, Schneeweiss A, Heeson S, Clark E, Ross G, Benyunes MC, Cortes J. Pertuzumab, trastuzumab, and docetaxel in HER2-positive metastatic breast cancer. N Engl J Med. 2015;372:724–734. - PMC - PubMed
    1. Fabi A, Malaguti P, Vari S, Cognetti F. First-line therapy in HER2 positive metastatic breast cancer: is the mosaic fully completed or are we missing additional pieces? J Exp Clin Cancer Res. 2016;35:104. - PMC - PubMed
    1. Muntasell A, Cabo M, Servitja S, Tusquets I, Martinez-Garcia M, Rovira A, Rojo F, Albanell J, Lopez-Botet M. Interplay between natural killer cells and anti-HER2 antibodies: perspectives for breast cancer immunotherapy. Front Immunol. 2017;8:1544. - PMC - PubMed

Publication types

MeSH terms