. 2018 May 11;360(6389):621-627.
doi: 10.1126/science.aar1965.

Recent Asian origin of chytrid fungi causing global amphibian declines

Affiliations

Recent Asian origin of chytrid fungi causing global amphibian declines

Simon J O'Hanlon et al. Science. .

Abstract

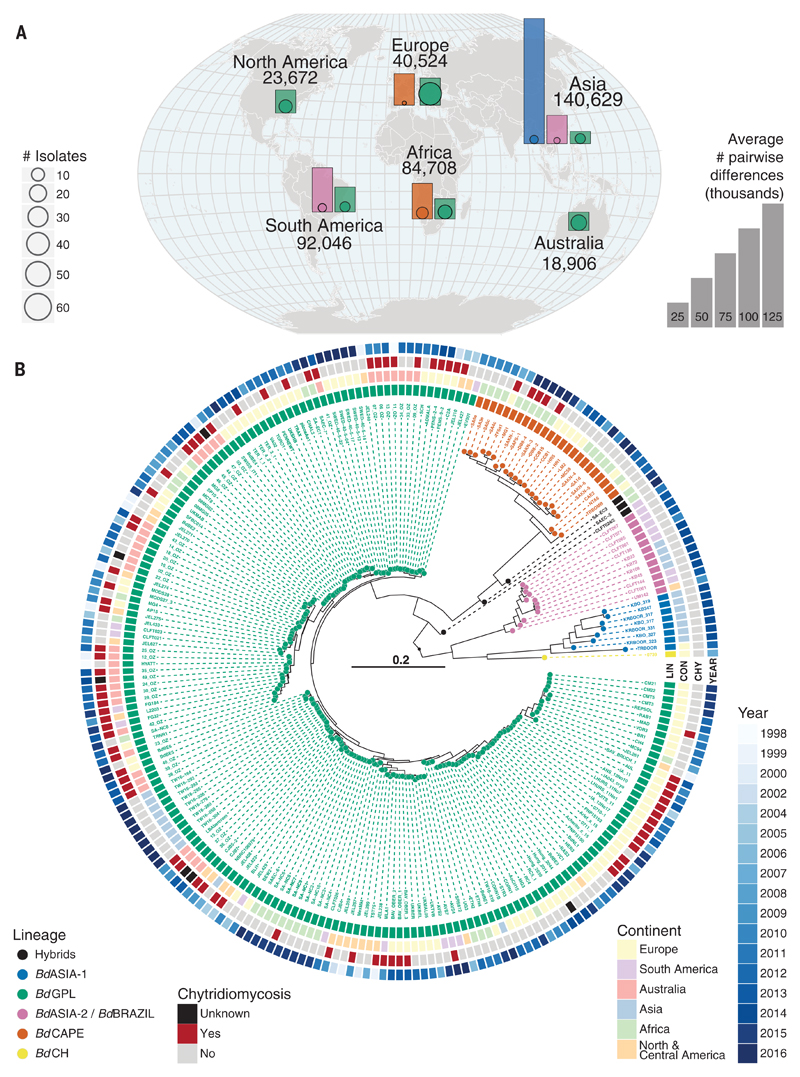
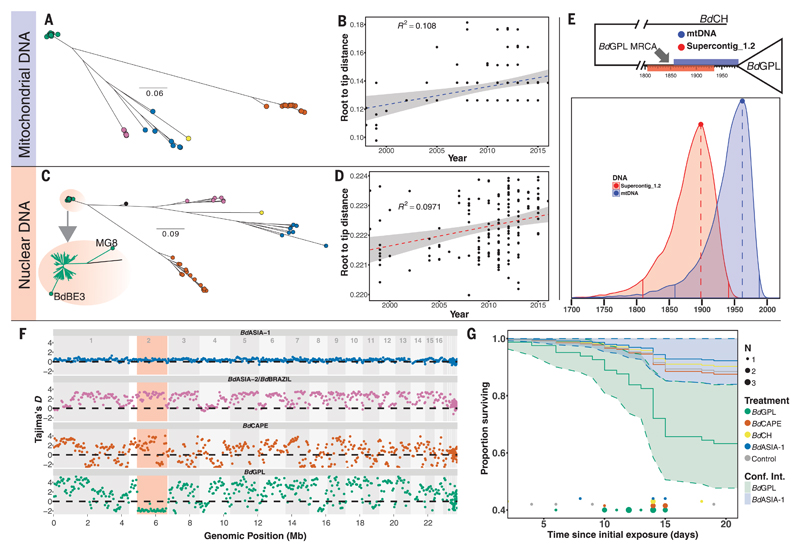
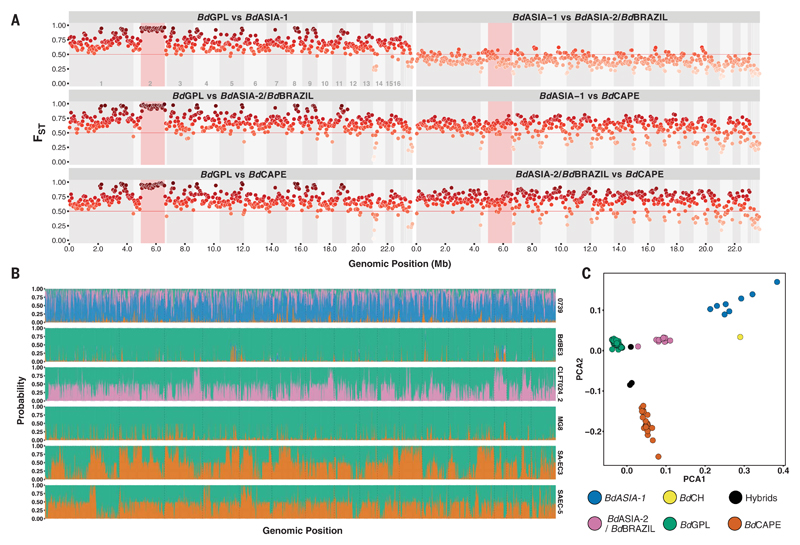
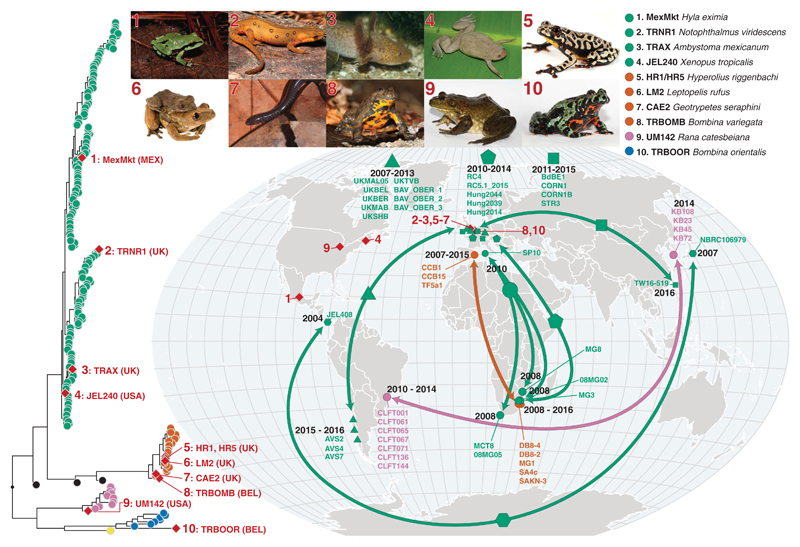
Globalized infectious diseases are causing species declines worldwide, but their source often remains elusive. We used whole-genome sequencing to solve the spatiotemporal origins of the most devastating panzootic to date, caused by the fungus Batrachochytrium dendrobatidis, a proximate driver of global amphibian declines. We traced the source of B. dendrobatidis to the Korean peninsula, where one lineage, BdASIA-1, exhibits the genetic hallmarks of an ancestral population that seeded the panzootic. We date the emergence of this pathogen to the early 20th century, coinciding with the global expansion of commercial trade in amphibians, and we show that intercontinental transmission is ongoing. Our findings point to East Asia as a geographic hotspot for B. dendrobatidis biodiversity and the original source of these lineages that now parasitize amphibians worldwide.


Conflict of interest statement

Competing interests: K.A.M. sits on an expert panel at the European Food Safety Authority addressing the risks of importation and spread of the salamander chytrid Batrachochytrium salamandrivorans, a species of fungus that is the closest known relative to the pathogen addressed in this manuscript.

Figures

Fig. 1
Fig. 1. Genetic diversity and phylogenetic tree of a global panel of 234 B. dendrobatidis isolates.
(A) Map overlaid with bar charts showing the relative diversity of isolates found in each continent and by each major lineage (excluding isolates from traded animals). The bar heights represent the average numbers of segregating sites between all pairwise combinations of isolates of each lineage in each continent (therefore, only lineages with two or more isolates from a continent are shown). Outlined points at the base of each bar are scaled by the number of isolates for each lineage in that continent. The numbers around the outside of the globe are the average number of segregating sites between all pairwise combinations of isolates grouped by continent. Colors denote lineage as shown in (B). (B) Midpoint rooted radial phylogeny supports four deeply diverged lineages of B. dendrobatidis: BdASIA-1, BdASIA-2/BdBRAZIL, BdCAPE, and BdGPL. All major splits within the phylogeny are supported by 100% of 500 bootstrap replicates. See fig. S2 for tree with full bootstrap support values on all internal branches.
Fig. 2
Fig. 2. Dating the emergence of BdGPL.
(A) Maximum likelihood (ML) tree constructed from 1150 high-quality SNPs found within the 178-kbp mitochondrial genome. (B) Linear regression of root-to-tip distance against year of isolation for BdGPL isolates in mitochondrial DNA phylogeny in (A), showing a significant temporal trend (F = 14.35, P = 0.00024). (C) ML tree constructed from a 1.66-Mbp region of low recombination in Supercontig_1.2. Two BdGPL isolates, BdBE3 and MG8, fall on long branches away from the rest of the BdGPL isolates (see inset zoom) as a result of introgression from another lineage (BdCAPE; see Fig. 3B) and were excluded from the dating analysis. (D) Linear regression of root-to-tip distance against year of isolation for BdGPL isolates from phylogeny in (C), with a significant temporal trend (F = 15.92, P = 0.0001). (E) Top: BdGPL and outgroup BdCH, with the 95% HPD estimates for MRCA for BdGPL from mtDNA dating (blue) and nuclear DNA dating (red). Bottom: Full posterior distributions from tip-dating models for mtDNA (blue) and partial nuclear DNA (red) genomes. Solid vertical lines are limits of the 95% HPD. Dashed vertical lines denote the maximal density of the posterior distributions. (F) Sliding 10-kb, nonoverlapping window estimates of Tajima’s D for each of the main B. dendrobatidis lineages. The region highlighted in red is the low-recombination segment of Supercontig_1.2. (G) Survival curves for Bufo bufo metamorphs for different B. dendrobatidis treatment groups: BdASIA-1 (blue), BdCAPE (orange), BdCH (yellow), BdGPL (green), and control (gray). Confidence intervals are shown for BdGPL and BdASIA-1, showing no overlap by the end of the experiment. Instances of mortalities in each treatment group are plotted along the x axis, with points scaled by number of mortalities at each interval (day).
Fig. 3
Fig. 3. FST and site-by-site STRUCTURE analysis.
(A) Non-overlapping 10-kb sliding window of FST between lineages. The region highlighted in red is the Supercontig_1.2:500,000–2,160,000 low-recombination region. (B) Site-by-site analysis of population ancestry for a random selection of 9905 SNPs. Results show those isolates to be either hybrid (SA-EC3, SA-EC5, and CLFT024/2) or with significant introgression from nonparental lineages (isolates BdBE3 and MG8) or a chimera of unsampled diversity, likely originating from East Asia (0739, the BdCH isolate). Each column represents a biallelic SNP position. The columns are colored according to the joint probability of either allele copy arising from one of four distinct populations. Colors represent assumed parental lineages as given in Fig. 3C. (C) Principal components analysis of 3900 SNPs in linkage equilibrium. Each point represents an isolate, colored by phylogenetic lineage. The isolates separate into clearly defined clusters. The axes plot the first and second principal components, PCA1 and PCA2.
Fig. 4
Fig. 4. Genotypes of Bd isolated from infected amphibians in the international trade and phylogenetically linked genotypes from segregated geographic localities.
The red diamonds on the phylogeny indicate isolates recovered from traded animals. Their geographic location is displayed by the red diamonds on the map. The red numbers link each trade isolate to the relevant picture of the donor host species atop the figure and their placement in the phylogeny. The arrows on the map link geographically separated isolates that form closely related phylogenetic clades with high bootstrap support (≥90%). Each clade is denoted by a different-shaped point on the map; names of isolates within each clade are displayed on the map. The dates displayed indicate the sampling time frame for each clade. The phylogenetic position of each clade is displayed in figs. S10 to S14. The colors of points and arrows on the map indicate lineage according to Fig. 1. A browsable version of this phylogeny can be accessed at https://microreact.org/project/GlobalBd. [Photo credits: (1) Hyla eximia, Ricardo Chaparro; (2) Notophthalmus viridescens, Patrick Coin/CC-BY-SA 2.5; (3) Ambystoma mexicanum, Henk Wallays; (4) Xenopus tropicalis, Daniel Portik; (5) Hyperolius riggenbachi and (6) Leptopelis rufus, Brian Freiermuth; (7) Geotrypetes seraphini, Peter Janzen; (8) Bombina variegata, (9) Rana catesbeiana, and (10) Bombina orientalis, Frank Pasmans]

Comment in

References

    1. Fisher MC, et al. Nature. 2012;484:186–194. - PMC - PubMed
    1. Berger L, et al. Proc Natl Acad Sci USA. 1998;95:9031–9036. - PMC - PubMed
    1. Blaustein AR, Wake DB. Trends Ecol Evol. 1990;5:203–204.
    1. Skerratt LF, et al. EcoHealth. 2007;4:125–134.
    1. Cheng TL, Rovito SM, Wake DB, Vredenburg VT. Proc Natl Acad Sci USA. 2011;108:9502–9507. - PMC - PubMed

Publication types

LinkOut - more resources