. 2018 May 11;360(6389):664-669.
doi: 10.1126/science.aar1999.

Structural basis for recognition of frizzled proteins by Clostridium difficile toxin B

Affiliations

Structural basis for recognition of frizzled proteins by Clostridium difficile toxin B

Peng Chen et al. Science. .

Abstract

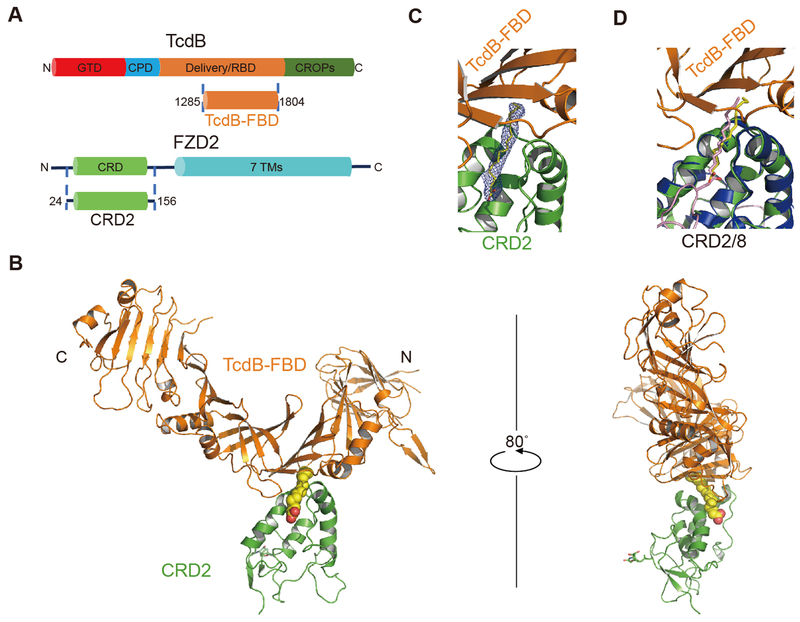
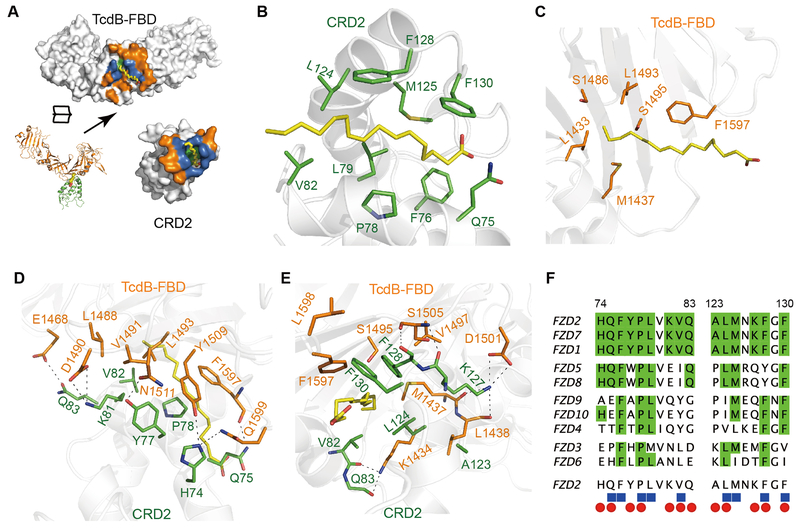
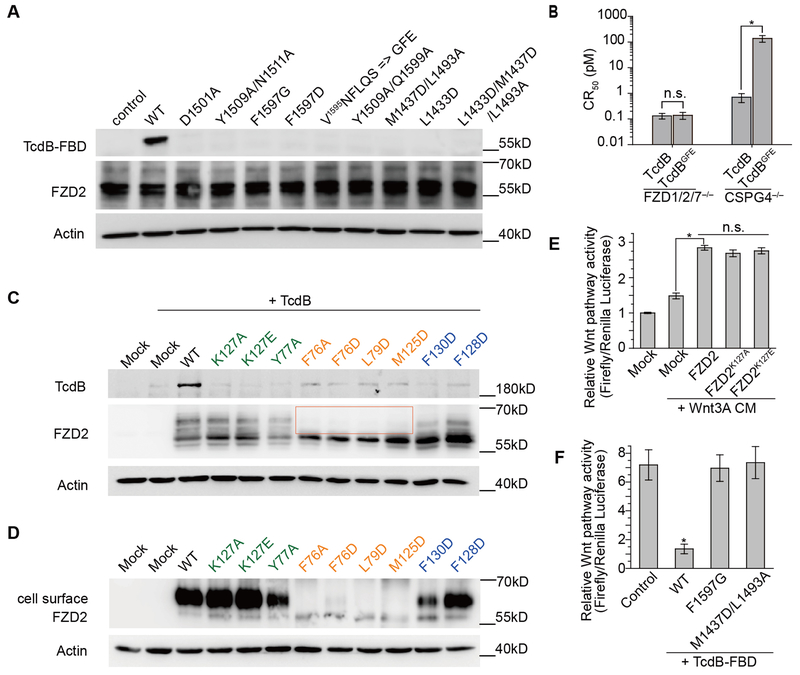
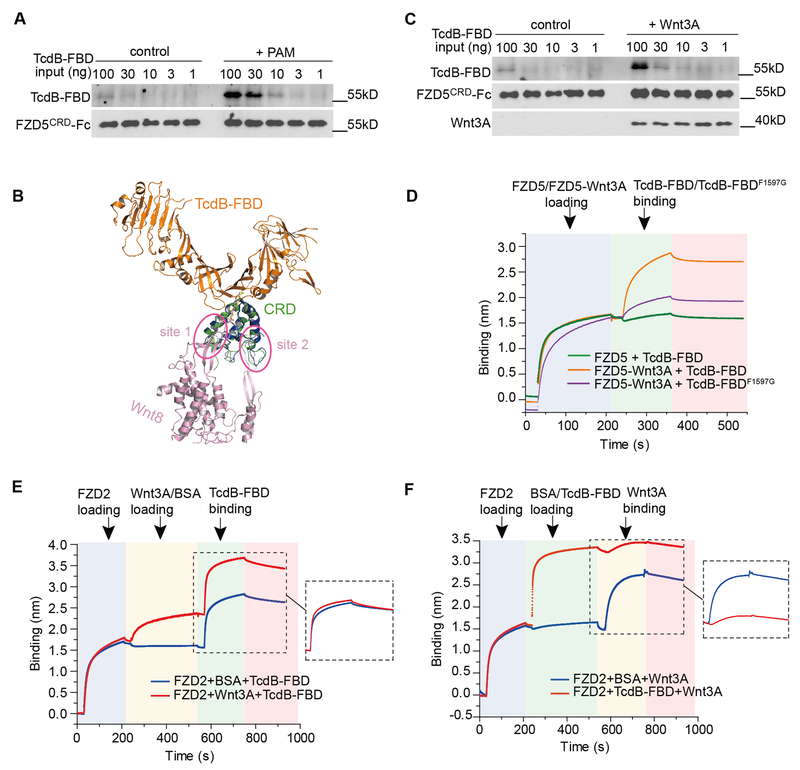
Clostridium difficile infection is the most common cause of antibiotic-associated diarrhea in developed countries. The major virulence factor, C. difficile toxin B (TcdB), targets colonic epithelia by binding to the frizzled (FZD) family of Wnt receptors, but how TcdB recognizes FZDs is unclear. Here, we present the crystal structure of a TcdB fragment in complex with the cysteine-rich domain of human FZD2 at 2.5-angstrom resolution, which reveals an endogenous FZD-bound fatty acid acting as a co-receptor for TcdB binding. This lipid occupies the binding site for Wnt-adducted palmitoleic acid in FZDs. TcdB binding locks the lipid in place, preventing Wnt from engaging FZDs and signaling. Our findings establish a central role of fatty acids in FZD-mediated TcdB pathogenesis and suggest strategies to modulate Wnt signaling.


Figures

Fig. 1.
Fig. 1.. Overall structure of TcdB-FBD in complex with CRD2.
(A) Schematic diagrams showing the domain structures of TcdB and FZD2, as well as the two interacting fragments used in this study. GTD: glucosyltransferase domain; CPD: cysteine protease domain; Delivery/RBD: delivery and receptor-binding domain; CROPs: combined repetitive oligopeptides domain; CRD: cysteine-rich domain; 7TMs: 7 transmembrane helices. (B) Cartoon representation of the complex with TcdB-FBD in orange, CRD2 in green, and PAM in a yellow sphere model. An N-acetyl glucosamine (NAG) due to N-linked glycosylation on CRD2-N53 is shown as sticks. (C) Electron density of the PAM bound between TcdB-FBD and CRD2. An omit electron density map contoured at 2.5 σ was overlaid with the final refined model. (D) The PAM molecules bound in the TcdB-FBD-CRD2 and the Wnt8-CRD8 (Wnt8 and CRD8 are colored purple and blue, respectively) complexes are shown as yellow and purple sticks, respectively, when the two complexes are superimposed based on CRD2 and CRD8.
Fig. 2.
Fig. 2.. TcdB-FBD recognizes CRD2 through combined fatty acid- and protein-mediated interactions.
(A) An open-book view of the TcdB-FBD-CRD2 interface. Residues that participate in protein-protein, protein-lipid, or both are colored orange, green, and blue, respectively. (B and C) A PAM molecule simultaneously interacts with CRD2 (B) and TcdB-FBD (C). Key PAM-binding residues and PAM are shown as stick models. (D and E) Two neighboring protein-mediated interfaces between TcdB-FBD and CRD2, which surround the lipid-binding groove in CRD2. (F) Amino acid sequence alignment among the ten human FZDs within the TcdB-FBD-interacting region. Invariable residues are colored green. CRD2 residues that bind to PAM and TcdB-FBD are labeled as blue cubes and red ovals, respectively.
Fig. 3.
Fig. 3.. Structure-based mutagenesis analyses of the interactions between TcdB and FZD2.
(A) Mutations in TcdB-FBD that disrupt its interactions with PAM and/or CRD2 impaired TcdB-FBD (50 nM) binding to HeLa cells overexpressing FZD2. (B) The sensitivity of FZD1/2/7 triple KO HeLa cells and CSPG4 KO HeLa cells to full length WT TcdB and TcdBGFE was determined by cell-rounding assays. CR50 is defined as the toxin concentration that induces 50% of cells to become round in 24 hours. (C) When expressed in HeLa cells, WT FZD2 but not the mutated variants mediated robust binding of full-length TcdB (10 nM) on cell surfaces. Mutations in CRD2 that are located in the protein-protein interface with TcdB, in the core lipid-binding groove, or at the edge of the lipid-binding groove are marked in green, orange, and blue, respectively. Four FZD2 variants lacking detectable levels of glycosylation are highlighted in a box. (D) These four FZD2 variants failed to reach cell surfaces as examined by detecting biotinylated FZD2 on cell surfaces. (E) FZD2-K127A/E were capable of mediating Wnt signaling to a level similar to WT FZD2. (F) WT TcdB-FBD, but not the mutated variants (F1597G and M1437D/L1493A), inhibited signaling by Wnt3A CM in HEK293T cells as measured by the TOPFLASH reporter assay. Data are mean ± s.d., n=6, *p<0.01, Mann-Whitney Test (B and F) or Kruskal-Wallis ANOVA (E).
Fig. 4.
Fig. 4.. A free fatty acid facilitates binding of TcdB to FZD-CRDs, which in turn prevents docking of the Wnt PAM.
(A) Pre-loading FZD5-CRD with PAM enhanced its binding to TcdB-FBD based on pull-down assays. (B) Superimposed structures of the TcdB-FBD-CRD2 and the Wnt8-CRD8 complexes. The two distinct interfaces between Wnt8 (purple) and CRD8 (blue) are highlighted in circles (site 1 & 2). (C and D) Pre-loading Wnt3A to FZD5-CRD enhanced its binding to TcdB-FBD based on pull-down assays (C) and BLI assays (D). The enhancement was minimal for TcdB-FBD-F1597G. Sequential loading of different proteins to the biosensor and binding dissociation are indicated by different background colors. (E) Pre-loading Wnt3A to CRD2 did not interfere with subsequent binding of TcdB-FBD. (F) Pre-loading CRD2 with TcdB-FBD impeded subsequent binding of Wnt3A.
Fig. 5.
Fig. 5.. FZDs and the FZD-bound fatty acids are the major pathologically relevant receptors for TcdB in the colonic tissues.
(A) WT TcdB (15 μg), TcdBGFE (15 μg) or the saline control was injected into the cecum of WT mice in vivo. The cecum tissues were harvested 12 hours later. The representative cecum tissues were shown, and the weight of each cecum was measured and plotted. (Boxes represent mean ± standard error of the mean, s.e.m.), and the bars represent s.d., Mann-Whitney). (B, C) Cecum tissue sections were subjected to hematoxylin and eosin (H&E) staining. The representative images were shown in panel B. The histological scores (panel C) were assessed based on disruption of the epithelia, hemorrhagic congestion, mucosal edema, and inflammatory cell infiltration. (Data are mean ± s.d., Mann-Whitney). Scale bar, 100 μm. (D) Immunofluorescent staining of epithelial cell junction marker Claudin-3 (green) in ceca from mice injected with saline, TcdB, or TcdBGFE (blue indicates cell nuclei). Scale bar, 50 μm.

References

    1. Rupnik M, Wilcox MH, Gerding DN, Nat Rev Microbiol 7, 526–536 (2009). - PubMed
    1. Heinlen L, Ballard JD, Am J Med Sci 340, 247–252 (2010). - PMC - PubMed
    1. Voth DE, Ballard JD, Clin Microbiol Rev 18, 247–263 (2005). - PMC - PubMed
    1. Hunt JJ, Ballard JD, Microbiol Mol Biol Rev 77, 567–581 (2013). - PMC - PubMed
    1. Smits WK, Lyras D, Lacy DB, Wilcox MH, Kuijper EJ, Nat Rev Dis Primers 2, 16020 (2016). - PMC - PubMed

Publication types

MeSH terms