. 2018 Aug;37(33):4581-4598.
doi: 10.1038/s41388-018-0284-2. Epub 2018 May 11.

Proteomic profiling identifies key coactivators utilized by mutant ERα proteins as potential new therapeutic targets

Affiliations

Proteomic profiling identifies key coactivators utilized by mutant ERα proteins as potential new therapeutic targets

Leah A Gates et al. Oncogene. 2018 Aug.

Abstract

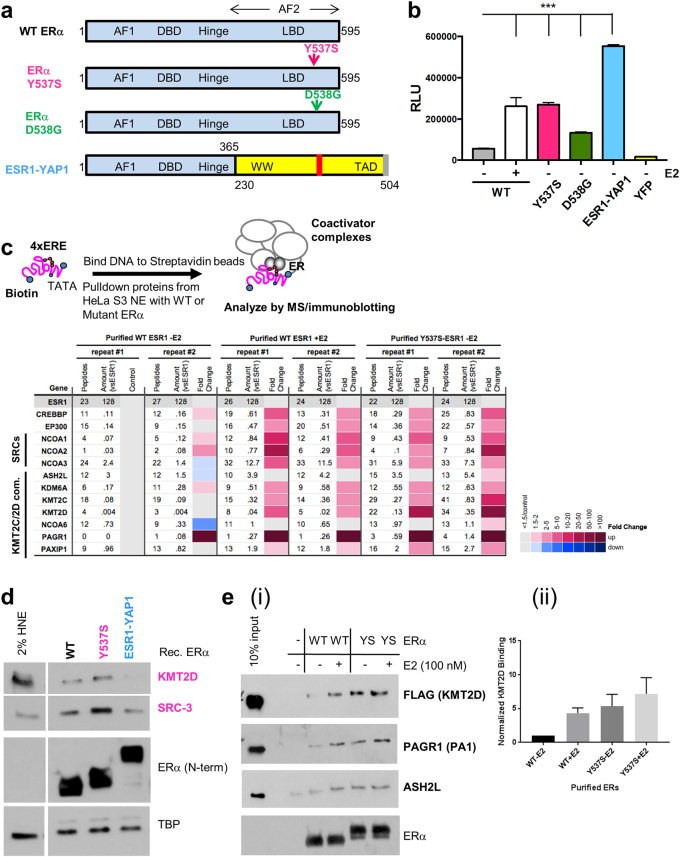
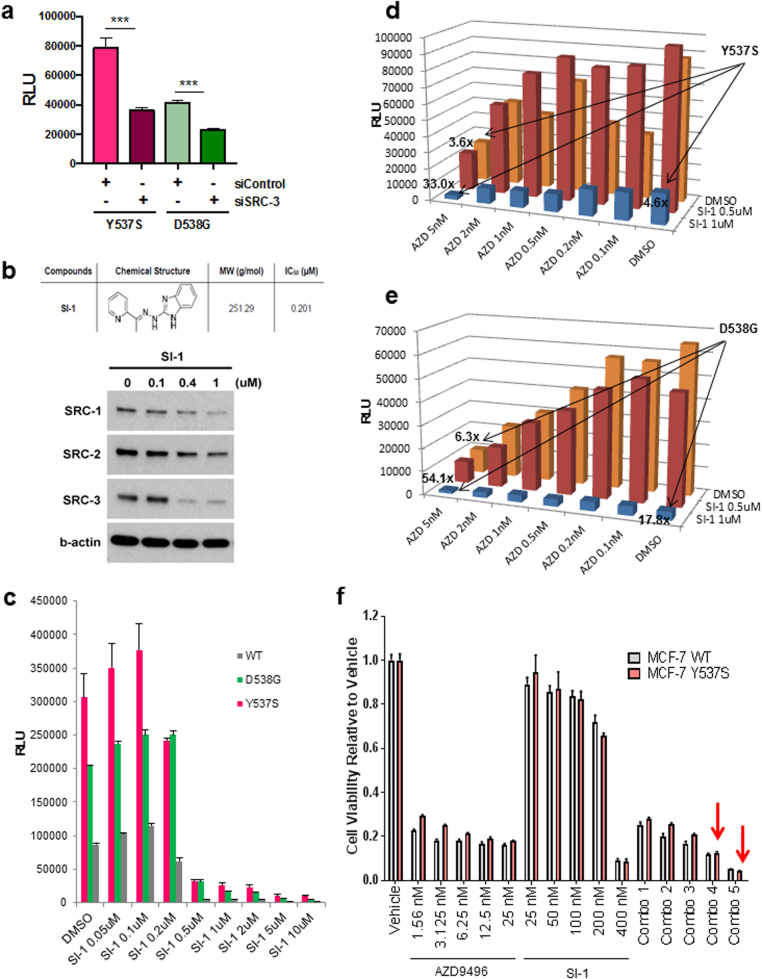
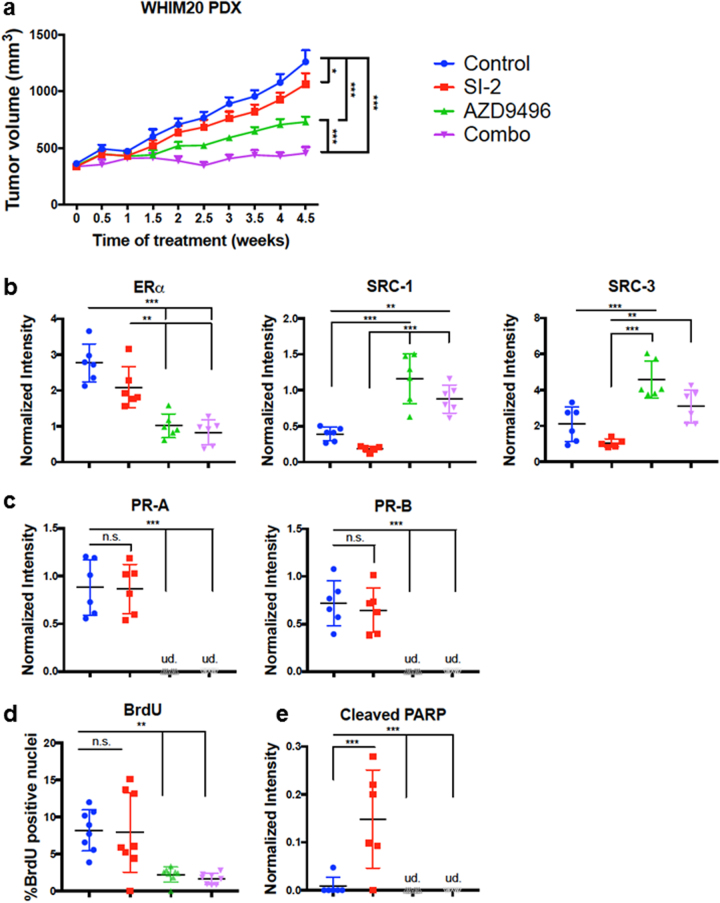
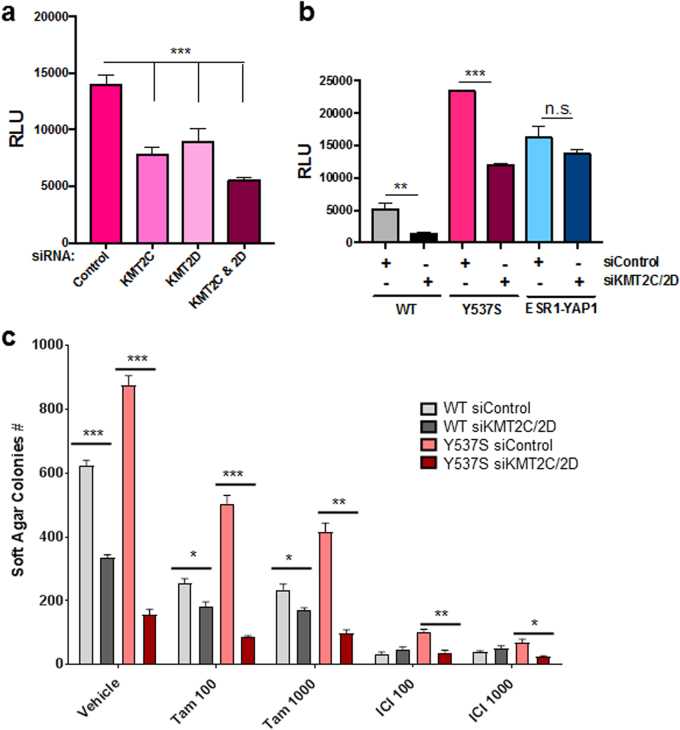
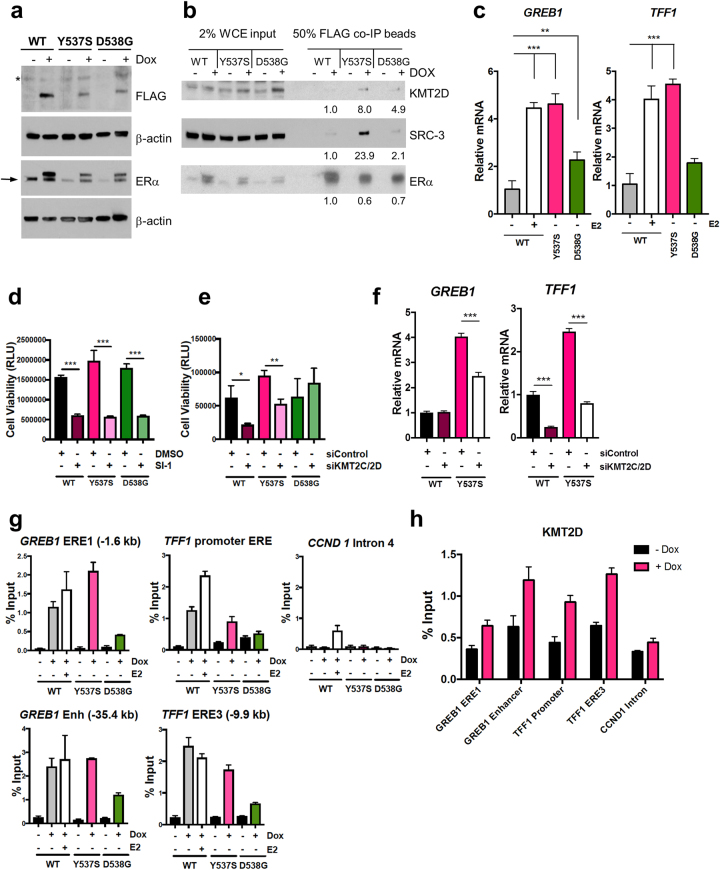
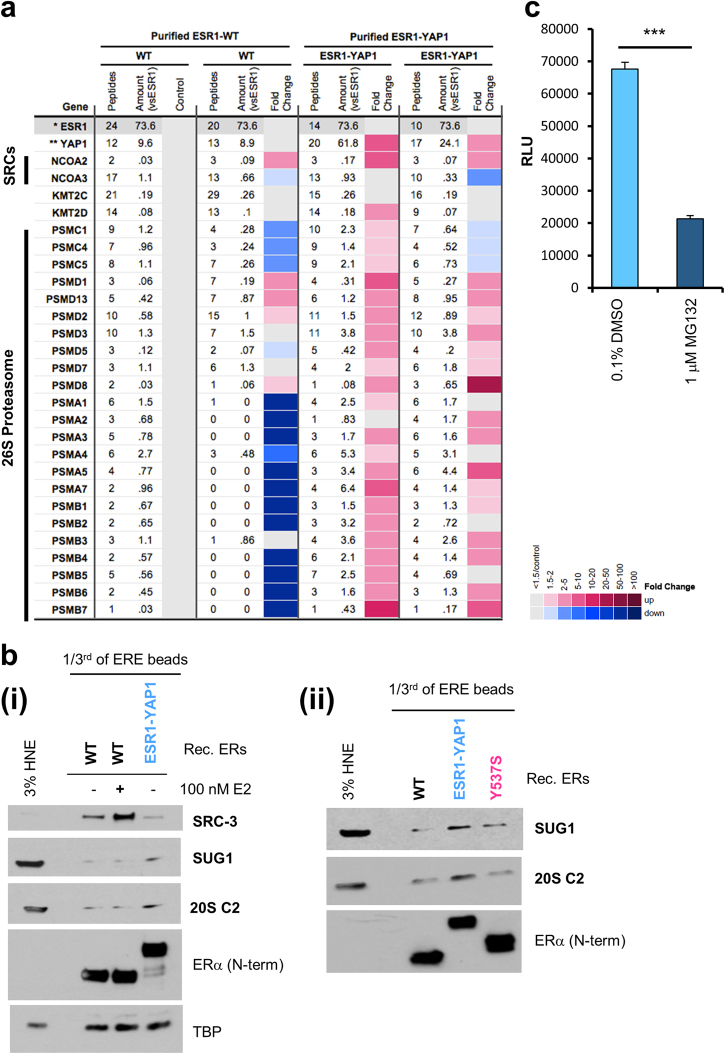
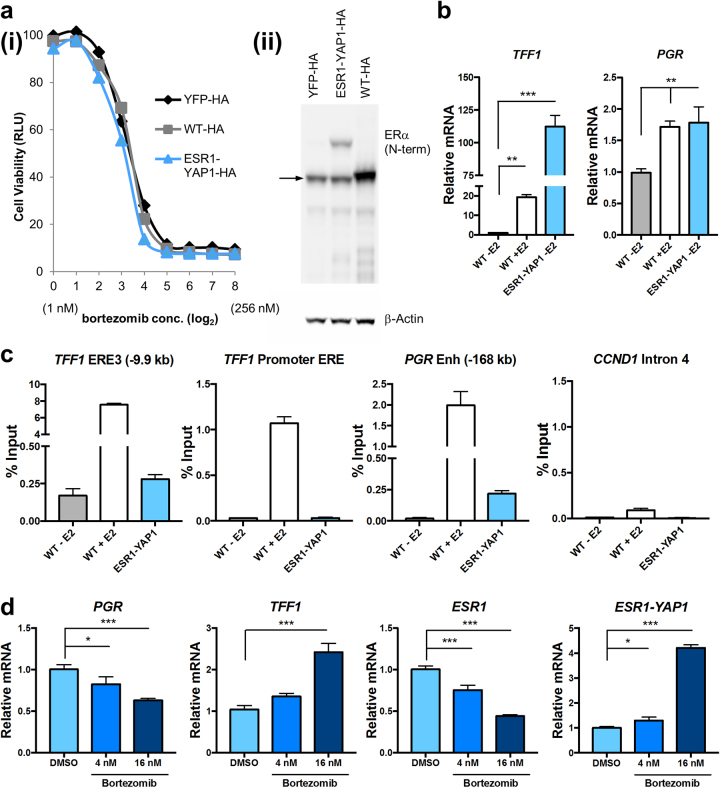
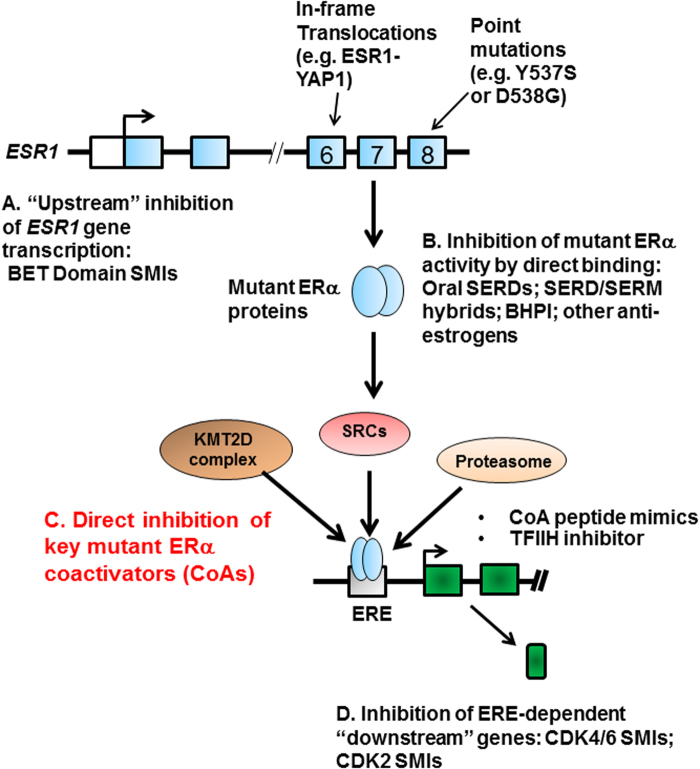
Approximately 75% of breast cancers are estrogen receptor alpha (ERα)-positive and are treatable with endocrine therapies, but often patients develop lethal resistant disease. Frequent mutations (10-40%) in the ligand-binding domain (LBD) codons in the gene encoding ERα (ESR1) have been identified, resulting in ligand-independent, constitutively active receptors. In addition, ESR1 chromosomal translocations can occur, resulting in fusion proteins that lack the LBD and are entirely unresponsive to all endocrine treatments. Thus, identifying coactivators that bind to these mutant ERα proteins may offer new therapeutic targets for endocrine-resistant cancer. To define coactivator candidate targets, a proteomics approach was performed profiling proteins recruited to the two most common ERα LBD mutants, Y537S and D538G, and an ESR1-YAP1 fusion protein. These mutants displayed enhanced coactivator interactions as compared to unliganded wild-type ERα. Inhibition of these coactivators decreased the ability of ESR1 mutants to activate transcription and promote breast cancer growth in vitro and in vivo. Thus, we have identified specific coactivators that may be useful as targets for endocrine-resistant breast cancers.


Conflict of interest statement

B.W.O., D.M.L., J.W., A.D.R., Y.Y., and C.E.F. disclose an equity position in Coactigon, Inc.; M.J.E. received a consulting fee from AstraZeneca.

Figures

Fig. 1
Fig. 1
Proteomics of co-regulators recruited to the Y537S ERα LBD point mutant. a Schematic diagram of WT, Y537S, and D538G ERα point mutants (mutations indicated by arrows), and the ESR1-YAP1 fusion protein. Numbers refer to amino-acid residues in ERα and YAP1. AF1 activation function 1, DBD DNA-binding domain. Hinge, region between DBD and ligand-binding domain (LBD); AF2 Activation function 2, WW WW domain, TAD transcription activation domain. In ESR1-YAP1, blue represents ERα residues (1–365); yellow indicates YAP1 residues (230–504). b Mutant ERα proteins display E2-independent transcriptional activity. Vectors expressing YFP or YFP-tagged WT, Y537S, D538G, or ESR1-YAP1 proteins were co-expressed with an ERE-dependent luciferase reporter (pERE-E1b-luc) in HeLa cells grown in charcoal-stripped fetal bovine serum (FBS). Cells were then treated with/without 10 nM E2 for overnight. Luciferase activity (RLU relative light units) was assayed from whole-cell extracts of the cells transfected in triplicate. Data are represented as mean ± SEM (n = 3); ***p < 0.001. c MS data depicted as a heatmap for WT or Y537S ERα-dependent coactivators recruited to EREs. (Top) Schematic of ERE DNA pulldown assay using HeLa S3 NE as the source of co-regulators (modified from ref. [21]) and purified ERα proteins. (Bottom) MS data were analyzed from duplicate reactions using a label-free method and depicted as in ref. [21]. Peptides number of peptides detected; amount (vsESR1) amount normalized by sum of area under the curve for six N-terminal ESR1 peptides (see Supplementary Table 2). Fold change represents the ratio of amount detected normalized to unliganded WT ERα. Fold change cutoff used was ≥1.5. SRC-1 to -3 (gene symbols: NCOA1, NCOA2, NCOA3), p300 (gene symbol: EP300), CBP (gene symbol: CREBBP). d Immunoblotting validation of KMT2D and SRC-3 enrichment with purified Y537S ERα bound to EREs using independent DNA pulldown samples in the absence of E2. ERα protein binding was assayed by an N-terminal (N-term) antibody. TBP serves as a loading control. 2% input represents 2% of the starting HNE employed in the ERE DNA pulldown. e Y537S ERα and the KMT2D complex interact directly in an enhanced manner relative to unliganded WT ERα. ERE DNA pulldown assays were performed with purified ERα proteins and a purified KMT2D “fusion” complex [22], and then analyzed by immunoblotting. (i) Representative immunoblot probing for select KMT2D complex members and ERα. (ii) Quantification of KMT2D signal across three independent pulldown assays. Binding was quantified using Image J and normalized to ERα signal
Fig. 2
Fig. 2
SRCs are key co-regulators of WT, Y537S, and D538G ERα transcriptional activity and are essential for breast cancer cell growth. a Knockdown of SRC-3 by co-transfection of HeLa cells with an siRNA targeting pool reduced transcriptional activity of LBD point mutant ERα proteins, as assayed by an ERE-luciferase reporter, in hormone-depleted media. Data are represented as mean ± SEM (n = 3); ***p < 0.001. RLU relative light units. b A “pan-SRC” inhibitor, SI-1, reduced all three SRC protein levels in MCF-7 breast cancer cells treated overnight, as assayed by immunoblotting. β-actin serves as a loading control. c SRC inhibitor SI-1 reduced WT, Y537S, and D538G ERα transcriptional activity at concentrations higher than the established IC50. Vectors expressing YFP-tagged WT, Y537S, and D538G ERα proteins were co-expressed with pERE-E1b-luc in HeLa cells, and then cells were treated with dimethyl sulphoxide (DMSO, vehicle control) or SI-1 overnight. Luciferase activity was measured as in Fig. 1b. Data are represented as mean ± SEM (n = 3). d,e Combination of an SRC inhibitor (SI-1) and an oral SERD (AZD9496) synergistically reduce Y537S (d) and D538G (e) mutant ERα transcriptional activity. Experiment was done as in (c), except that AZD9496 was added with or without SI-1 to co-transfected HeLa cells. Data are represented as mean (n = 3). f The oral SERD AZD9496 is more effective than the SRC inhibitor SI-1 in reducing cell viability of MCF-7 lines expressing WT or Y537S ERα. The lentiviral transduced MCF-7 stably expressing cell lines were treated with vehicle (DMSO) or different concentrations of AZD9496 or SI-1 as indicated. After 6 days of treatment, viability was assayed by a MTT assay. Data are represented as mean ± SEM (n = 3). Synergism was observed with combination (Combo) treatments 4 and 5 (12.5/200 nM AZD9496/SI-1; 25/400 nM AZD9496/SI-1) in Y537S ERα-expressing cells (shown as red arrows; CI values are shown in Supplementary Table 5)
Fig. 3
Fig. 3
Inhibition of SRCs and ERα reduces tumor burden in a PDX model of Y537S ERα breast cancer. Significance was determined using one-way ANOVA and Tukey’s test to correct for multiple comparisons. *p < 0.05; **p < 0.01; ***p < 0.001. a Tumor volume (n = 8) is reduced with treatment of either SI-2 or AZD9496, and further reduced upon treatment with a combination of both inhibitors. Data are represented as mean ± SEM. b–e Quantification of tumor immunoblotting (n = 6/treatment) performed with Image J analysis relative to GAPDH expression or imaging data (n = 8) unless otherwise indicated. Data are represented as mean ± SD. ud undetected. Color legend is the same as in (a). b Quantification of ERα, SRC-1, and SRC-3 protein expression across tumors. By Dixon’s Q test, the tumor samples in the last lane probed for SRC-1 and SRC-3 (Supplementary Figure 4a) were outliers at 99% confidence and thus excluded from the Image J analysis. c The ERα target gene PR displays reduced expression with AZD9496 and combination treatment. d BrdU is decreased in the AZD9496 and combination therapy groups (n = 8 mice per group, with mean ± SD of three slides for each mouse counted). e Cleaved PARP is increased with SI-1 treatment and decreased with AZD9496 and combination therapies
Fig. 4
Fig. 4
Knockdown of KMT2C/2D reduces WT and Y537S ERα transcriptional activity and breast cancer cell growth. a HeLa cells grown in phenol red-free, charcoal-stripped media were co-transfected with pERE-E1b-luc, YFP-tagged Y537S ERα, and different siRNAs (25 nM each for 50 nM total). Cell lysates were assayed for luciferase activity (RLU). Data are represented as mean ± SEM (n = 3); ***p < 0.001. NC#1 siRNA served as the negative control for KMT2D targeting siRNA, while Control-A siRNA pool served as the negative control for KMT2C targeting siRNA pool. b Transfection of siRNAs targeting KMT2C and KMT2D reduced expression of the pERE-E1b-luc reporter, as compared to non-targeting siRNAs (siControl), in HeLa cells co-transfected with YFP-tagged WT or Y537S ERα vectors, but not an YFP-tagged ESR1-YAP1 fusion. Luciferase activity was measured as in Fig. 1b. Data are represented as mean ± SEM (n = 3); **p < 0.01; ***p < 0.001. c Knockdown of KMT2C and KMT2D in lentiviral transduced stably expressing WT or Y537S MCF-7 cells results in reduced anchorage-independent growth in soft agar and confers sensitivity to anti-estrogens. siRNAs (same as above) were transfected into the two cell lines at a final concentration of 100 nM (50 nM each), and then re-plated in 24 well plates 24 h later. After 1 week with either vehicle or anti-estrogen (100 or 1000 nM 4-hydroxytamoxifen (Tam) or ICI) treatment, colonies formed in soft agar were counted and quantified. Data are represented as mean ± SEM (n = 4); *p < 0.05; **p < 0.01; ***p < 0.001
Fig. 5
Fig. 5
SRCs and KMT2C/2D promote cell growth and transcription of ERE-containing target genes in conditionally expressed (Dox-inducible) WT and mutant ERα MCF-7 cell lines. Prior to all assays, cell lines were grown in charcoal-stripped, phenol red-free media with/without Dox for at least 2 days. a Confirmation of FLAG-tagged WT, Y537S, and D538G ERα Dox-inducible expression in MCF-7 cells transduced with specific lentiviruses. Immunoblotting was performed on whole-cell extracts with FLAG, ERα (HC-20 antibody), or β-actin (loading control) antibodies. *, Nonspecific band. →, Position of endogenous ERα. b KMT2D and SRC-3 co-immunoprecipitate with mutant ERα. Whole-cell extracts from Dox-inducible MCF-7 cells were subject to immunoprecipitation of FLAG, followed by immunoblotting. For analysis, intensities were normalized for different precipitated ERα levels by Image J. c Dox-inducible expression of Y537S and D538G ERα in MCF-7 cells results in activation of two canonical ERα target genes independent of E2. Cell lines were treated with Dox and the WT ERα line was treated (±) 10 nM E2 overnight, followed by RNA isolation. Relative levels of GREB1 or TFF1 mRNAs were determined by RT-qPCR with ESR1 mRNA as the normalizer. Data are represented as mean ± SEM (n = 3); **p < 0.01; ***p < 0.001. d, e Cell viability (measured by Cell Titer Glo as RLU) of Dox-inducible WT, Y537S, and D538G ERα expressing MCF-7 lines (induced as above). *p < 0.05; **p < 0.01; ***p < 0.001. d Cell viability is reduced in all three cell lines upon treatment with SRC inhibitor SI-1 (1 μM) after 3 days' exposure. DMSO served as the vehicle control. Data are represented as mean ± SEM (n = 3). e Cell viability of Dox-inducible WT and Y537S ERα-expressing MCF-7 lines, but not the D538G-expressing ERα line, is reduced upon knockdown of KMT2C and KMT2D after 3 days exposure to 100 nM total siRNA (50 nM each). Data are represented as mean ± SEM (n = 3). f Knockdown of KMT2C and KMT2D reduces Y537S ERα-enhanced expression of GREB1 and TFF1. Cells were transfected with siRNAs (100 nM total, 50 nM each). Relative levels of GREB1 or TFF1 mRNAs were determined by RT-qPCR using ACTB mRNA as the normalizer. Data are represented as mean ± SEM (n = 3); *p < 0.05; **p < 0.01; ***, p < 0.001. g Dox-induced FLAG-tagged WT, Y537S, and D538G ERα proteins occupy EREs of GREB1 and TFF1 genes in MCF-7 cells, implying direct transcriptional regulation. In contrast, ERα proteins minimally occupy a negative control region from intron 4 of the CCND1 gene, which lacks endogenous ERα binding [36]. Where indicated, WT ERα cells were treated with 100 nM E2 for 45 min. ChIP assays employed an antibody against FLAG to IP the FLAG-tagged ERα proteins and associated DNA. Isolated DNA was assayed by ChIP-qPCR. Representative data were plotted relative to percentage of starting input chromatin and are represented as mean of triplicate qPCR reactions ± SEM. Supplementary Figure 7d shows a repeated ChIP assay. h KMT2D occupies EREs of GREB1 and TFF1 genes in a Dox-dependent manner correlating with increased Y537S ERα occupancy. ChIP-qPCR was performed using an antibody to KMT2D. Representative data were plotted as above and the CCND1 gene intron 4 served as a negative control region. Supplementary Figure 7e shows a repeated ChIP assay
Fig. 6
Fig. 6
The ESR1-YAP1 fusion protein recruits the 26S proteasome for activated transcription of an ERE-driven luciferase reporter. a MS data depicted as a heatmap (displayed as in Fig. 1c) for ESR1-YAP1-dependent coactivators recruited to EREs from HNE. Recombinant purified WT or ESR1-YAP1 proteins were added to duplicate ERE DNA pulldown reactions. Fold change cutoff was ≥1.5 for enrichment over unliganded WT ERα. *ESR1 normalized ESR1 (see Supplementary Table 2). **YAP1 YAP1 corrected for ESR1. b Immunoblotting validation of the 26S proteasome being recruited to ESR1-YAP1. Independent ERE DNA pulldown samples were used to detect proteins recruited to ESR1-YAP1 compared to WT with/without E2 (i) or compared to WT or Y537S ERα (ii). Levels of ERα bound to the EREs were determined with an ERα antibody recognizing an N-terminal (N-term) epitope. TBP served as a loading control. 3% HNE, 3% of the starting HeLa S3 NE employed in the ERE DNA pulldown. c A 26S proteasome inhibitor, MG132, reduces ESR1-YAP1 transcriptional activity on an ERE-driven luciferase reporter. HeLa cells grown in phenol red-free, charcoal-stripped media were co-transfected with a vector expressing YFP-tagged ESR1-YAP1 protein and pERE-E1b-luc. Cells were then treated with vehicle (0.1% DMSO) or 1 μM MG132 for overnight. Luciferase activity (RLU relative light units) was assayed from whole-cell lysates. Data are represented as mean ± SEM (n = 3); ***p < 0.001
Fig. 7
Fig. 7
Proteasome inhibition reduces viability of breast cancer cells expressing the ESR1-YAP1 fusion and modulates ESR1-YAP1 target gene expression. T47D cell lines expressing these constructs were grown in phenol red-free, charcoal-stripped media for at least 2 days. a Increasing concentrations of bortezomib reduce cell viability of HA epitope-tagged YFP, WT ERα, and ESR1-YAP1 stably expressing T47D cell lines. (i) Cell viability was measured (via Cell Titer Glo as RLU) after 3 days of bortezomib or vehicle (DMSO) treatments. Data are represented as mean ± SEM (n = 3). (ii) Expression levels of ERα proteins were assayed in whole-cell extracts made from HA-tagged YFP, WT ERα, and ESR1-YAP1 expressing T47D cell lines. The N-terminal ERα antibody was used to detect endogenous ERα (denoted by →) as well as the ESR1-YAP1 fusion. β-actin served as a loading control. b Expression of HA-tagged ESR1-YAP1 activates expression of two classical ERE-containing target genes as compared to E2-deprived HA-tagged WT ERα. WT ERα-expressing cells were treated with/without 10 nM E2 for 24 h. Relative levels of TFF1 or PGR mRNAs were determined by RT-qPCR using ACTB mRNA as the normalizer. Data are represented as mean ± SEM (n = 3); **p < 0.01; ***p < 0.001. c ESR1-YAP1 directly occupies certain EREs of the TFF1 and PGR genes. Where indicated, HA-tagged WT ERα cells were treated with 100 nM E2 for 45 min before ChIP assays. ChIP-qPCR assays employed an antibody against HA to IP the HA-tagged ERα proteins and associated DNA. Representative data were plotted relative to percentage of starting input chromatin, which was represented as the mean of triplicate qPCR reactions ± SEM. CCND1 gene intron 4 served as a negative control region. Supplementary Figure 8d shows a repeated ChIP assay. d Proteasome inhibitor treatment of T47D cells expressing HA-tagged ESR1-YAP1 modulates ERE-containing target gene expression. Cells were treated with vehicle (0.1% DMSO) or 4 or 16 nM bortezomib for 17 h. Relative levels of PGR, TFF1, ESR1, or ESR1-YAP1 mRNAs were determined by RT-qPCR using GAPDH mRNA as the normalizer. Data are represented as mean ± SEM (n = 3); *p < 0.05; ***p < 0.001
Fig. 8
Fig. 8
Potential ways to inhibit mutant ERα-driven breast cancer cell growth. In metastatic breast cancer, the ESR1 gene encoding ERα is mutated in exon 6 (by translocations creating in-frame fusion proteins such as ESR1-YAP1) or in exon 8 (by point mutation in the LBD creating Y537S or D538G ERα mutants). While other laboratories have published pharmacological inhibitor strategies for reducing ESR1 mutant gene transcription (a), for inhibiting the LBD mutant ERα proteins directly (b), and for inhibiting downstream gene products whose expression is driven by LBD mutant ERα proteins (d), we propose that inhibition of key mutant ERα coactivators, such as KMT2C/2D, SRC coactivators, and the proteasome, is a new therapeutic approach for inhibiting mutant ERα-driven breast cancer cell growth (c). See also Discussion

References

    1. Osborne CK, Schiff R. Mechanisms of endocrine resistance in breast cancer. Annu Rev Med. 2011;62:233–47. doi: 10.1146/annurev-med-070909-182917. - DOI - PMC - PubMed
    1. Massarweh S, Schiff R. Unraveling the mechanisms of endocrine resistance in breast cancer: new therapeutic opportunities. Clin Cancer Res. 2007;13:1950–4. doi: 10.1158/1078-0432.CCR-06-2540. - DOI - PubMed
    1. Van Asten K, Neven P, Lintermans A, Wildiers H, Paridaens R. Aromatase inhibitors in the breast cancer clinic: focus on exemestane. Endocr Relat Cancer. 2014;21:R31–49. doi: 10.1530/ERC-13-0269. - DOI - PubMed
    1. Ciruelos E, Pascual T, Arroyo Vozmediano ML, Blanco M, Manso L, Parrilla L, et al. The therapeutic role of fulvestrant in the management of patients with hormone receptor-positive breast cancer. Breast. 2014;23:201–8. doi: 10.1016/j.breast.2014.01.016. - DOI - PubMed
    1. Johnson AB, O’Malley BW. Steroid receptor coactivators 1, 2, and 3: Critical regulators of nuclear receptor activity and steroid receptor modulator (SRM)-based cancer therapy. Mol Cell Endocrinol. 2011;348:430–9. doi: 10.1016/j.mce.2011.04.021. - DOI - PMC - PubMed

Publication types

Substances