. 2018 Jun;13(6):1294-1309.
doi: 10.1038/nprot.2018.041. Epub 2018 May 10.

Isolation and functional assessment of mouse skeletal stem cell lineage

Affiliations

Isolation and functional assessment of mouse skeletal stem cell lineage

Gunsagar S Gulati et al. Nat Protoc. 2018 Jun.

Abstract

There are limited methods available to study skeletal stem, progenitor, and progeny cell activity in normal and diseased contexts. Most protocols for skeletal stem cell isolation are based on the extent to which cells adhere to plastic or whether they express a limited repertoire of surface markers. Here, we describe a flow cytometry-based approach that does not require in vitro selection and that uses eight surface markers to distinguish and isolate mouse skeletal stem cells (mSSCs); bone, cartilage, and stromal progenitors (mBCSPs); and five downstream differentiated subtypes, including chondroprogenitors, two types of osteoprogenitors, and two types of hematopoiesis-supportive stroma. We provide instructions for the optimal mechanical and chemical digestion of bone and bone marrow, as well as the subsequent flow-cytometry-activated cell sorting (FACS) gating schemes required to maximally yield viable skeletal-lineage cells. We also describe a methodology for renal subcapsular transplantation and in vitro colony-formation assays on the isolated mSSCs. The isolation of mSSCs can be completed in 9 h, with at least 1 h more required for transplantation. Experience with flow cytometry and mouse surgical procedures is recommended before attempting the protocol. Our system has wide applications and has already been used to study skeletal response to fracture, diabetes, and osteoarthritis, as well as hematopoietic stem cell-niche interactions in the bone marrow.


Conflict of interest statement

COMPETING INTERESTS The authors declare no competing interests.

Figures

Figure 1 |
Figure 1 |
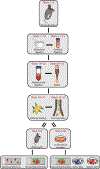
Overview of the protocol for skeletal stem cell lineage isolation and functional assessment. The protocol includes isolation of the mouse skeleton by tissue dissection (Steps 1–6); dissociation of the skeleton into a single-cell suspension by mechanical (Steps 7–10) and chemical digestion (Steps 11–15); depletion of red blood cells with ACK lysis buffer (Steps 16–23) and magnetic-activated cell sorting (MACS) (Steps 24–32); antibody-staining of the cells for skeletal lineage surface markers (Steps 33–41) and analysis and sorting of the cells on a flow cytometer (Steps 42–50); functional assessment of skeletal-lineage phenotype by in vivo renal subcapsular transplantation (Step 51A) and in vitro colony-formation assay (Step 51B); analysis of grafts by Movat pentachrome and immunohistochemistry (left), and analysis of cultures by immunohistochemistry, alcian blue staining, or alizarin red S staining (right).
Figure 2 |
Figure 2 |
Schema for mechanical digestion of skeletal tissue. (a) The mouse is mounted on a platform after euthanasia, and the surgical site is sterilized with 70% (vol/vol) ethanol (Steps 2 and 3). (b) The skin is cut down the ventral and dorsal midline, and along the limbs to expose the underlying skeletal structures. H (humerus), P (pelvis), F (femur), T (tibia), and V (vertebrae) are dissected (Steps 4 and 5). (c) The bones are cleaned by dissection with a scalpel and gentle rolling of the tissue between the fingers with paper towels (Step 6). (d) Bones are placed in 5 ml of digestion buffer (Step 7). (e) Bones are crushed with mortar and pestle (Step 8). (Inset) The bones after three rounds of crushing with mortar and pestle in digestion buffer. All animal experiments in this figure were performed in accordance with the Stanford Administrative Panel on Laboratory Animal Care (APLAC) and received approval from the Institutional Review Board (IRB).
Figure 3 |
Figure 3 |
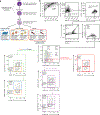
Skeletal stem cell lineage hierarchy and flow cytometry gating scheme. (a) Skeletal stem cell lineage hierarchy of a multipotent, self-renewing mouse skeletal stem cell (mSSC) that gives rise to an early progenitor (pre-mBCSP) and a late progenitor, the mouse bone, cartilage, and stromal progenitor (mBCSP), which in turn generates a pro-chondrogenic progenitor (PCP), two distinct osteoprogenitors, the THY population and the BLSP (B-cell lymphocyte–stimulating population), and two distinct stroma, the 6C3 and HEC (hepatic leukemia-factor-expressing cell) populations. THY and 6C3 are hematopoiesis-supportive, whereas BLSPs are B-cell promoting. mSSCs and pre-mBCSPs are collectively referred to as phenotypic mSSCs (p-mSSCs). (b) Gating strategy recommended to sort the different cells of the skeletal stem cell lineage as shown in a (Steps 42–50). Representative FACS plots with the percentage of parent gate for each population, as generated on the BD FACS Aria II and analyzed by FlowJo v10, are shown. Color code for FACS gates: dark gray: forward scatter, side scatter, viability, and lineage gates; green: osteochondral lineage gate; orange: osteo-lineage cells, including BLSP and THY; blue: chondro-lineage cells, including PCPs; red: stroma, or 6C3 and HEC; and purple: stem and progenitors, including mBCSPs, p-mSSCs, pre-mBCSPs, and mSSCs. A, area; AF, Alexa Fluor; APC, allophycocyanin; BV, brilliant violet; FSC, forward scatter; H, height; PE, phycoerythrin; PI, propidium iodide; SSC, side scatter; W, width. All animal experiments in this figure were performed in accordance with the Stanford APLAC and received approval from the IRB.
Figure 4 |
Figure 4 |
Fluorescence-minus-one (FMO) controls for mouse skeletal lineage gating strategy. Representative FACS plots as generated on the BD FACS Aria II and analyzed by FlowJo v10 for each FMO control (e.g., anti-CD45/TER119 in PE-Cy5, anti-TIE2 in Alexa Fluor 680, anti-6C3 in Alexa Fluor 647, anti-CD105 in PE-Cy7, anti-ITGAV in PE, anti-THY1.1/THY1.2 in APC-Cy7, anti-CD200 in BV605, and propidium iodide) are shown (Steps 34, 35 and 43). FMO controls identify the true negative signal for a given antibody or chemical of interest, and therefore inform the gating strategy. Representative FACS plots with the percentage of parent gate are shown for each population. All animal experiments in this figure were performed in accordance with the Stanford APLAC and received approval from the IRB.
Figure 5 |
Figure 5 |
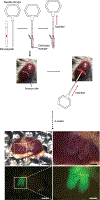
Schema for renal subcapsular transplantation of skeletal-lineage cells. (Top) Cells are resuspended in 2 μl of Matrigel on ice and then aspirated into a Wiretrol II syringe after assembly of the micropipette and plunger (Step 51A(ii and iii)). (Center left) A superficial incision is made near the kidney pole to separate the capsule from the renal parenchyma (Step 51A(ix)). (Center right) Cell-laden Matrigel is injected into the capsule pocket by gently pushing on the plunger (Step 51A(xi)). (Bottom) Heterotopic ossicles form ~4 weeks after transplantation (Step 51A(xvii)). Upper-left panel: Gross image of the kidney graft 4 weeks after 10,000 p-mSSCs from C57BL/6-Tg(CAG-EGFP)10sb/J mice were transplanted under the renal capsule. Scale bar, 5 mm. Upper-right panel: High magnification of the gross image. Scale bar, 2 mm. Lower-left panel: GFP fluorescence of the same kidney graft. Scale bar, 5 mm. Lower-right panel: High magnification of the GFP fluorescence image. Scale bar, 2 mm.
Figure 6 |
Figure 6 |
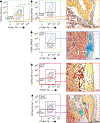
Movat pentachrome staining of renal subcapsular grafts. Movat pentachrome stains of renal subcapsular grafts 4 weeks after transplantation of 10,000 of each skeletal-cell population are shown on the right. Movat pentachrome staining was carried out as described in refs. 32,36. Scale bars, 200 μm. Color code for FACS gates and stains: green: osteochondral lineage; orange: osteo-lineage cells, including BLSP and THY; blue: chondro-lineage cells, including PCPs; red: stroma, or 6C3 and HEC; and purple: stem and progenitor cells, including mBCSPs, p-mSSCs, pre-mBCSPs, and mSSCs. All animal experiments in this figure were performed in accordance with the Stanford APLAC and received approval from the IRB.
Figure 7 |
Figure 7 |
In vitro colony-formation assays with p-mSSCs. (a-d) The expected results from Step 51B. (a) Low-magnification (4×) light-microscopy image of colonies generated 2 weeks after plating 500 p-mSSCs. Scale bar, 500 μm. (b) High-magnification (10×) light-microscopy image of colonies generated 2 weeks after plating 500 p-mSSCs. Scale bar, 100 μm. (c) Light-microscopy images of alizarin red S staining of colonies generated 2 weeks after plating 500 p-mSSCs, demonstrating osteogenic potential. Scale bar, 100 μm. (d) Light-microscopy images of alcian blue staining of colonies generated 2 weeks after plating 500 p-mSSCs, demonstrating osteogenic potential. Scale bar, 100 μm. Alizarin red S and alcian blue staining was carried out as described in ref. 14. All animal experiments in this figure were performed in accordance with the Stanford APLAC and received approval from the IRB.

References

    1. Reya T, Morrison S, Clarke M & Weissman I Stem cells, cancer, and cancer stem cells. Nature 414, 105–111 (2001). - PubMed
    1. Fuchs E & Segre J Stem cells: a new lease on life. Cell 100, 143–155 (2000). - PubMed
    1. Zhu H et al. A protocol for isolation and culture of mesenchymal stem cells from mouse compact bone. Nat. Protoc 5, 550–560 (2010). - PubMed
    1. Soleimani M & Nadri S A protocol for isolation and culture of mesenchymal stem cells from mouse bone marrow. Nat. Protoc 4, 102–106 (2009). - PubMed
    1. Caplan A Mesenchymal stem cells. J. Orthop. Res 9, 641–650 (1991). - PubMed

Publication types