. 2018 Jul;33(7):927-936.
doi: 10.1007/s00384-018-3069-8. Epub 2018 May 11.

Evaluation of interleukin-6 and its soluble receptor components sIL-6R and sgp130 as markers of inflammation in inflammatory bowel diseases

Affiliations

Evaluation of interleukin-6 and its soluble receptor components sIL-6R and sgp130 as markers of inflammation in inflammatory bowel diseases

Susanna Nikolaus et al. Int J Colorectal Dis. 2018 Jul.

Abstract

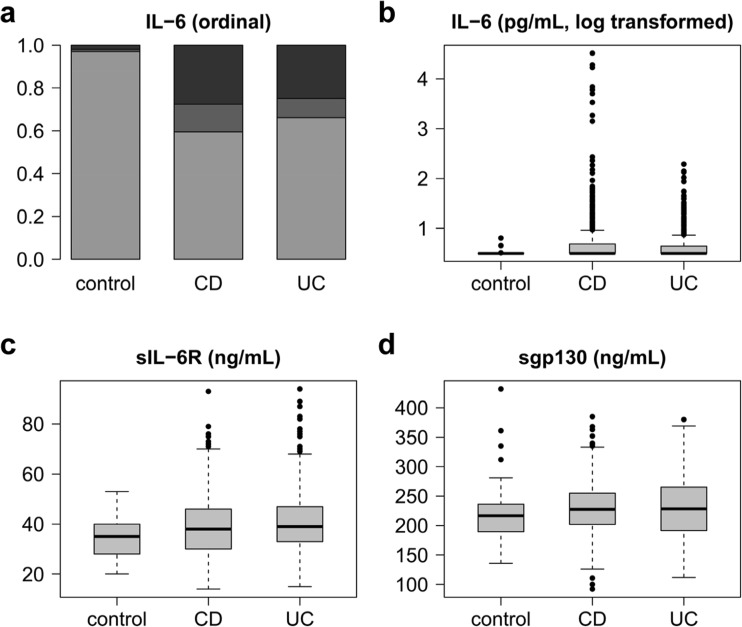
Purpose: Interleukin-6 (IL-6) production and signalling are increased in the inflamed mucosa in inflammatory bowel diseases (IBD). As published serum levels of IL-6 and its soluble receptors sIL-6R and sgp130 in IBD are from small cohorts and partly contradictory, we systematically evaluated IL-6, sIL-6R and sgp130 levels as markers of disease activity in Crohn's disease (CD) and ulcerative colitis (UC).

Methods: Consecutive adult outpatients with confirmed CD or UC were included, and their disease activity and medication were monitored. Serum from 212 CD patients (815 measurements) and 166 UC patients (514 measurements) was analysed, and 100 age-matched healthy blood donors were used as controls.

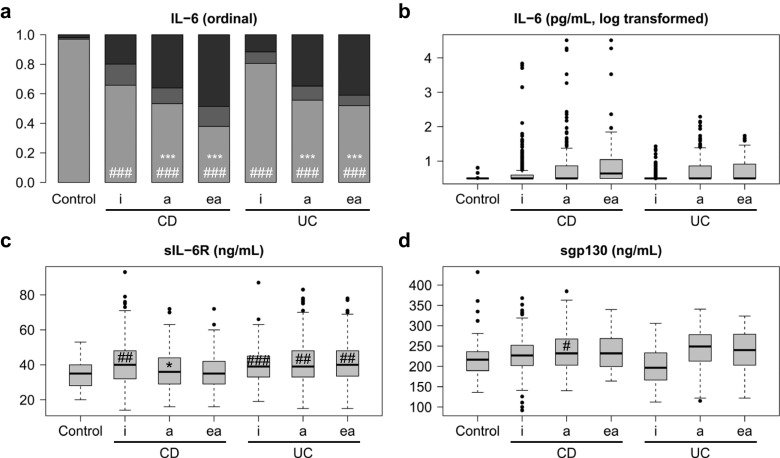
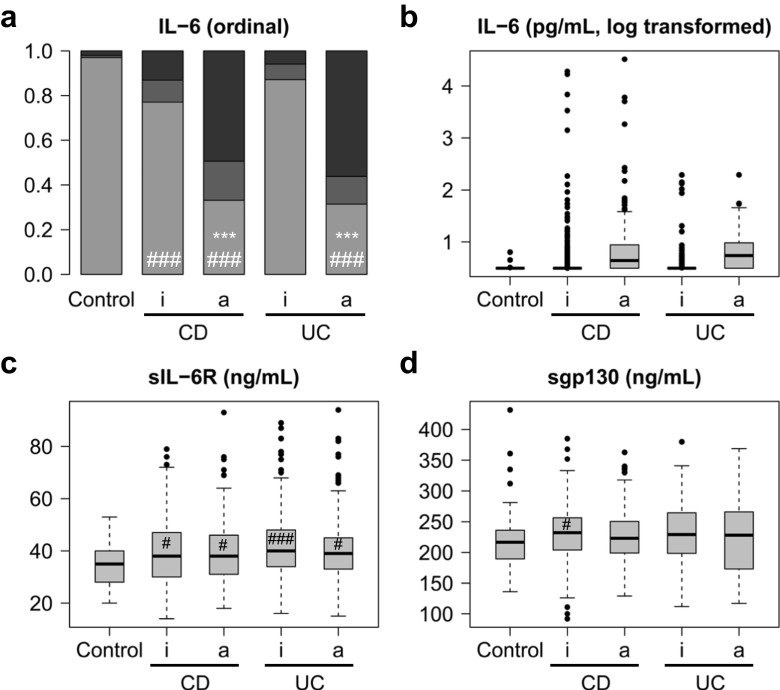
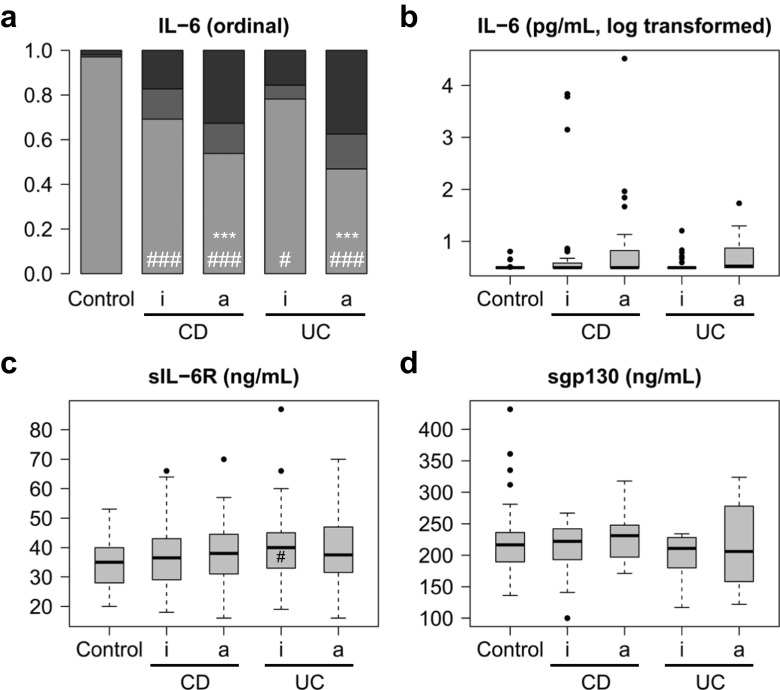
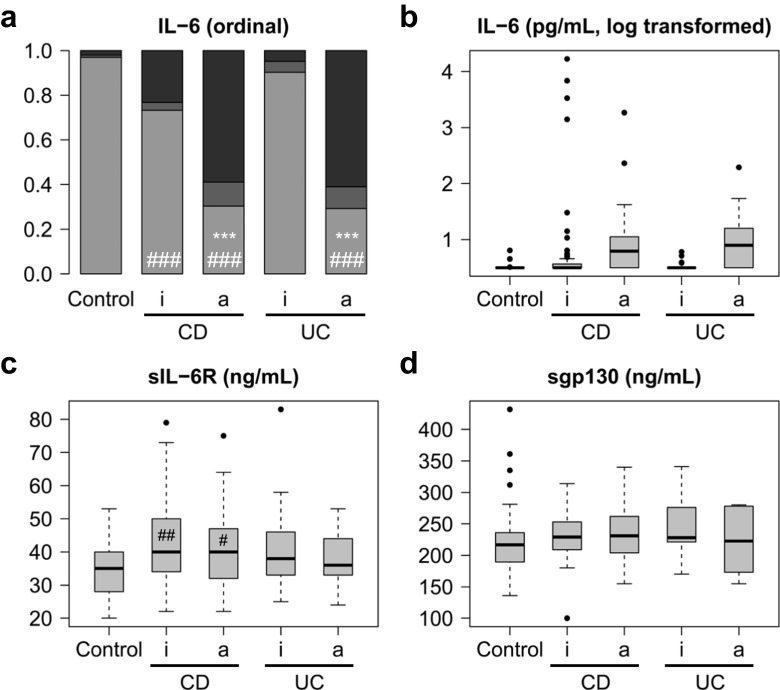
Results: IL-6 serum levels were significantly elevated in active versus inactive CD and UC, also compared with healthy controls. However, only a fraction of IBD patients showed increased serum IL-6. IL-6 levels ranged up to 32.7 ng/mL in active CD (> 5000-fold higher than in controls), but also up to 6.9 ng/mL in inactive CD. Increases in active UC (up to 195 pg/mL) and inactive UC (up to 27 pg/mL) were less pronounced. Associations between IL-6 serum levels and C-reactive protein concentrations as well as leukocyte and thrombocyte counts were observed. Median sIL-6R and sgp130 levels were only increased by up to 15%, which was considered of no diagnostic significance.

Conclusions: Only a minority of IBD patients shows elevated IL-6 serum levels. However, in these patients, IL-6 is strongly associated with disease activity. Its soluble receptors sIL-6R and sgp130 do not appear useful as biomarkers in IBD.

Keywords: Biomarkers; Crohn’s disease; Inflammatory bowel diseases; Interleukin-6; Ulcerative colitis.


Conflict of interest statement

Conflict of interest

GHW and DS are employed by CONARIS Research Institute AG, which has out-licenced its interleukin-6 inhibitor olamkicept to Ferring Pharmaceuticals. UL, BBR and TMR are employed by Ferring Pharmaceuticals. SSc heads the supervisory board of CONARIS. The other authors declare no conflict of interest.

Ethical approval

Ethics approval was granted by the ethics committee of the medical faculty of Kiel University prior to the study (AZ D489/14). All procedures performed in studies involving human participants were in accordance with the ethical standards of the institutional and/or national research committee and with the 1964 Helsinki declaration and its later amendments or comparable ethical standards.

Informed consent

Informed consent was obtained from all individual participants included in the study. The ethical concept of healthcare-embedded biobanking with broad informed consents as implemented in Kiel has recently been described [35].

Figures

Fig. 1
Fig. 1
Overview of IL-6, sIL-6R and sgp130 serum levels in healthy controls and patients with Crohn’s disease (CD) or ulcerative colitis (UC). a Ordinal representation of IL-6 levels across all groups: below the detection limit of 3.13 pg/mL (light grey), between the detection limit and the third quartile (grey) and above the third quartile (black). b Logarithmic representation of IL-6 levels. c sIL-6R levels. d sgp130 levels
Fig. 2
Fig. 2
IL-6, sIL-6R and sgp130 serum levels in healthy controls and in all patients with Crohn’s disease (CD) or ulcerative colitis (UC) differentiated according to disease activity scores. a Ordinal representation of IL-6 levels across all groups: below the detection limit of 3.13 pg/mL (light grey), between the detection limit and the third quartile (grey) and above the third quartile (black). For significance analyses, the two extreme groups (below the detection limit and above the third quartile) were compared. b Logarithmic representation of IL-6 levels. c sIL-6R levels. d sgp130 levels. a, active disease (Crohn’s Disease Activity Index (CDAI) > 150 or Colitis Activity Index (CAI) > 4); ea, elevated (moderate to severe) disease activity (CDAI > 250 or CAI > 6); i, inactive disease (CDAI ≤ 150 or CAI ≤ 4). Significant differences between active and inactive disease: *, p < 0.05; **, p < 0.01; ***, p < 0.001. Significant differences between active or inactive disease and controls: #, p < 0.05; ##, p < 0.01; ###, p < 0.001
Fig. 3
Fig. 3
IL-6, sIL-6R and sgp130 serum levels in healthy controls and in all patients with Crohn’s disease (CD) or ulcerative colitis (UC) differentiated according to C-reactive protein (CRP) levels. a Ordinal representation of IL-6 levels across all groups: below the detection limit of 3.13 pg/mL (light grey), between the detection limit and the third quartile (grey) and above the third quartile (black). For significance analyses, the two extreme groups (below the detection limit and above the third quartile) were compared. b Logarithmic representation of IL-6 levels. c sIL-6R levels. d sgp130 levels. a, active disease (CRP > 5 mg/L); i, inactive disease (CRP ≤ 5 mg/L). Significant differences between active and inactive disease: *, p < 0.05; **, p < 0.01; ***, p < 0.001. Significant differences between active or inactive disease and controls: #, p < 0.05; ##, p < 0.01; ###, p < 0.001
Fig. 4
Fig. 4
IL-6, sIL-6R and sgp130 serum levels in healthy controls and in selected patients with Crohn’s disease (CD) or ulcerative colitis (UC) differentiated according to disease activity scores. Only patients with at least one time point with active and one with inactive disease were included. If more than one time point per condition was available, only data from the two most extreme time points (highest and lowest disease activity score) were included. a Ordinal representation of IL-6 levels across all groups: below the detection limit of 3.13 pg/mL (light grey), between the detection limit and the third quartile (grey) and above the third quartile (black). For significance analyses, the two extreme groups (below the detection limit and above the third quartile) were compared. b Logarithmic representation of IL-6 levels. c sIL-6R levels. d sgp130 levels. a, active disease (Crohn’s Disease Activity Index (CDAI) > 150 or Colitis Activity Index (CAI) > 4); i, inactive disease (CDAI ≤ 150 or CAI ≤ 4). Significant differences between active and inactive disease: *, p < 0.05; **, p < 0.01; ***, p < 0.001. Significant differences between active or inactive disease and controls: #, p < 0.05; ##, p < 0.01; ###, p < 0.001
Fig. 5
Fig. 5
IL-6, sIL-6R and sgp130 serum levels in healthy controls and in selected patients with Crohn’s disease (CD) or ulcerative colitis (UC) differentiated according to C-reactive protein (CRP) levels. Only patients with at least one time point with CRP > 5 mg/L and one time point with CRP ≤ 5 mg/L were included. If more than one time point per condition was available, only data from the two most extreme time points (highest and lowest CRP levels) were included. a Ordinal representation of IL-6 levels across all groups: below the detection limit of 3.13 pg/mL (light grey), between the detection limit and the third quartile (grey) and above the third quartile (black). For significance analyses, the two extreme groups (below the detection limit and above the third quartile) were compared. b Logarithmic representation of IL-6 levels. c sIL-6R levels. d sgp130 levels. a, active disease (CRP > 5 mg/L); i, inactive disease (CRP ≤ 5 mg/L). Significant differences between active and inactive disease: *, p < 0.05; **, p < 0.01; ***, p < 0.001. Significant differences between active or inactive disease and controls: #, p < 0.05; ##, p < 0.01; ###, p < 0.001
Fig. 6
Fig. 6
Association heat maps for Crohn’s disease (CD; a) and ulcerative colitis (UC; b). Tendentially or significantly positive (increase) or negative (decrease) associations of ordinal interleukin-6, soluble interleukin-6 receptor or soluble glycoprotein 130 serum levels with other parameters are visualised by colour code. For the complete data and p values, see Supplementary Tables 10, 11 and 12. Grey fields indicate parameters with only one characteristic value or self-associations

References

    1. Scheller J, Garbers C, Rose-John S. Interleukin-6: from basic biology to selective blockade of pro-inflammatory activities. Semin Immunol. 2014;26:2–12. doi: 10.1016/j.smim.2013.11.002. - DOI - PubMed
    1. Waldner MJ, Neurath MF. Master regulator of intestinal disease: IL-6 in chronic inflammation and cancer development. Semin Immunol. 2014;26:75–79. doi: 10.1016/j.smim.2013.12.003. - DOI - PubMed
    1. Hunter CA, Jones SA. IL-6 as a keystone cytokine in health and disease. Nat Immunol. 2015;16:448–457. doi: 10.1038/ni.3153. - DOI - PubMed
    1. Schaper F, Rose-John S. Interleukin-6: biology, signaling and strategies of blockade. Cytokine Growth Factor Rev. 2015;26:475–487. doi: 10.1016/j.cytogfr.2015.07.004. - DOI - PubMed
    1. Suzuki Y, Saito H, Kasanuki J, Kishimoto T, Tamura Y, Yoshida S. Significant increase of interleukin 6 production in blood mononuclear leukocytes obtained from patients with active inflammatory bowel disease. Life Sci. 1990;47:2193–2197. doi: 10.1016/0024-3205(90)90149-L. - DOI - PubMed

LinkOut - more resources