. 2018 Sep;20(9):e12858.
doi: 10.1111/cmi.12858. Epub 2018 May 30.

Mycobacteria employ two different mechanisms to cross the blood-brain barrier

Affiliations

Mycobacteria employ two different mechanisms to cross the blood-brain barrier

Lisanne M van Leeuwen et al. Cell Microbiol. 2018 Sep.

Abstract

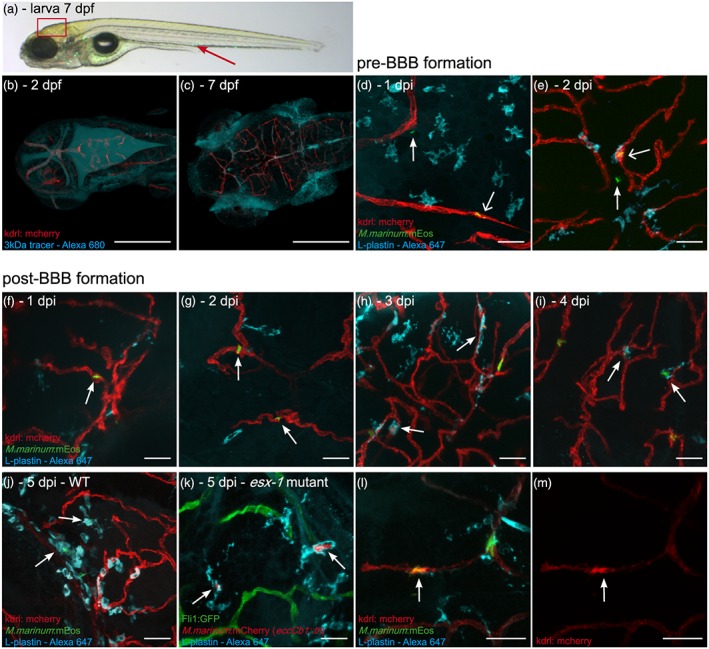
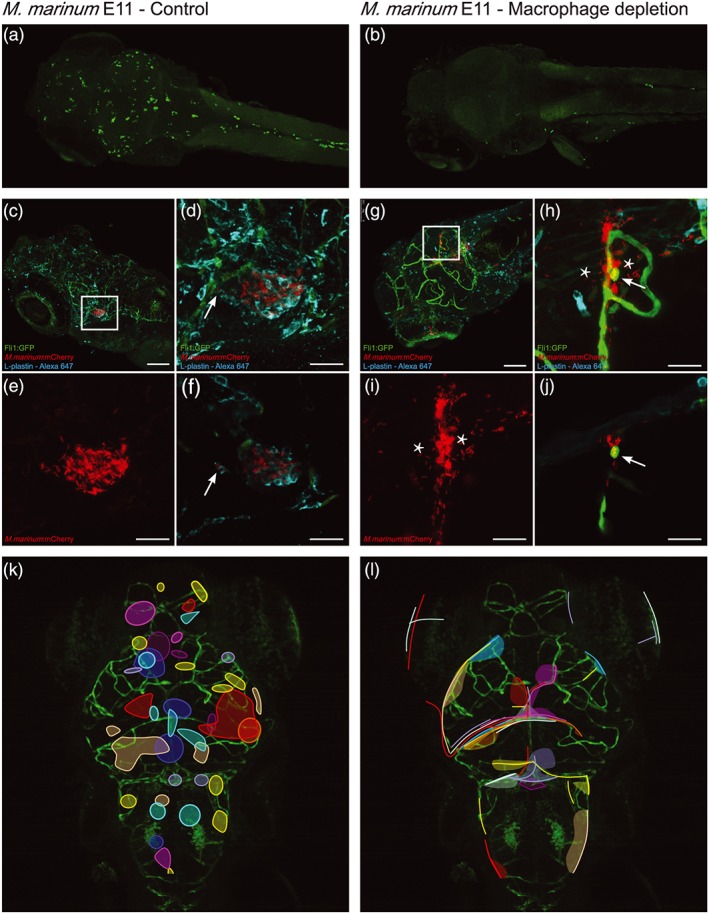
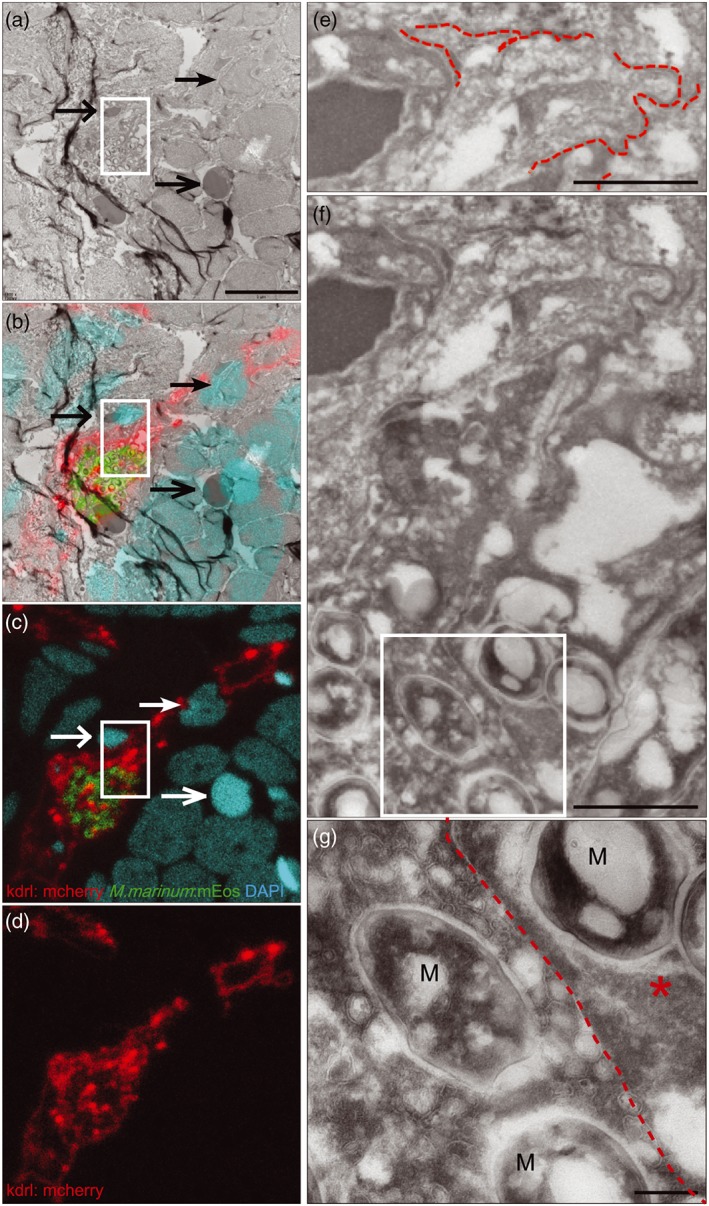
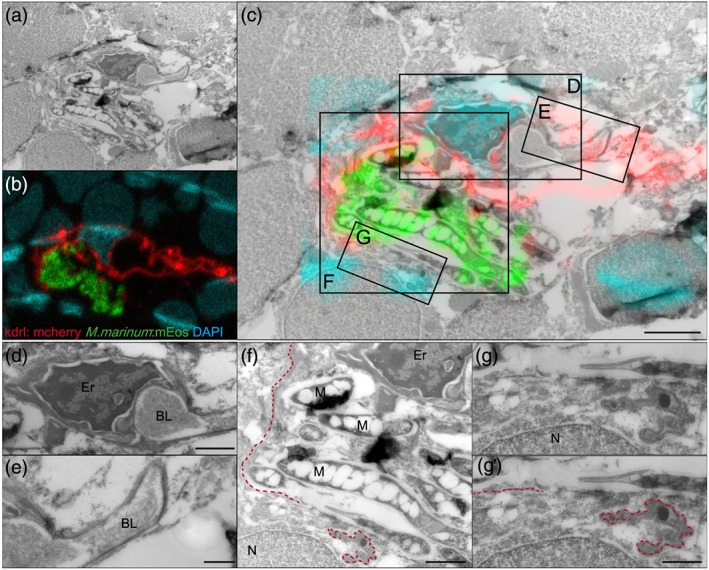
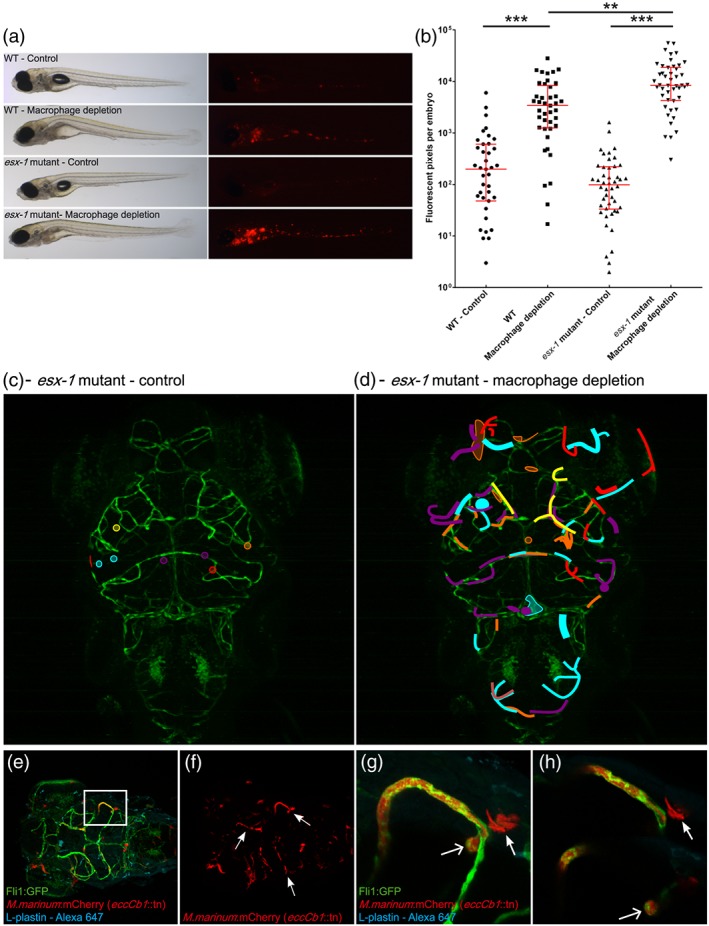
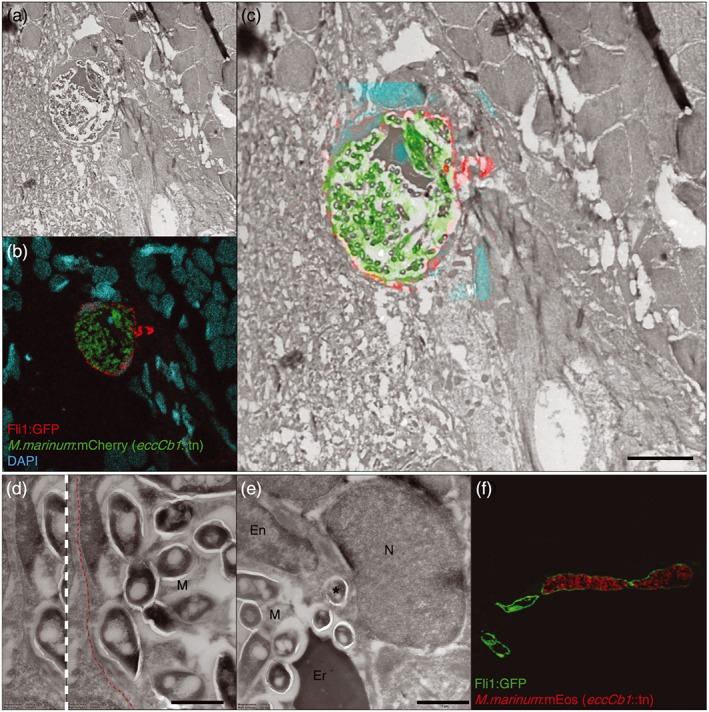
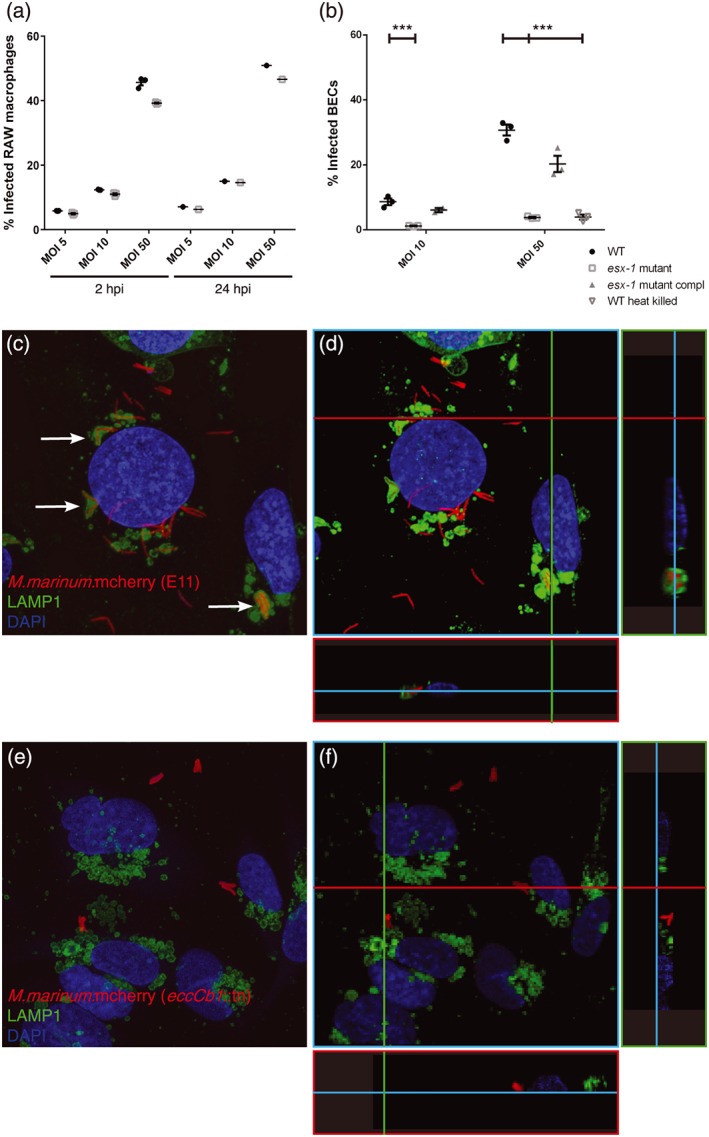
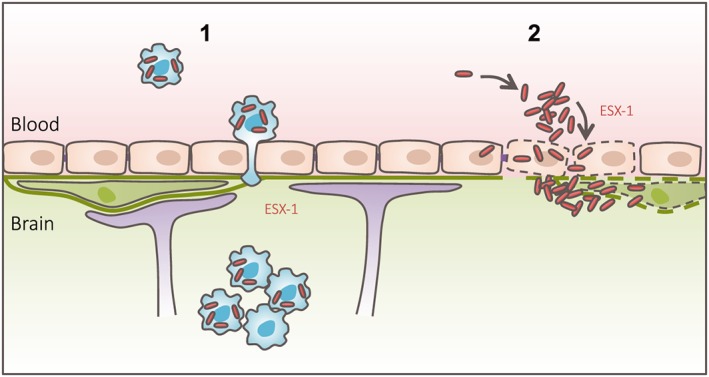
Central nervous system (CNS) infection by Mycobacterium tuberculosis is one of the most devastating complications of tuberculosis, in particular in early childhood. In order to induce CNS infection, M. tuberculosis needs to cross specialised barriers protecting the brain. How M. tuberculosis crosses the blood-brain barrier (BBB) and enters the CNS is not well understood. Here, we use transparent zebrafish larvae and the closely related pathogen Mycobacterium marinum to answer this question. We show that in the early stages of development, mycobacteria rapidly infect brain tissue, either as free mycobacteria or within circulating macrophages. After the formation of a functionally intact BBB, the infiltration of brain tissue by infected macrophages is delayed, but not blocked, suggesting that crossing the BBB via phagocytic cells is one of the mechanisms used by mycobacteria to invade the CNS. Interestingly, depletion of phagocytic cells did not prevent M. marinum from infecting the brain tissue, indicating that free mycobacteria can independently cause brain infection. Detailed analysis showed that mycobacteria are able to cause vasculitis by extracellular outgrowth in the smaller blood vessels and by infecting endothelial cells. Importantly, we could show that this second mechanism is an active process that depends on an intact ESX-1 secretion system, which extends the role of ESX-1 secretion beyond the macrophage infection cycle.

Keywords: ESX-1 secretion; Trojan horse mechanism; blood-brain barrier; tuberculosis; tuberculous meningitis; zebrafish.


Figures

Figure 1
Figure 1
M. marinum WT and esx‐1 mutant traverse across an intact blood–brain barrier within macrophages. (a) Lateral view of a casper zebrafish larva at 3 dpi (corresponds to 7 dpf), infected with M. marinum E11:mEos3.1 (green). Red arrow marks the caudal vein injection spot. Boxed area represents the brain region of which representative images are shown in this figure. (b) Tg(kdrl:mCherry) is5 zebrafish larva, uninfected, 1 hr after 3‐kDa Alexa 680 tracer injection at 2 dpf, showing massive leakage of tracer to the ventricles, confirming the immaturity of the BBB. (c) Injection of tracer at 7 dpf, showing localisation in brain blood vessels, indicating that the BBB is functionally intact at this moment. Blood vessels in close proximity to the eyes and gills do not possess a BBB and do not restrict diffusion of the dye, leading to extravasation of the dye at these locations. Scale bars bc = 250 μm. (d) Tg(kdrl:mCherry) is5 zebrafish larvae infected at 2 dpf (before formation of a functional BBB), 1 dpi single nonphagocytosed bacteria (green) can be found in blood vessel (red; open arrow) and in brain tissue (arrow), showing that M. marinum can enter brain tissue at this time point. (e) Also at 2 dpi, phagocytosed bacteria (colocalisation of green bacteria and cyan phagocytes labelled with anti‐L‐plastin) in blood vessel (open arrow) and single nonphagocytosed bacteria in brain tissue (arrow) are found. (f) Systemic infection at 4 dpf (larvae with a functional BBB), M. marinum (green) is solely found in brain blood vessels (red) at 1 dpi and (g) 2 dpi (arrows). (h–j) From 3 dpi onwards, phagocytosed mycobacteria (colocalisation of green bacteria and cyan phagocytes) are able to leave the bloodstream (arrows). (k) Representative image of section of brain in Tg(Fli1:GFP) y1 zebrafish larvae, systemically infected with the esx‐1 mutant (red) at 4 dpf, showing that mutant bacteria also cross the BBB within phagocytic cells (anti‐L‐plastin, cyan). (l,m) Examples of spot with high expression of mCherry tagged VEGFr2 in Tg(kdrl:mCherry) is5 larva, colocalising with phagocytosed (cyan) M. marinum E11 (green) in blood vessel (red). (l) Merged image, (m) corresponding single red channels. Scale bars d–m = 25 μm
Figure 2
Figure 2
Wild type M. marinum can still infect brain tissue when macrophages are depleted. Left panel shows untreated zebrafish larvae (control), whereas right panel shows larvae depleted of phagocytes by treatment with pu.1 and clodronate filled liposomes at 3 dpf, to kill circulating phagocytes. (a) Control casper larva at 5 dpf, stained with anti‐L‐plastin to visualise normal phagocyte distribution. (b) Five dpf phagocyte‐depleted casper larva. Anti‐L‐plastin is used in (a) and (b) to stain phagocytes. (c) Dorsal view of wild type Tg(Fli1:GFP) y1 larvae (green) at 5 dpi, systemically infected at 4 dpf with M. marinum (red) and stained with anti‐L‐plastin (cyan), showing formation of early granuloma in brain tissue. (d) Z‐stack of boxed area in (c), allowing for a more precise analysis of the position of M. marinum and phagocytes. (e) Corresponding red fluorescent channel to clearly show infection pattern. (f) In the presence of macrophages, M. marinum leaves the bloodstream within phagocytes (arrow) and forms early granulomas in brain tissue. Scale bar c = 100 μm. Scale bar d–f = 25 μm. (g) Z‐stack of head of Tg(Fli1:GFP) y1 larva, phagocyte‐depleted, and systemically infected with M. marinum (red) at 4 dpf and stained with L‐plastin (cyan). Boxed area is enlarged in h–j. (h) Shows mycobacteria outside blood vessels in brain tissue in the absence of phagocytic cells (*). (i) Shows the corresponding red fluorescent channel, depicting that tissue infiltration follows the shape of the blood vessels. (j) Single Z‐slice, which shows the intracellular phenotype of M. marinum (arrow), colocalising with a blood vessel, but in the absence of L‐plastin labelling. Scale bar g = 100 μm; Scale bar h–j = 25 μm. (k) Schematic representation of pooled data of all early granulomas found in nine wild type larvae showing a random distribution in the brain. (l) Schematic representation of pooled data of infection distribution found in nine phagocyte‐depleted larvae, showing that mycobacteria are found in brain tissue, but do not migrate into deeper tissue
Figure 3
Figure 3
Correlative light and electron microscopy of M. marinum infected blood vessels showing irregular blood vessel walls and invasion of endothelial cells. Tg(kdrl:mCherry) is5 larva (9 dpf) with red fluorescent blood vessels infected with green fluorescent M. marinum after phagocyte depletion. To aid correlation of confocal and EM imaging, nuclei were stained with DAPI after fixation (cyan). (a) Electron microscopy and (b) correlative light and electron microscopy, and (c) confocal microscopy. Arrows indicate landmarks used to merge images obtained from consecutive slices in the same area of the zebrafish brain. Boxed area is enlarged in (f), scale bar a = 5 μm (applies to b–d). (d) Single red channel illustrating the irregularity of the infected blood vessel and the more regular shape of the non‐infected blood vessel (right upper corner). (e,f) High magnification EM image showing the irregular shaped infected blood vessels and basal lamina. Red dotted lines represent basal lamina found in this area. Boxed area is enlarged in (g). Scale bar = 1 μm. (g) High magnification of area where mycobacteria can both be found intravascular as intracellular. Vesicles, indicative for intravascular localisation, can only be found left of the red dotted line. This suggest that mycobacteria right of the line are localised in an endothelial cell (*). Scale bar = 200 nm. M = M. marinum
Figure 4
Figure 4
M. marinum causes damage to blood vessels and surrounding tissue. (a) Electron microscopy and (b) confocal imaging merged into (c) correlative light and electron microscopy of 9 dpf Tg(kdrl:mCherry) is5 larva with red fluorescent blood vessels infected with green fluorescent M. marinum E11, after phagocyte depletion. Nuclei were stained with DAPI after fixation (cyan). Boxed areas are enlarged in (d)–(g). Scale bar in c = 2 μm. (d) High magnification of infected blood vessel in brain of infected zebrafish with erythrocyte, vessel lumen, and intact basal lamina on one side of the blood vessel visible. Scale bar = 1 μm. (e) Intact basal lamina at uninfected part of this infected blood vessel. Scale bar = 500 nm. (f) As a consequence of bacterial replication and invasion of endothelial cells, the basal lamina is disrupted (red dotted line). Scale bar = 1 μm. (g,g') higher magnification of the disrupted basal lamina. Scale bar = 500 nm. Er = Erythrocyte, BL = blood vessel lumen, M = M. marinum, N = nucleus
Figure 5
Figure 5
ESX‐1‐deficient mycobacteria are found predominantly in blood vessels. (a) Representative bright field and corresponding fluorescent image of infected larvae at 4 dpf with either M. marinum E11 or M. marinum esx‐1 mutant with or without phagocyte depletion. Images clearly illustrate increased fluorescent intensity in phagocyte‐depleted groups. (b) Corresponding fluorescent pixel counts of infected larvae of three pooled biological independent infection experiments. Graphs show mean and SEM. ** = <.05, *** = <.005. (c) Schematic representation of esx‐1 mutant infection pattern in head of control larvae, pooled data from five larvae. (d) Schematic representation of esx‐1 mutant infection distribution found in five phagocyte‐depleted larva, showing that high amounts of mycobacteria are found predominantly in blood vessels. (e) Z‐stack, dorsal view of Tg(Fli1:GFP) y1 larvae (green), depleted of its phagocytic pool and systemically infected with the esx‐1 mutant (red) at 4 dpf, stained with L‐plastin (cyan) to visualise remaining phagocytes, showing high infection load in brain area. (f) Shows single red fluorescent signal, demonstrating that bacteria are strictly localised in the vasculature (arrows). Boxed area is enlarged in (g) z‐stack, and (h) two single Z‐slices, evidently showing an abundant amount of bacteria clogging the blood vessel, with subsequent bacterial overgrowth, protrusion (open arrow) and (very rare) bursting of the blood vessel wall (closed arrow)
Figure 6
Figure 6
ESX‐1 secretion is required for macrophage independent BBB crossing in vivo. Infected blood vessel (depicted in red to facilitate comparison with Figures 3 and 4) found in brain tissue of 9 dpf phagocyte‐depleted Tg(Fli1:GFP) y1 larva, systemically infected with M. marinum eccCb1::tn (green), nuclei are stained with DAPI (cyan). (a) Electron microscopy, (b) confocal microscopy, and (c) correlative light and electron microscopy, showing an abundant amount of extracellular ESX‐1‐deficient M. marinum restricted to a blood vessel. Scale bar = 5 μm. Also notice the regular shape of the blood vessel. (d) Higher magnification of the highly infected blood vessel depicted in (c), showing that bacteria did not cross or disrupt the basal lamina (red dotted line). (e) Although esx‐1 mutant bacteria were mainly found in the lumen of the vessel, sporadically one was found to invade endothelial cell (*). (f) Cross section of infected (red fluorescent esx‐1 mutant) and non‐infected blood vessels (green) of Tg(Fli1:GFP) y1 larva, showing high bacterial load in a single blood vessel with subsequent enlargement of the vessel lumen. En = Endothelial cell (nucleus), Er = Erythrocyte, M = M. marinum, N = nucleus, Scale bar e and f = 1 μm
Figure 7
Figure 7
ESX‐1 secretion required for brain endothelial cell invasion. (a) FACS experiment showing uptake of M. marinum E11 and ESX‐1‐deficient M. marinum in RAW macrophages. No significant differences can be found in phagocytosis at 2 and 24 hpi. (b) Infection of brain endothelial cells show significant differences for both concentrations in uptake between M. marinum WT, the esx‐1 mutant, complemented esx‐1 mutant, and heat‐killed M. marinum WT, graph shows one out of three experiments with representative data, performed in triplo. *** = p < .005. (c) M. marinum WT (red) infects BECs (nuclei, cyan) and is transferred to the lysosome, shown by colocalisation of mycobacteria and LAMP1 (green; arrows). (d) 3D model of the same stack provides more evidence for the colocalisation of M. marinum with LAMP1, illustrated with two cross sections in this stack, visualised with green and red line. (e) Few esx‐1 mutant bacteria are found associated with BECs and clearly show no colocalisation with LAMP1. (f) 3D modelling of the same stack shows the probable extracellular localisation of the esx‐1 mutant
Figure 8
Figure 8
Graphical abstract. Graphical abstract summarising the main findings of this study, in which we show that mycobacteria are able to employ two different migration routes to cross the BBB: (1) Trojan horse mechanism, in which mycobacteria can cross a functionally intact BBB within phagocytic cells; (2) ESX‐1‐dependent invasion and infection of endothelial cells, with subsequent damage of the basal lamina

References

    1. Abbott, N. J. , Patabendige, A. A. , Dolman, D. E. , Yusof, S. R. , & Begley, D. J. (2010). Structure and function of the blood‐brain barrier. Neurobiology of Disease, 37(1), 13–25. Available at: doi: 10.1016/j.nbd.2009.07.030 - DOI - PubMed
    1. Abbott, N. J. , Rönnbäck, L. , & Hansson, E. (2006). Astrocyte‐endothelial interactions at the blood‐brain barrier. Nature Reviews. Neuroscience, 7(1), 41–53. Available at: http://www.ncbi.nlm.nih.gov/pubmed/16371949. Accessed May 22, 2013 - PubMed
    1. Abdallah, A. M. , Bestebroer, J. , Savage, N. D. , de Punder, K. , van Zon, M. , Wilson, L. , … Peters, P. J. (2011). Mycobacterial secretion systems ESX‐1 and ESX‐5 play distinct roles in host cell death and inflammasome activation. Journal of Immunology, 187(9), 4744–4753. Available at: http://www.ncbi.nlm.nih.gov/pubmed/21957139. Accessed December 31, 2013 - PubMed
    1. Be, N. a. , Bishai, W. R. , & Jain, S. K. (2012). Role of Mycobacterium tuberculosis pknD in the pathogenesis of central nervous system tuberculosis. BMC Microbiology, 12, 7 Available at: http://www.pubmedcentral.nih.gov/articlerender.fcgi?artid=3322341&tool=p... - PMC - PubMed
    1. Be, N. A. , Klinkenberg, L. G. , Bishai, W. R. , Karakousis, P. C. , & Jain, S. K. (2011). Strain‐dependent CNS dissemination in guinea pigs after Mycobacterium tuberculosis aerosol challenge. Tuberculosis (Edinburgh, Scotland), 91(5), 386–389. - PMC - PubMed

Publication types

MeSH terms

LinkOut - more resources