Absorption Refrigeration Cycles with Ammonia-Ionic Liquid Working Pairs Studied by Molecular Simulation
- PMID: 29749996
- PMCID: PMC5937689
- DOI: 10.1021/acs.iecr.8b00442
Absorption Refrigeration Cycles with Ammonia-Ionic Liquid Working Pairs Studied by Molecular Simulation
Abstract
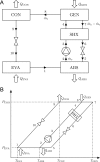
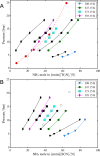
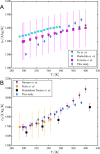
For absorption refrigeration, it has been shown that ionic liquids have the potential to replace conventional working pairs. Due to the huge number of possibilities, conducting lab experiments to find the optimal ionic liquid is infeasible. Here, we provide a proof-of-principle study of an alternative computational approach. The required thermodynamic properties, i.e., solubility, heat capacity, and heat of absorption, are determined via molecular simulations. These properties are used in a model of the absorption refrigeration cycle to estimate the circulation ratio and the coefficient of performance. We selected two ionic liquids as absorbents: [emim][Tf2N], and [emim][SCN]. As refrigerant NH3 was chosen due to its favorable operating range. The results are compared to the traditional approach in which parameters of a thermodynamic model are fitted to reproduce experimental data. The work shows that simulations can be used to predict the required thermodynamic properties to estimate the performance of absorption refrigeration cycles. However, high-quality force fields are required to accurately predict the cycle performance.
Conflict of interest statement
The authors declare no competing financial interest.
Figures


References
-
- Pardo N.; Vatopoulos K.; Krook-Riekkola A.; Moya J.; Perez A.. Heat and Cooling Demand and Market Perspective; Publications Office of the European Union, 2012. http://publications.jrc.ec.europa.eu/repository/bitstream/111111111/2698... (accessed Feb 10, 2017).
-
- Seiler M.; Kühn A.; Ziegler F.; Wang X. Sustainable Cooling Strategies Using New Chemical System Solutions. Ind. Eng. Chem. Res. 2013, 52, 16519–16546. 10.1021/ie401297u. - DOI
-
- Poth H. Electron Cooling: Theory, Experiment, Application. Phys. Rep. 1990, 196, 135–297. 10.1016/0370-1573(90)90040-9. - DOI
-
- Tassou S.; Lewis J.; Ge Y.; Hadawey A.; Chaer I. A Review of Emerging Technologies for Food Refrigeration Applications. Appl. Therm. Eng. 2010, 30, 263–276. 10.1016/j.applthermaleng.2009.09.001. - DOI
-
- Fan Y.; Luo L.; Souyri B. Review of Solar Sorption Refrigeration Technologies: Development and Applications. Renewable Sustainable Energy Rev. 2007, 11, 1758–1775. 10.1016/j.rser.2006.01.007. - DOI
LinkOut - more resources
Full Text Sources
Other Literature Sources
Research Materials
Miscellaneous
