. 2018 Mar 21;4(3):eaaq0504.
doi: 10.1126/sciadv.aaq0504. eCollection 2018 Mar.

The limits of earthquake early warning: Timeliness of ground motion estimates

Affiliations

The limits of earthquake early warning: Timeliness of ground motion estimates

Sarah E Minson et al. Sci Adv. .

Abstract

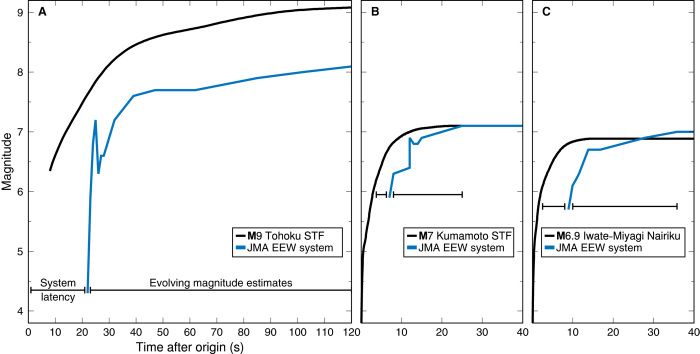
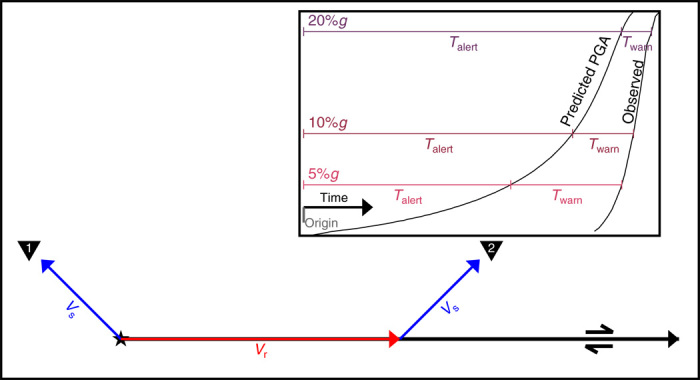
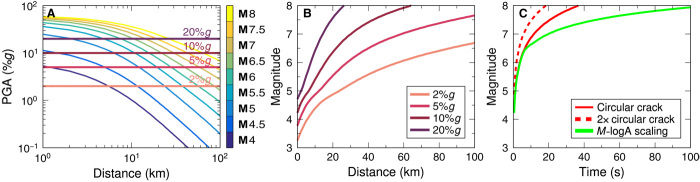
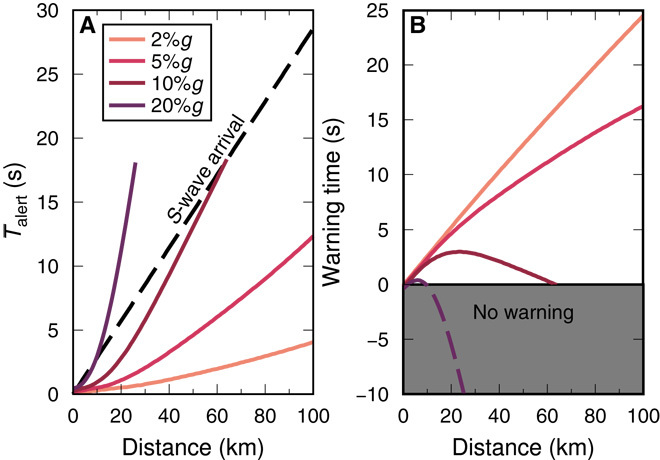
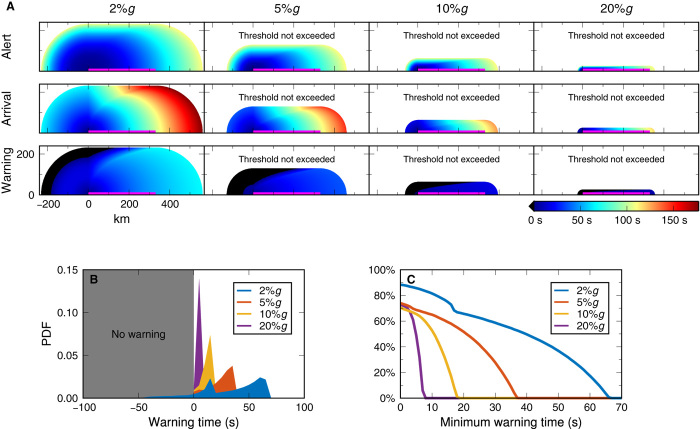
The basic physics of earthquakes is such that strong ground motion cannot be expected from an earthquake unless the earthquake itself is very close or has grown to be very large. We use simple seismological relationships to calculate the minimum time that must elapse before such ground motion can be expected at a distance from the earthquake, assuming that the earthquake magnitude is not predictable. Earthquake early warning (EEW) systems are in operation or development for many regions around the world, with the goal of providing enough warning of incoming ground shaking to allow people and automated systems to take protective actions to mitigate losses. However, the question of how much warning time is physically possible for specified levels of ground motion has not been addressed. We consider a zero-latency EEW system to determine possible warning times a user could receive in an ideal case. In this case, the only limitation on warning time is the time required for the earthquake to evolve and the time for strong ground motion to arrive at a user's location. We find that users who wish to be alerted at lower ground motion thresholds will receive more robust warnings with longer average warning times than users who receive warnings for higher ground motion thresholds. EEW systems have the greatest potential benefit for users willing to take action at relatively low ground motion thresholds, whereas users who set relatively high thresholds for taking action are less likely to receive timely and actionable information.


Figures

Fig. 1
Fig. 1. Earthquake magnitude and alert evolution.
Evolution of EEW magnitude estimates for the (A) 2011 M9.0 Tohoku, (B) 2016 M7.0 Kumamoto, and (C) 2008 M6.9 Iwate-Miyagi Nairiku, Japan earthquakes. We compare the time evolution of magnitude estimates from the JMA EEW system (blue) to the inferred actual magnitude evolution based on kinematic rupture modeling (black) (–37). The JMA estimates have the same shape as the actual source time function (STF) but are time-shifted. This indicates that the EEW magnitude estimates are following the moment release of the earthquake as it evolves with time (with some delay due to system latency) rather than predicting the final magnitude. Note that the JMA EEW magnitude estimate for the Tohoku earthquake saturates near M8 because of limitations in the frequency band used (38).
Fig. 2
Fig. 2. Schematic of Talert, Twarn, and finite rupture design.
Inset: Schematic of the time required to issue an alert (Talert) and the amount of warning time a user receives (Twarn) for 5, 10, and 20%g thresholds at a given location. Talert is the time from origin until the EEW system can predict that the PGA at the user’s location will exceed the specified threshold. The amount of warning time the user will receive (Twarn) is the time difference between Talert and when the ground motion at the user’s location actually exceeds the given threshold. Main figure: Map view showing fault geometry (black line) in relation to rupture propagation direction (red) and S-wave propagation directions (blue) for two different user locations, relative to the rupture initiation point (star). For the finite fault examples, the rupture is assumed to propagate unilaterally at constant rupture velocity, Vr = 3 km/s. For locations in the backward rupture direction (1) and in the point source examples, the strong ground motion is assumed to be carried by the direct S wave propagating at Vs = 3.5 km/s. In the forward rupture direction, the arrival of strong ground motion is delayed because it is assumed to first propagate along the fault with speed Vr before finally traveling to the observer (2) with speed Vs.
Fig. 3
Fig. 3. The interdependence of magnitude and distance on resulting PGA thresholds.
(A) Distance decay of PGA as a function of magnitude and distance, with threshold values noted by horizontal lines. (B) Minimum magnitude necessary to produce the four threshold PGA values of 2, 5, 10, and 20%g as a function of distance. (C) Time evolution of moment release for an M8 earthquake. Red line shows assumed moment release rate, M0 ~ Td3, from a circular crack model (–26). Red dashed line shows speed at which an EEW system could estimate earthquake magnitude under the circular crack model if it estimated magnitude twice as fast as the actual moment release; this is the model used in the point source analysis. Green line is the moment release from a continental strike-slip earthquake that expands as a circular crack until it fills a maximum seismogenic width of 15 km and then expands unilaterally in the along-strike direction assuming a rupture velocity of 3 km/s and magnitude-log area (M-logA) scaling of Hanks and Bakun (29); this is the model used in the finite fault analysis (see text).
Fig. 4
Fig. 4. Time required to issue an alert and resulting warning time for a point source.
(A) Time required to issue an alert (Talert) as a function of the user’s distance from the rupture for different warning thresholds. The dashed black line is the expected S-wave arrival time. (B) Warning time (Twarn) assuming that the ground motion threshold is exceeded when the S wave arrives at the user’s location, and thus, the user’s warning time is the S-wave arrival time [black dashed line in (A)] minus the time to issue an alert [colored lines in (A)].
Fig. 5
Fig. 5. Potential warning time for a finite rupture.
(A) We present a scenario finite rupture (shown by magenta line) that starts at the origin and propagates to the right at 3 km/s until it is an M8 earthquake. The top row shows the time to issue an alert, assuming that the EEW system has no latencies and gives each location an alert as soon as the rupture has propagated close enough or enough moment has been released such that the predicted ground motion at the location exceeds 2, 5, 10, and 20%g (left to right). White regions are areas that do not exceed threshold acceleration level. Middle row shows the time at which strong ground motion arrives at the user’s location, assuming that the strong shaking is carried by the indirect travel path shown in Fig. 2. Bottom row shows the warning time to each location—the difference between the ground motion arrival times in the second row and the time to issue an alert in the top row. Black regions indicate areas that receive negative warning time, that is, the alert arrives after the ground motion threshold has already been exceeded. Note that in the backward rupture direction (negative locations on the x axis), the alert, arrival, and warning times are identical to the point source results, except that the alert times have been slightly increased (and warning times correspondingly decreased) due to the change from a circular crack model to a rupture length scaling moment rate function (compare to Fig. 4 and fig. S2). (B) PDFs of potential warning time calculated from the warning times in the bottom row of (A). The two peaks of the PDF for the 2%g threshold correspond to the forward and backward rupture directions, with longer warning times possible in the forward rupture direction. The PDFs for the other ground motion thresholds are unimodal because strong ground motion is only observed near the earthquake rupture; thus, the size of the backward rupture direction region experiencing ground motion exceeding 5, 10, or 20%g is insignificant. (C) Percentage of locations that could potentially receive a given minimum warning time. These values are obtained by integrating the PDFs in (B). Again, long warning times are not possible for high levels of ground motion: Almost 90% of locations receive at least some warning for 2%g, and 17% of locations receive more than a minute of warning for accelerations exceeding 2%g, but no users are expected to receive more than 7 s of warning for acceleration exceeding 20%g, under a no-latency system.
Fig. 6
Fig. 6. Northern San Andreas fault rupture scenario.
An example of an M8 finite fault rupture starting far from a major city (off the coast of northern California) and propagating toward a populous region (the San Francisco Bay Area), generally considered the most favorable case for timely EEW. Each subplot shows the accumulated PGA at 4, 20, 38, 54, 67, and 96 s after initiation. Text boxes show the predicted PGA at select cities, given the magnitude and rupture extent observed at that point. Red boxes are locations for which a 10%g warning could be issued at the elapsed times shown. See text and fig. S10 for details of alert and warning times at each city.

References

    1. Wu S., Beck J. L., Heaton T. H., ePAD: Earthquake probability-based automated decision-making framework for earthquake early warning. Comput. Aided Civ. Inf. 28, 737–752 (2013).
    1. Espinosa-Aranda J. M., Cuellar A., Garcia A., Ibarrola G., Islas R., Maldonado S., Rodriguez F. H., Evolution of the Mexican Seismic Alert System (SASMEX). Seismol. Res. Lett. 80, 694–706 (2009).
    1. Hoshiba M., Iwakiri K., Hayashimoto N., Shimoyama T., Hirano K., Yamada Y., Ishigaki Y., Kikuta H., Outline of the 2011 off the Pacific coast of Tohoku Earthquake (Mw 9.0): Earthquake early warning and observed seismic intensity. Earth Planets Space 63, 7 (2011).
    1. Kohler M. D., Cochran E. S., Given D., Guiwits S., Neuhauser D., Henson I., Hartog R., Bodin P., Kress V., Thompson S., Felizardo C., Brody J., Bhadha R., Schwarz S., Earthquake early warning ShakeAlert system: West coast wide production prototype. Seismol. Res. Lett. 89, 99–107 (2017).
    1. Fujinawa Y., Noda Y., Japan’s earthquake early warning system on 11 March 2011: Performance, shortcomings, and changes. Earthquake Spectra 29, S341–S368 (2013).

Publication types

LinkOut - more resources