Critical-depth Raman spectroscopy enables home-use non-invasive glucose monitoring
- PMID: 29750797
- PMCID: PMC5947912
- DOI: 10.1371/journal.pone.0197134
Critical-depth Raman spectroscopy enables home-use non-invasive glucose monitoring
Abstract
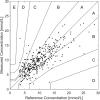
One of the most ambitious endeavors in the field of diabetes technology is non-invasive glucose sensing. In the past decades, a number of different technologies have been assessed, but none of these have found its entry into general clinical use. We report on the development of a table-top confocal Raman spectrometer that was used in the home of patients with diabetes and operated for extended periods of time unsupervised and without recalibration. The system is based on measurement of glucose levels at a 'critical depth' in the skin, specifically in the interstitial fluid located below the stratum corneum but above the underlying adipose tissue layer. The region chosen for routine glucose measurements was the base of the thumb (the thenar). In a small clinical study, 35 patients with diabetes analyzed their interstitial fluid glucose for a period of 60 days using the new critical-depth Raman (CD-Raman) method and levels were correlated to reference capillary blood glucose values using a standard finger-stick and test strip product. The calibration of the CD-Raman system was stable for > 10 days. Measurement performance for glucose levels present at, or below, a depth of ~250μm below the skin surface was comparable to that reported for currently available invasive continuous glucose monitors. In summary, using the CD-Raman technology we have demonstrated the first successful use of a non-invasive glucose monitor in the home.
Conflict of interest statement
Figures


References
-
- International Diabetes Federation. IDF Diabetes Atlas. 7th ed. Brussels, Belgium: International Diabetes Federation; 2015. ISBN: 978-2-930229-81-2. Available from: http://www.diabetesatlas.org.
-
- Vashist SK. Continuous glucose monitoring systems: a review. Diagnostics. 2013; 3:385–412. doi: 10.3390/diagnostics3040385 - DOI - PMC - PubMed
-
- Dungel P, Long N, Yu B, Moussy Y, Moussy F. Study of the effects of tissue reactions on the function of implanted glucose sensors. J Biomed Mater Res Part A. 2007; 85A(3):699–706. - PubMed
-
- Ferrante do Amaral CE, Wolf B. Current development in non-invasive glucose monitoring. Med Eng Phys. 2008; 30:541–549. doi: 10.1016/j.medengphy.2007.06.003 - DOI - PubMed
Publication types
MeSH terms
Substances
LinkOut - more resources
Full Text Sources
Other Literature Sources
Medical
Miscellaneous

