

Nighttime light exposure enhances Rev-erbα-targeting microRNAs and contributes to hepatic steatosis
- PMID: 29751019
- PMCID: PMC6145802
- DOI: 10.1016/j.metabol.2018.05.002
Nighttime light exposure enhances Rev-erbα-targeting microRNAs and contributes to hepatic steatosis
Abstract
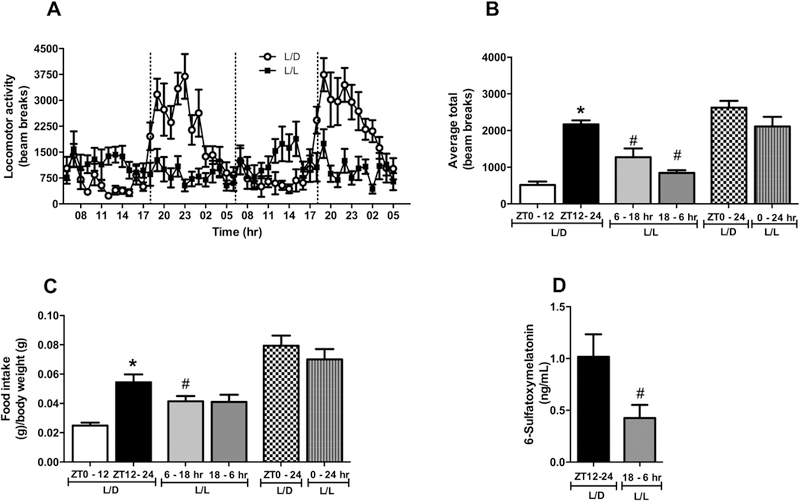
Objective: The exposure to artificial light at night (ALAN) disrupts the biological rhythms and has been associated with the development of metabolic syndrome. MicroRNAs (miRNAs) display a critical role in fine-tuning the circadian system and energy metabolism. In this study, we aimed to assess whether altered miRNAs expression in the liver underlies metabolic disorders caused by disrupted biological rhythms.
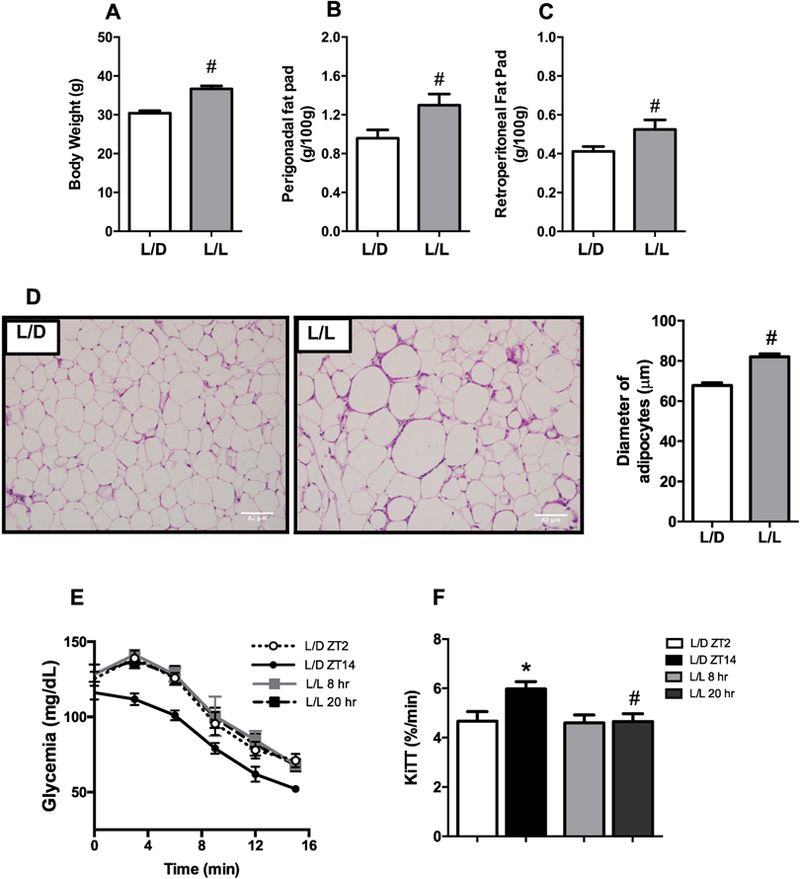
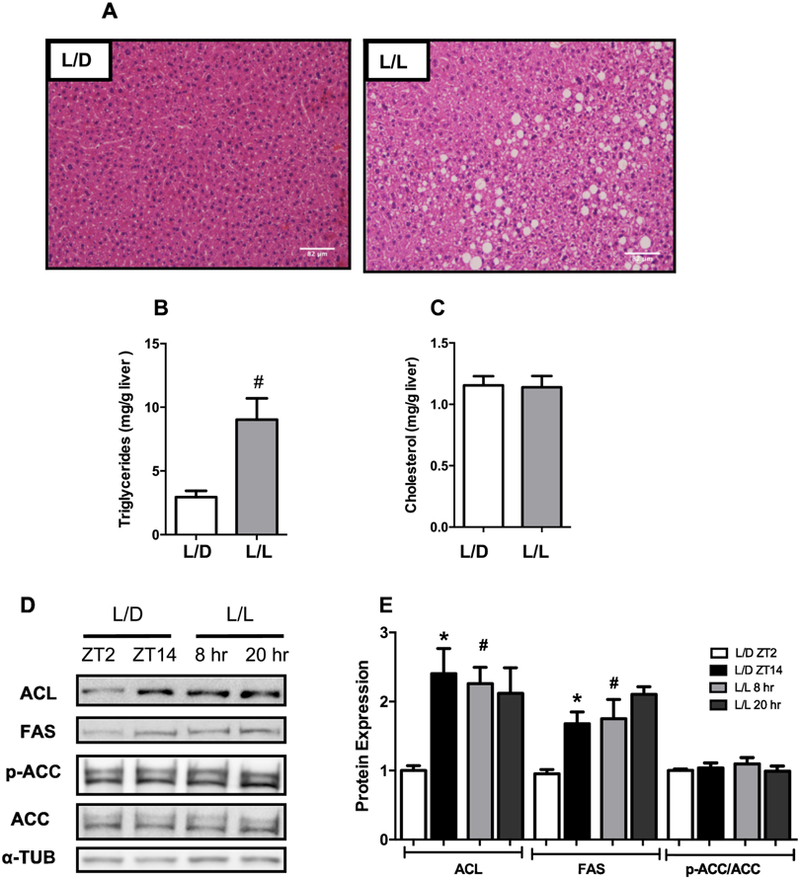
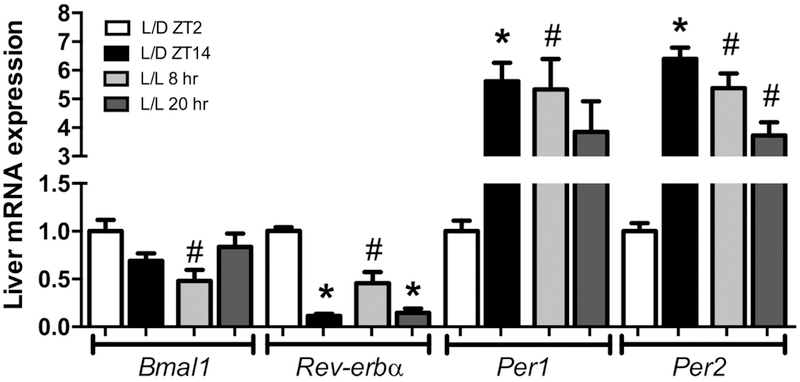
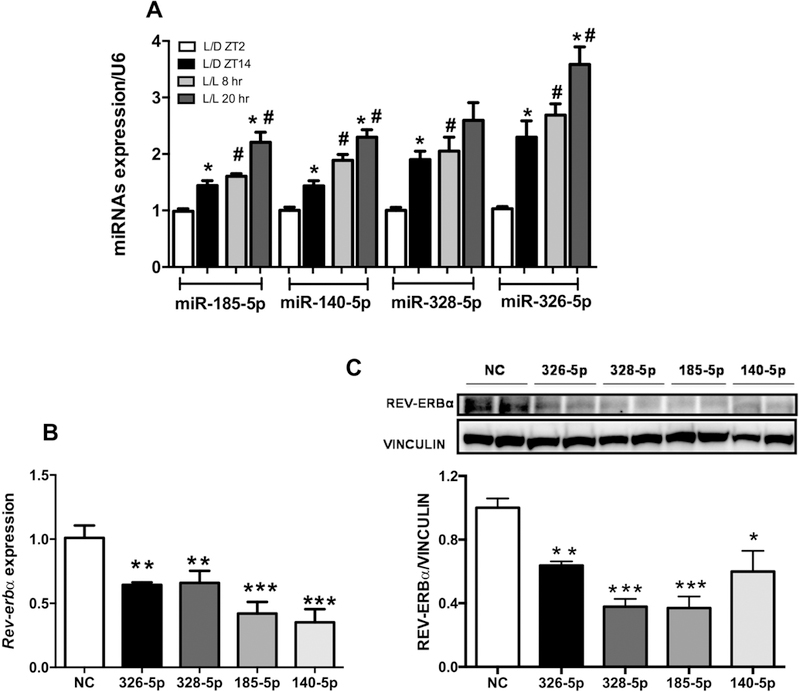
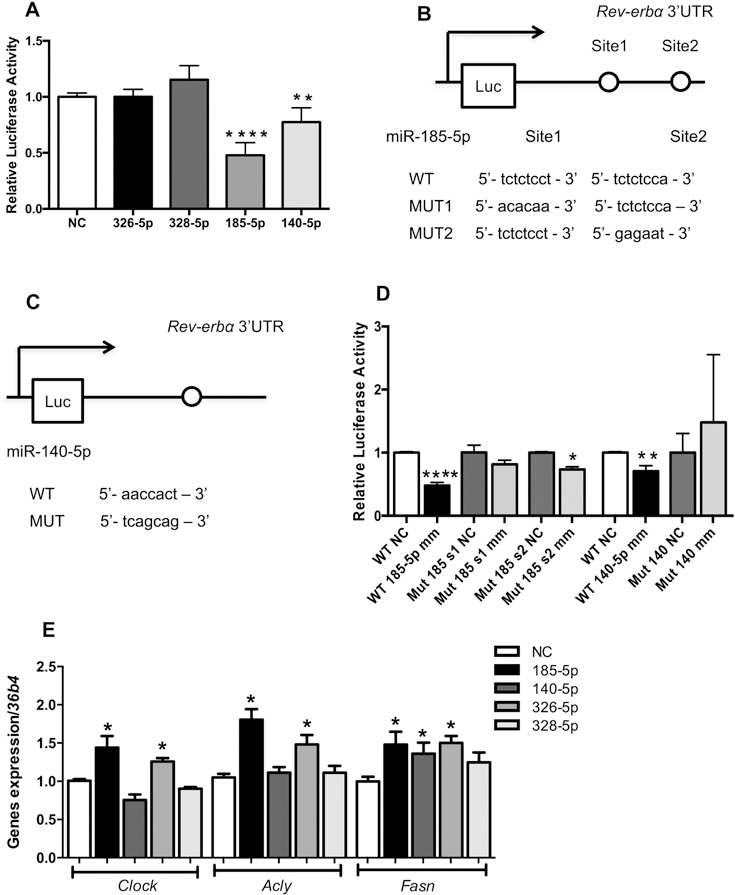
Results: We found that C3H/HePas mice exposed to ALAN developed obesity, and hepatic steatosis, which was paralleled by decreased expression of Rev-erbα and up-regulation of its lipogenic targets ACL and FAS in liver. Furthermore, the expression of Rev-erbα-targeting miRNAs, miR-140-5p, 185-5p, 326-5p and 328-5p were increased in this group. Consistently, overexpression of these miRNAs in primary hepatocytes reduced Rev-erbα expression at the mRNA and protein levels. Importantly, overexpression of Rev-erbα-targeting miRNAs increased mRNA levels of Acly and Fasn.
Conclusion: Thus, altered miRNAs profile is an important mechanism underlying the disruption of the peripheral clock caused by exposure to ALAN, which could lead to hepatic steatosis.
Keywords: Clock genes; De novo lipogenesis; Exposure to artificial light at night; Hepatic steatosis; microRNAs.
Copyright © 2018 Elsevier Inc. All rights reserved.
Conflict of interest statement
Conflict of interest
All contributing authors declare no conflicts of interest.
Figures
Similar articles
-
The nuclear receptor REV-ERBα is required for the daily balance of carbohydrate and lipid metabolism.FASEB J. 2012 Aug;26(8):3321-35. doi: 10.1096/fj.12-208751. Epub 2012 May 4. FASEB J. 2012. PMID: 22562834
-
Multiple mechanisms regulate circadian expression of the gene for cholesterol 7alpha-hydroxylase (Cyp7a), a key enzyme in hepatic bile acid biosynthesis.J Biol Rhythms. 2007 Aug;22(4):299-311. doi: 10.1177/0748730407302461. J Biol Rhythms. 2007. PMID: 17660447
-
Circadian and glucocorticoid regulation of Rev-erbalpha expression in liver.Endocrinology. 2000 Oct;141(10):3799-806. doi: 10.1210/endo.141.10.7708. Endocrinology. 2000. PMID: 11014236
-
Role of the clock gene Rev-erbα in metabolism and in the endocrine pancreas.Diabetes Obes Metab. 2015 Sep;17 Suppl 1:106-14. doi: 10.1111/dom.12522. Diabetes Obes Metab. 2015. PMID: 26332975 Review.
-
Circadian epigenomic remodeling and hepatic lipogenesis: lessons from HDAC3.Cold Spring Harb Symp Quant Biol. 2011;76:49-55. doi: 10.1101/sqb.2011.76.011494. Epub 2011 Sep 6. Cold Spring Harb Symp Quant Biol. 2011. PMID: 21900149 Free PMC article. Review.
Cited by
-
Monochromatic Light Pollution Exacerbates High-Fat Diet-Induced Adipocytic Hypertrophy in Mice.Cells. 2022 Nov 28;11(23):3808. doi: 10.3390/cells11233808. Cells. 2022. PMID: 36497068 Free PMC article.
-
Googling Insomnia, Light, Metabolism, and Circadian: A Population Interest Simple Report.Brain Sci. 2022 Dec 8;12(12):1683. doi: 10.3390/brainsci12121683. Brain Sci. 2022. PMID: 36552143 Free PMC article.
-
Non-coding RNA crosstalk with nuclear receptors in liver disease.Biochim Biophys Acta Mol Basis Dis. 2021 May 1;1867(5):166083. doi: 10.1016/j.bbadis.2021.166083. Epub 2021 Jan 24. Biochim Biophys Acta Mol Basis Dis. 2021. PMID: 33497819 Free PMC article. Review.
-
Effects of Illumination Color on Hypothalamic Appetite-Regulating Gene Expression and Glycolipid Metabolism.Nutrients. 2024 Dec 15;16(24):4330. doi: 10.3390/nu16244330. Nutrients. 2024. PMID: 39770951 Free PMC article.
-
REV-ERBα inhibitor rescues MPTP/MPP+-induced ferroptosis of dopaminergic neuron through regulating FASN/SCD1 signaling pathway.Heliyon. 2024 Nov 15;10(23):e40388. doi: 10.1016/j.heliyon.2024.e40388. eCollection 2024 Dec 15. Heliyon. 2024. PMID: 39654780 Free PMC article.
References
-
- Takahashi JS. Circadian clock genes are ticking. Science 1992;258:238–40. - PubMed
-
- Buijs RM, Kalsbeek A. Hypothalamic integration of central and peripheral clocks. Nat Rev Neurosci 2001;2:521–6. - PubMed
-
- Dibner C, Schibler U, Albrecht U. The mammalian circadian timing system: organization and coordination of central and peripheral clocks. Annu Rev Physiol 2010;72:517–49. - PubMed
Publication types
MeSH terms
Substances
Grants and funding
LinkOut - more resources
Full Text Sources
Other Literature Sources
Research Materials
Miscellaneous
