. 2018 May 11;15(5):966.
doi: 10.3390/ijerph15050966.

A Simulation-Based Study on the Comparison of Statistical and Time Series Forecasting Methods for Early Detection of Infectious Disease Outbreaks

Affiliations

A Simulation-Based Study on the Comparison of Statistical and Time Series Forecasting Methods for Early Detection of Infectious Disease Outbreaks

Eunjoo Yang et al. Int J Environ Res Public Health. .

Abstract

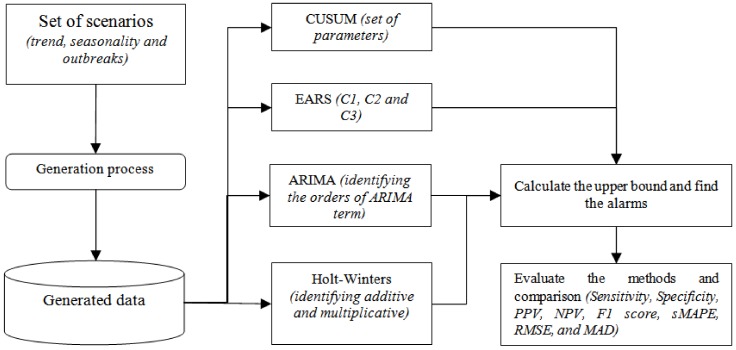
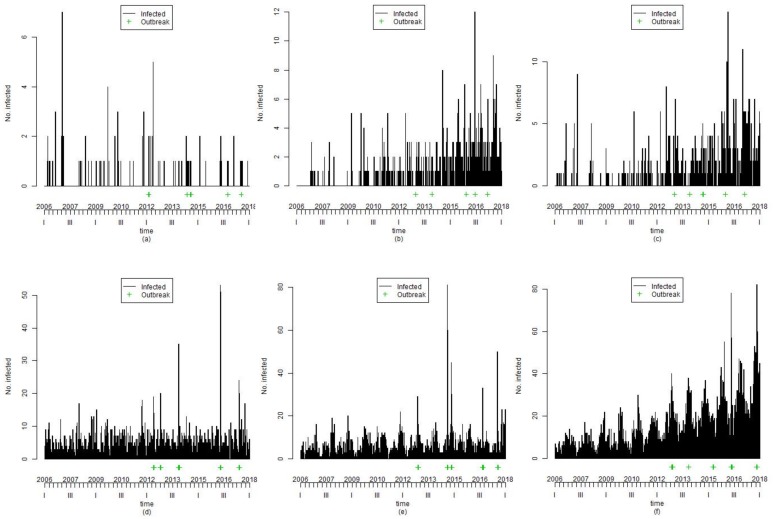
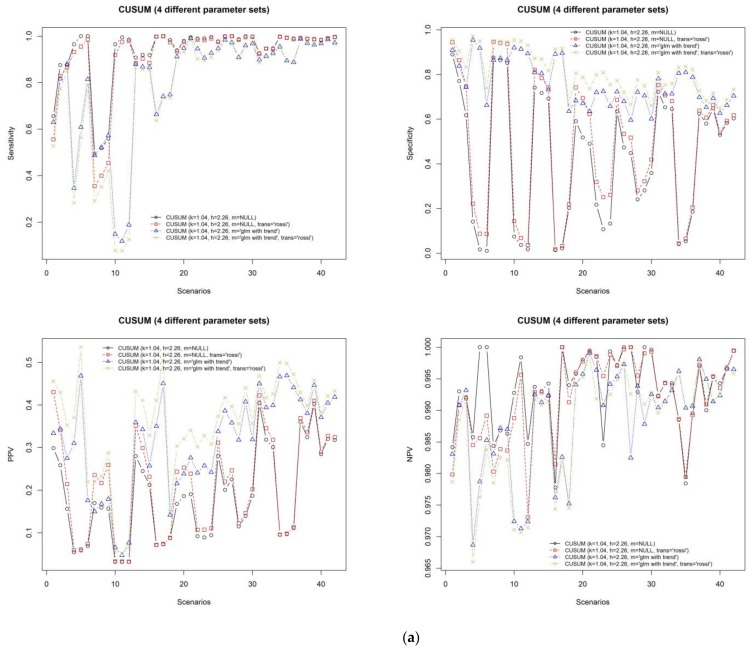
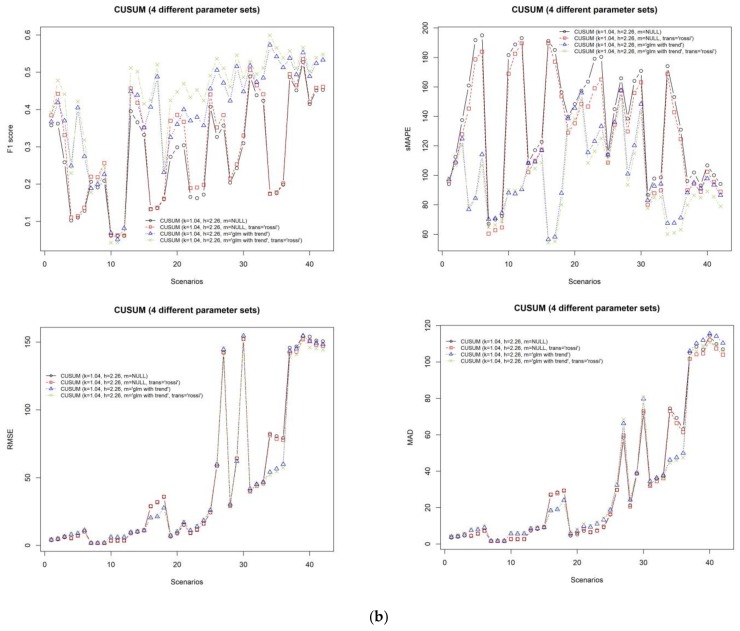
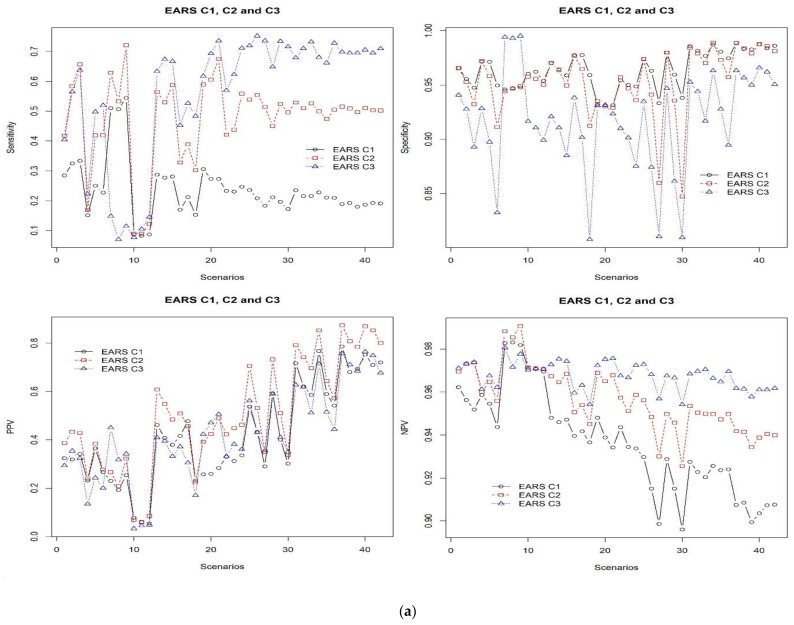
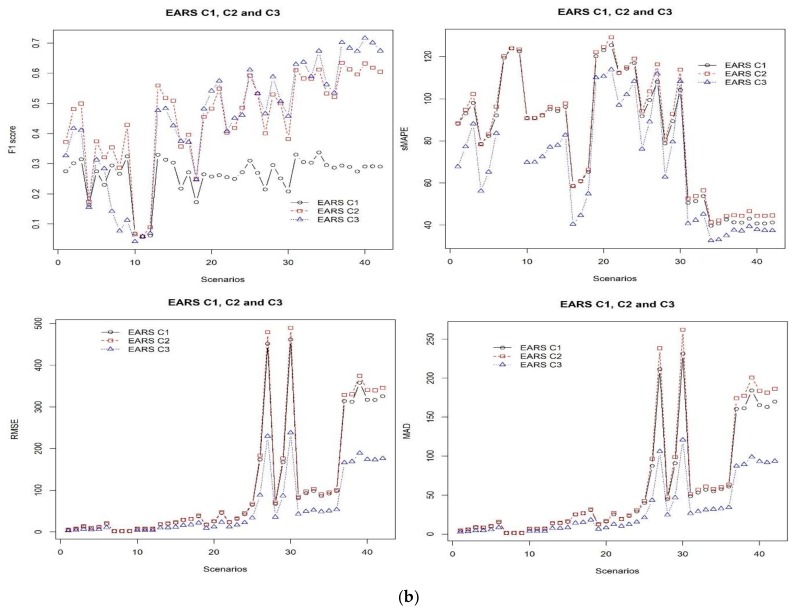
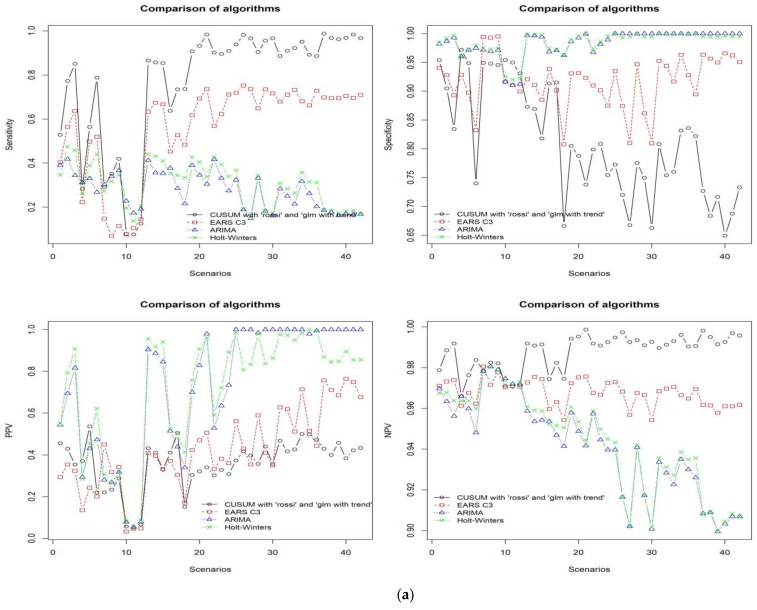
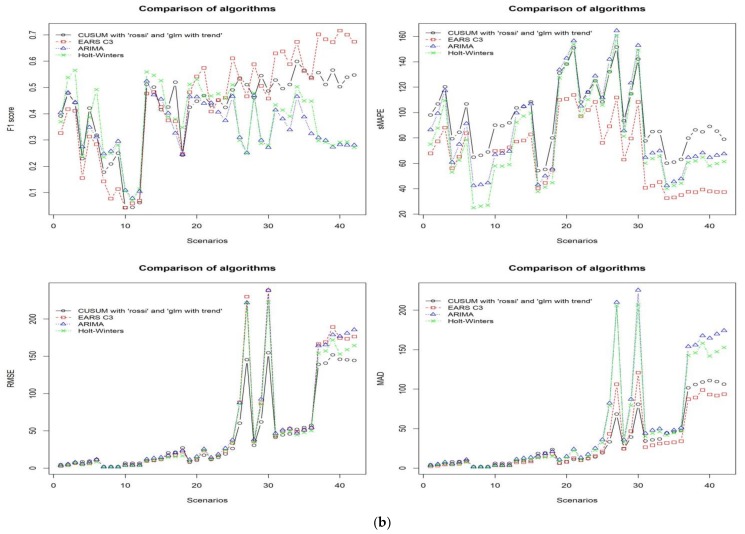
Early detection of infectious disease outbreaks is one of the important and significant issues in syndromic surveillance systems. It helps to provide a rapid epidemiological response and reduce morbidity and mortality. In order to upgrade the current system at the Korea Centers for Disease Control and Prevention (KCDC), a comparative study of state-of-the-art techniques is required. We compared four different temporal outbreak detection algorithms: the CUmulative SUM (CUSUM), the Early Aberration Reporting System (EARS), the autoregressive integrated moving average (ARIMA), and the Holt-Winters algorithm. The comparison was performed based on not only 42 different time series generated taking into account trends, seasonality, and randomly occurring outbreaks, but also real-world daily and weekly data related to diarrhea infection. The algorithms were evaluated using different metrics. These were namely, sensitivity, specificity, positive predictive value (PPV), negative predictive value (NPV), F1 score, symmetric mean absolute percent error (sMAPE), root-mean-square error (RMSE), and mean absolute deviation (MAD). Although the comparison results showed better performance for the EARS C3 method with respect to the other algorithms, despite the characteristics of the underlying time series data, Holt⁻Winters showed better performance when the baseline frequency and the dispersion parameter values were both less than 1.5 and 2, respectively.

Keywords: aberration detection; outbreak detection; syndromic diarrhea; syndromic surveillance.


Conflict of interest statement

The authors declare no conflict of interest.

Figures

Figure 1
Figure 1
Framework for comparing the outbreak detection algorithms. EARS: Early Aberration Reporting System; ARIMA: auto regressive integrated moving average; PPV: positive predictive value; NPV: negative predictive value; sMAPE: symmetric mean absolute percent error; RMSE: root-mean-square error; MAD: mean absolute deviation; CUSUM: CUmulative SUM.
Figure 2
Figure 2
Examples of simulated data: (a) Scenario 8; (b) Scenario 10; (c) Scenario 12; (d) Scenario 13; (e) Scenario 15; and (f) Scenario 17. In each graph, the x-axis represents time, the y-axis represents the number of infections, and the green-colored plus sign resembles outbreaks.
Figure 3
Figure 3
(a) The results of the four different CUSUM algorithms with different sets of parameters in terms of sensitivity, specificity, PPV, and NPV across the all scenarios. (b) The results of the four different CUSUM algorithms with different sets of parameters in terms of F1 score, sMAPE, RMSE, and MAD across the all scenarios. CUSUM: the CUmulative SUM.
Figure 3
Figure 3
(a) The results of the four different CUSUM algorithms with different sets of parameters in terms of sensitivity, specificity, PPV, and NPV across the all scenarios. (b) The results of the four different CUSUM algorithms with different sets of parameters in terms of F1 score, sMAPE, RMSE, and MAD across the all scenarios. CUSUM: the CUmulative SUM.
Figure 4
Figure 4
(a) The results of comparing EARS C1, C2, and C3 in terms of sensitivity, specificity, PPV, and NPV across the all scenarios. EARS C3 showed better performance in almost all cases. (b) The results of comparing EARS C1, C2, and C3 in terms of F1 score, sMAPE, RMSE, and MAD across the all scenarios. EARS C3 showed better performance in almost all cases as it showed lower values of sMAPE, RMSE, and MAD, and higher values of F1 score.
Figure 4
Figure 4
(a) The results of comparing EARS C1, C2, and C3 in terms of sensitivity, specificity, PPV, and NPV across the all scenarios. EARS C3 showed better performance in almost all cases. (b) The results of comparing EARS C1, C2, and C3 in terms of F1 score, sMAPE, RMSE, and MAD across the all scenarios. EARS C3 showed better performance in almost all cases as it showed lower values of sMAPE, RMSE, and MAD, and higher values of F1 score.
Figure 5
Figure 5
(a) The results of comparing CUSUM, EARS C3, ARIMA, and Holt-Winters in terms of sensitivity, specificity, PPV, and NPV across the all scenarios. (b) The results of comparing CUSUM, EARS C3, ARIMA, and Holt-Winters in terms of F1 score, sMAPE, RMSE, and MAD across the all scenarios.
Figure 5
Figure 5
(a) The results of comparing CUSUM, EARS C3, ARIMA, and Holt-Winters in terms of sensitivity, specificity, PPV, and NPV across the all scenarios. (b) The results of comparing CUSUM, EARS C3, ARIMA, and Holt-Winters in terms of F1 score, sMAPE, RMSE, and MAD across the all scenarios.

References

    1. Yan P., Chen H., Zeng D. Syndromic surveillance systems. Annu. Rev. Inf. Sci. Technol. 2008;42:425–495.
    1. World Health Organization . Global Framework for Immunization Monitoring and Surveillance: GFIMS. World Health Organization; Geneva, Swizerland: 2007. - PMC - PubMed
    1. Geoffrey P.G., James J.J. HIV, Resurgent Infections and Population Change in Africa. Springer; Dordrecht, The Netherlands: 2007. The Impact of Population Growth on the Epidemiology and Evolution of Infectious Diseases; pp. 27–40.
    1. Shmueli G., Burkom H.S. Statistical challenges facing early outbreak detection in biosurveillance. Technometrics. 2010;52:39–51.
    1. Allard R. Use of time-series analysis in infectious disease surveillance. Bull. World Health Organ. 1998;76:327–333. - PMC - PubMed

Publication types

LinkOut - more resources