. 2018 May 15;48(5):1014-1028.e6.
doi: 10.1016/j.immuni.2018.04.006. Epub 2018 May 8.

Single-Cell RNA Sequencing of Lymph Node Stromal Cells Reveals Niche-Associated Heterogeneity

Affiliations

Single-Cell RNA Sequencing of Lymph Node Stromal Cells Reveals Niche-Associated Heterogeneity

Lauren B Rodda et al. Immunity. .

Abstract

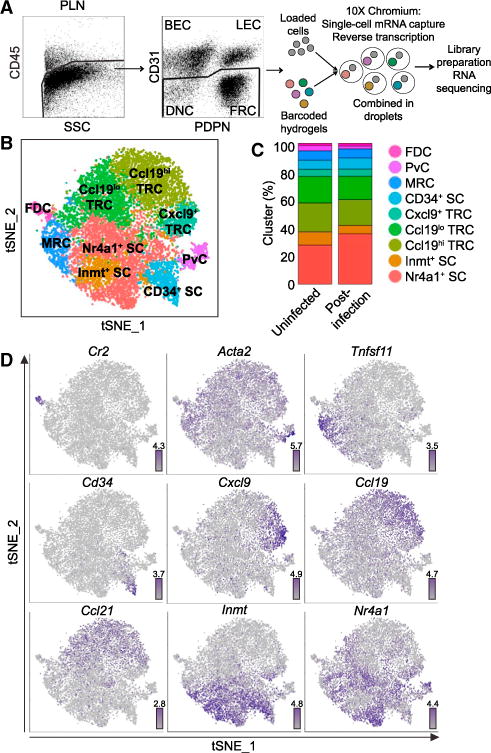
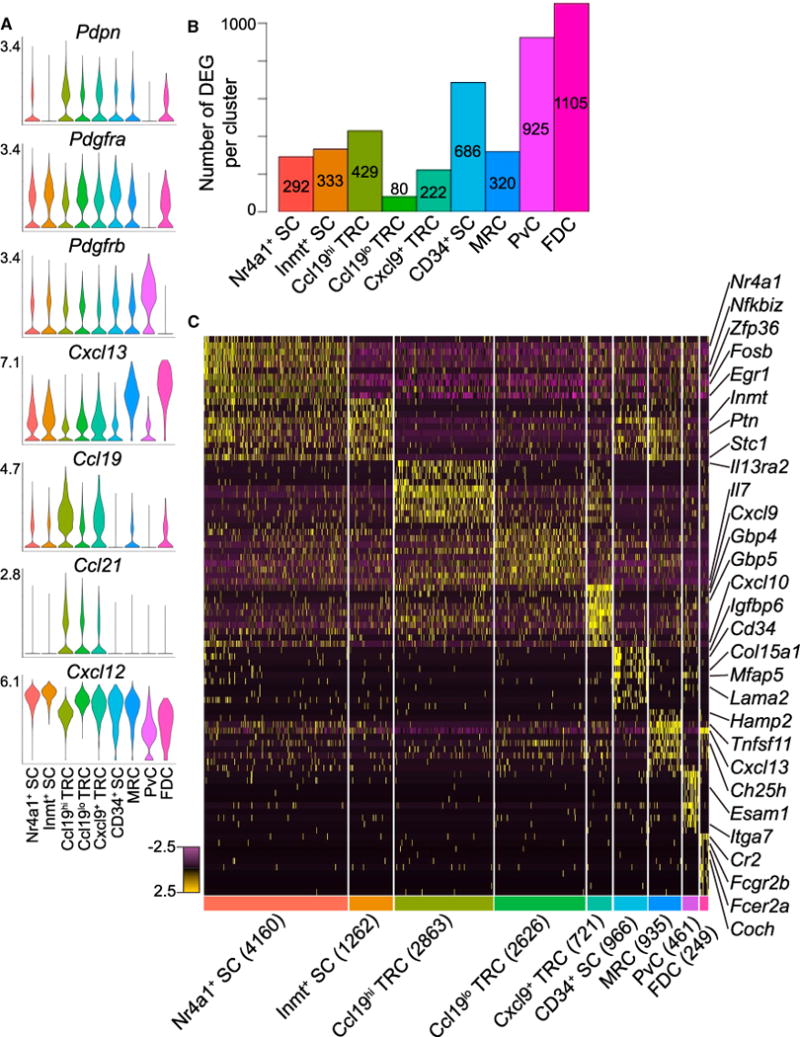
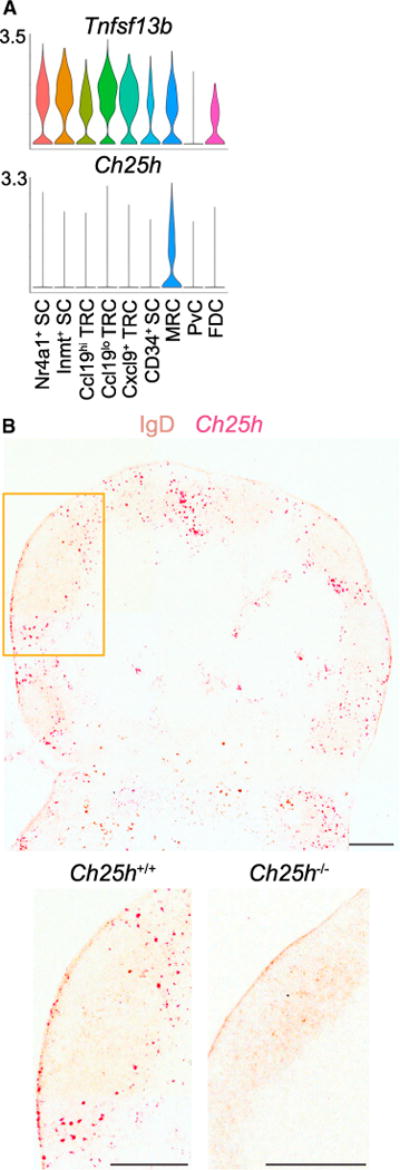
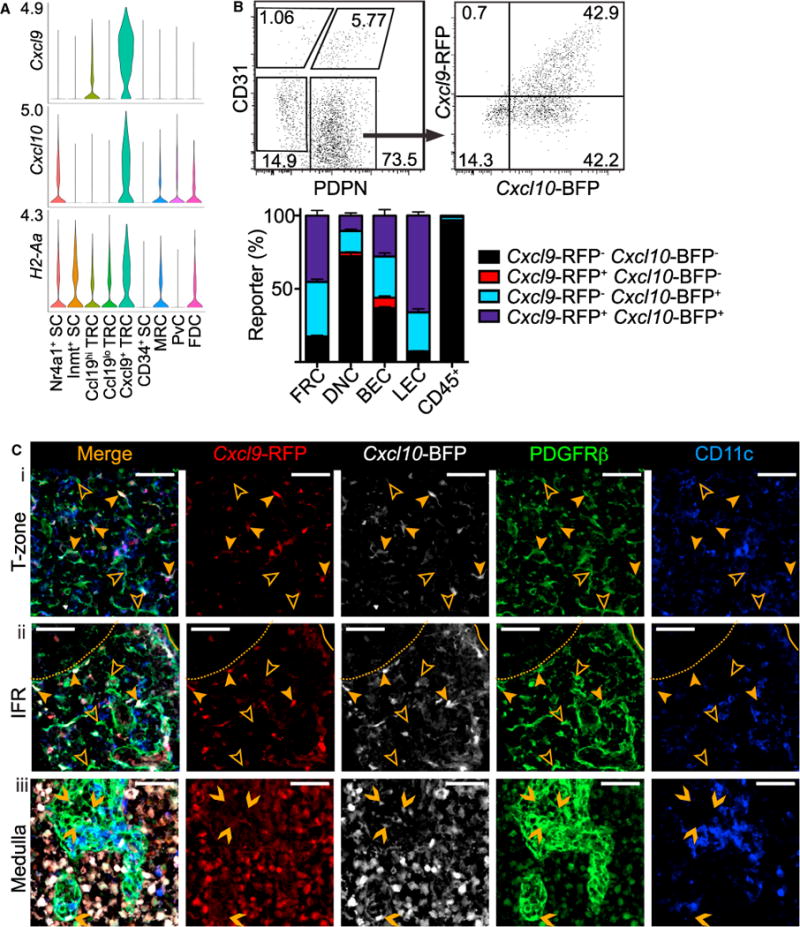
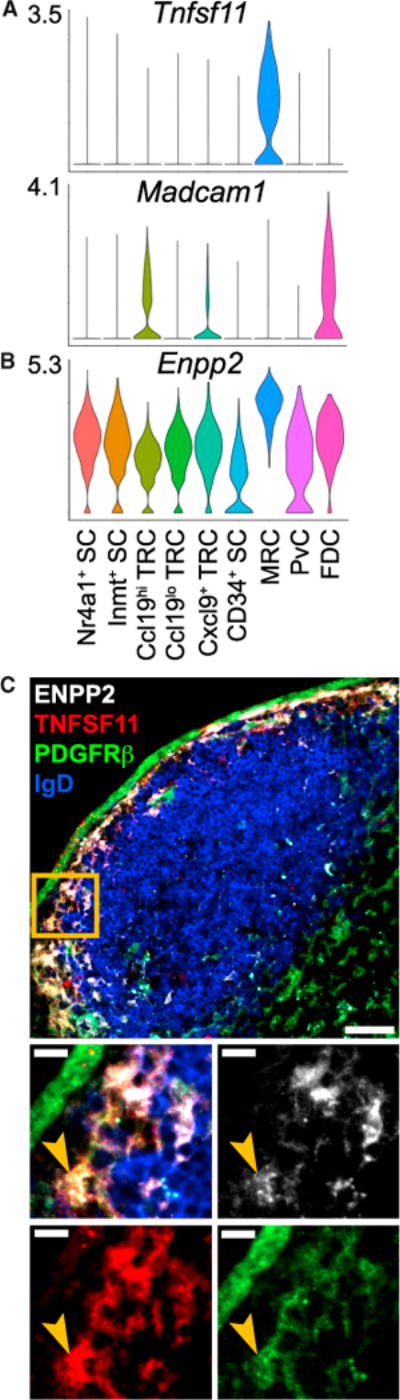
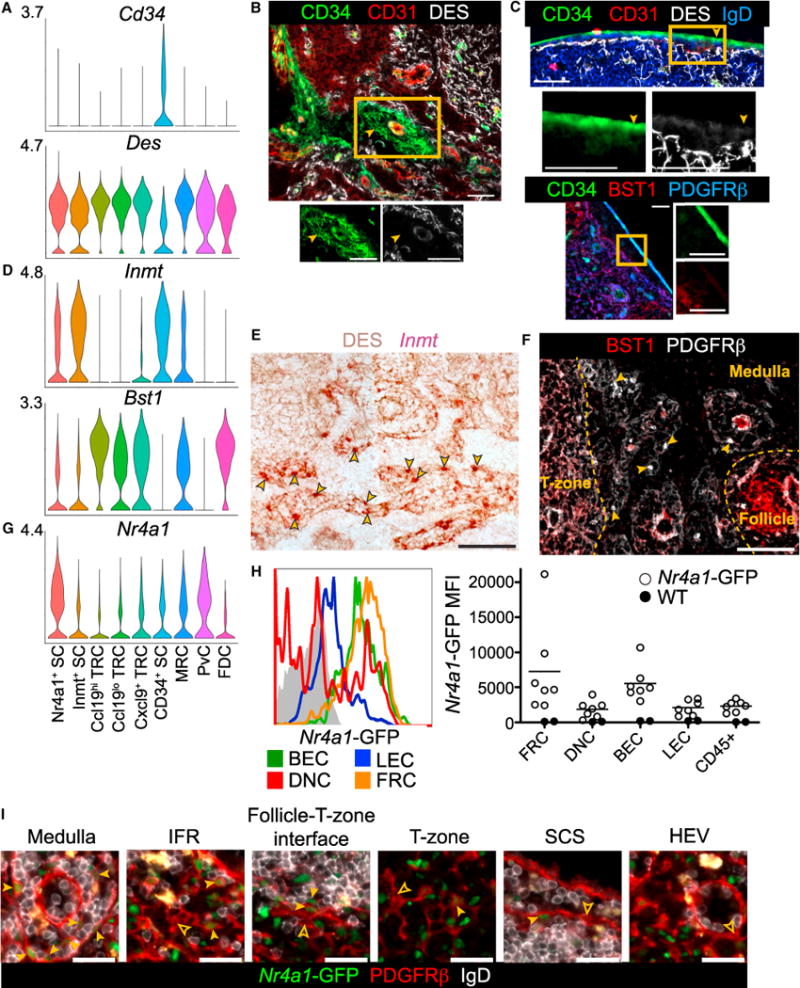
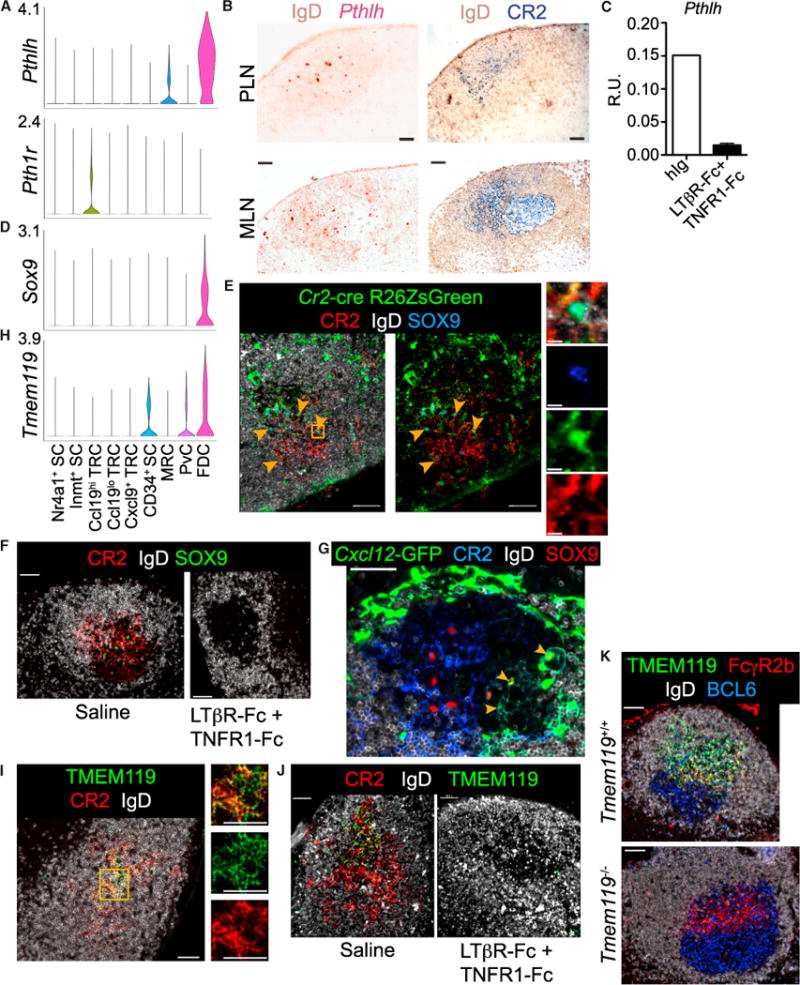
Stromal cells (SCs) establish the compartmentalization of lymphoid tissues critical to the immune response. However, the full diversity of lymph node (LN) SCs remains undefined. Using droplet-based single-cell RNA sequencing, we identified nine peripheral LN non-endothelial SC clusters. Included are the established subsets, Ccl19hi T-zone reticular cells (TRCs), marginal reticular cells, follicular dendritic cells (FDCs), and perivascular cells. We also identified Ccl19lo TRCs, likely including cholesterol-25-hydroxylase+ cells located at the T-zone perimeter, Cxcl9+ TRCs in the T-zone and interfollicular region, CD34+ SCs in the capsule and medullary vessel adventitia, indolethylamine N-methyltransferase+ SCs in the medullary cords, and Nr4a1+ SCs in several niches. These data help define how transcriptionally distinct LN SCs support niche-restricted immune functions and provide evidence that many SCs are in an activated state.

Keywords: double negative cell; fibroblastic reticular cell; follicular dendritic cell; marginal reticular cell; perivascular cell; single-cell RNA sequencing; stromal cell.


Conflict of interest statement

DECLARATION OF INTERESTS

The authors declare no competing interests.

Figures

Figure 1
Figure 1. Identification of Nine pLN Non-endothelial SC Clusters by scRNAseq
(A) Droplet-based scRNAseq workflow. (B) Unsupervised clustering of pLN non-endothelial SCs visualized with tSNE. Each point is a single cell colored by cluster assignment. (C) Percent of the nine clusters in two samples: Uninfected and day 15 post-LCMV infection (Post-infection). (D) Gene expression distinguishing the nine clusters projected onto tSNE plots. Color scaled for each gene with highest log-normalized expression level noted. See also Figure S1.
Figure 2
Figure 2. Differential Gene Expression for Nine pLN Non-endothelial SC Clusters
(A) Violin plots of canonical SC gene expression by cluster with highest log-normalized expression value labeled. (B) Number of DEGs per cluster. (C) Heatmap of each cell’s (columns) expression of the top ten DEGs per cluster (rows). Select genes are labeled. Log-normalized expression scaled for each gene. Cluster name and number of cells per cluster displayed below. See also Figure S2.
Figure 3
Figure 3. Ch25h-Expressing Ccl19lo TRCs Populate the Follicle-T-Zone Interface and IFRs
(A) Violin plots of cluster Tnfsf13b and Ch25h expression. (B) RNAscope for Ch25h on Ch25h+/+ (box indicates enlarged area) and Ch25h−/− (enlarged only) pLNs counterstained for IgD. Representative of three mice per genotype. Scale bar is 200 μm. See also Figure S3.
Figure 4
Figure 4. Cxcl9+ TRCs Are Located in the T-Zone and IFRs
(A) Violin plots of cluster Cxcl9, Cxcl10, and H2-Aa expression. (B) Representative gating and percent of REX3 pLN FRCs, DNCs, BECs, and LECs expressing Cxcl9-RFP and/or Cxcl10-BFP, both or neither by FC. Mean and SEM indicated (n = 3). (C) IFM of REX3 pLN (i) T-zone, (ii) IFR, and (iii) medulla stained for PDGFRβ+CD11c SCs (representative of 3 mice). Examples of Cxcl9-RFP+ Cxcl10-BFP+ SCs (filled arrowhead), Cxcl9-RFP Cxcl10-BFP SCs (empty arrowhead), and Cxcl9-RFP Cxcl10-BFP+ SCs (chevron) indicated. Scale bar is 50 μm.
Figure 5
Figure 5. Tnfsf11+ MRCs Express Enpp2 in the SCS
(A and B) Violin plots of cluster Tnfsf11 (A), Madcam1 (A), and (B) Enpp2 expression. (C) IFM of pLN SCS stained for ENPP2 and TNFSF11+PDGFRβ+IgD MRCs (representative of 3 mice). Scale bar is 50 μm. Box indicates area shown in merged and single channel images beneath. Arrowhead indicates example ENPP2+ MRC. Scale bar is 10 μm.
Figure 6
Figure 6. Characterization of CD34+ SCs, Inmt+ SCs, and Nr4a1+ SCs
(A) Violin plots of cluster Cd34 and Des expression. (B and C) IFM of pLN medulla (B) and capsule (C) for CD34+ cells with co-stains indicated. Filled arrowheads indicate examples of CD34+DES staining. Box indicates area shown with individual channels (representative of 3 mice). (D) Violin plots of cluster Inmt and Bst1 expression. (E) RNAscope for Inmt with DES counterstain on pLN medullary cords (representative of 3 mice). Arrowheads indicate examples of Inmt+ cells. (F) IFM of BST1 and PDGFRβ on pLN medullary cords (representative of 3 mice). Arrowheads indicate examples of BST1 PDGFRβ+ SCs and yellow dotted lines mark the niche boundaries. (G) Violin plot of cluster Nr4a1 expression. (H) GFP MFI of Nr4a1-GFP pLN FRCs, DNCs, BECs, LECs, and CD45+ cells detected by FC (n = 7, 3 experiments). (I) IFM of Nr4a1-GFP pLN niches for PDGFRβ+GFP+IgD SCs (filled arrowheads) and PDGFRβ+GFPIgD SCs (empty arrowheads) (representative of 2 mice). Scale bar is 50 μm in (B), (C), (E), and (F) and 25 μm in (I). See also Figure S5.
Figure 7
Figure 7. FDCs Express Pthlh and Tmem119 while FDCs and CRCs Express Sox9
(A) Violin plot of cluster Pthlh and Pth1r expression. (B) RNAscope for Pthlh with IgD counterstain on pLN primary follicle and mLN GC. Sequential stains for CR2hi FDCs and IgD (representative of 2 mice). (C) QPCR of pLN Pthlh expression from mice treated 1 or 2 times with LTβR-Fc and TNFR1-Fc (n = 2) or once with human IgG (hIg) (n = 1) (R.U. = relative units). (D) Violin plot of cluster Sox9 expression. (E) IFM of Cr2-cre R26ZsGreen reverse BM chimera pLN follicle (representative of 2 mice). Arrowheads indicate examples of CR2hiZsGreen+SOX9+ FDCs. Box indicates area shown with merged and individual channels. Scale bar is 10 μm. (F) IFM of SOX9+ cells among CR2hi FDC networks in pLN GC from mice immunized with SRBC and on day 10 treated with LTβR-Fc and TNFR1-Fc or saline for analysis on day 14 (representative of 6 pLNs from 1 mouse per treatment). (G) Thick-section IFM of Cxcl12-GFP pLN GCs day 10 post-SRBC immunization (representative of 6 pLNs from 1 mouse per treatment). Arrowheads indicate Cxcl12-GFP+SOX9+CR2lo CRCs. (H) Violin plot of cluster Tmem119 expression. (I) IFM of pLN primary follicle TMEM119+CR2hi FDCs (representative of 2 mice). Box indicates area shown with individual channels. (J) IFM of TMEM119 on CR2hi FDCs in pLN GCs post-immunization and treatment as in (F) (representative of 6 pLN from 1 mouse per treatment). (K) IFM of TMEM119 on FcγR2b+ FDCs in BCL6+ pLN GCs from Tmem119+/+ and Tmem119−/− mice on day 11 post-NP-CGG immunization (representative of 2 mice per genotype). Scale bars are 50 μm unless otherwise noted. See also Figure S6.

References

    1. Acton SE, Farrugia AJ, Astarita JL, Mourão-Sá D, Jenkins RP, Nye E, Hooper S, van Blijswijk J, Rogers NC, Snelgrove KJ, et al. Dendritic cells control fibroblastic reticular network tension and lymph node expansion. Nature. 2014;514:498–502. - PMC - PubMed
    1. Allen CDC, Cyster JG. Follicular dendritic cell networks of primary follicles and germinal centers: phenotype and function. Semin Immunol. 2008;20:14–25. - PMC - PubMed
    1. Allen CDC, Okada T, Tang HL, Cyster JG. Imaging of germinal center selection events during affinity maturation. Science. 2007;315:528–531. - PubMed
    1. Ara T, Tokoyoda K, Sugiyama T, Egawa T, Kawabata K, Nagasawa T. Long-term hematopoietic stem cells require stromal cell-derived factor-1 for colonizing bone marrow during ontogeny. Immunity. 2003;19:257–267. - PubMed
    1. Armulik A, Genové G, Betsholtz C. Pericytes: developmental, physiological, and pathological perspectives, problems, and promises. Dev Cell. 2011;21:193–215. - PubMed

Publication types

MeSH terms

Substances