. 2018 Jul;28(7):1053-1066.
doi: 10.1101/gr.223925.117. Epub 2018 May 11.

Single-cell RNA-seq of human induced pluripotent stem cells reveals cellular heterogeneity and cell state transitions between subpopulations

Affiliations

Single-cell RNA-seq of human induced pluripotent stem cells reveals cellular heterogeneity and cell state transitions between subpopulations

Quan H Nguyen et al. Genome Res. 2018 Jul.

Abstract

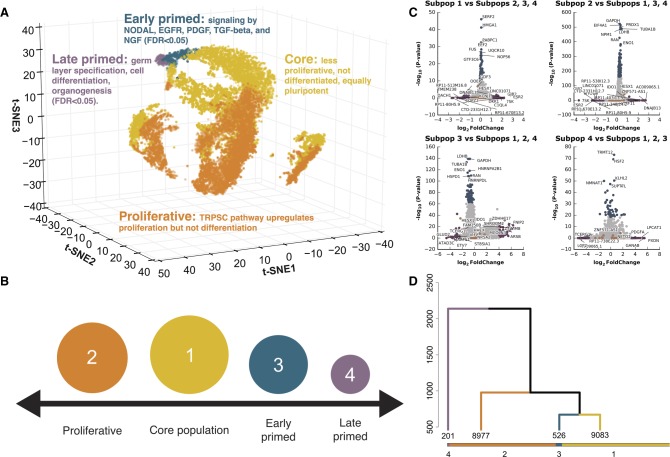
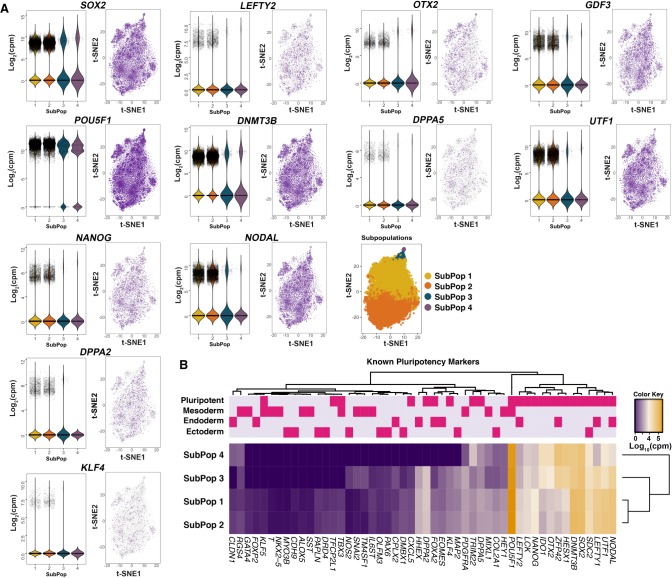
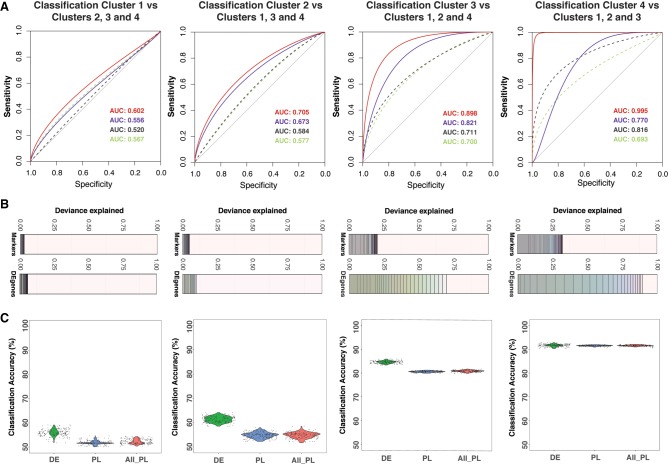
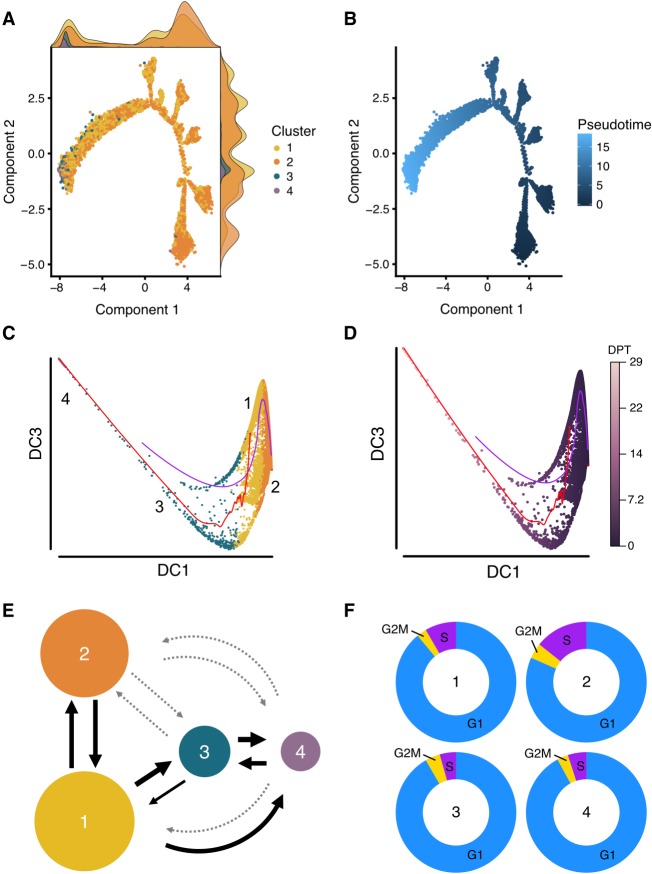
Heterogeneity of cell states represented in pluripotent cultures has not been described at the transcriptional level. Since gene expression is highly heterogeneous between cells, single-cell RNA sequencing can be used to identify how individual pluripotent cells function. Here, we present results from the analysis of single-cell RNA sequencing data from 18,787 individual WTC-CRISPRi human induced pluripotent stem cells. We developed an unsupervised clustering method and, through this, identified four subpopulations distinguishable on the basis of their pluripotent state, including a core pluripotent population (48.3%), proliferative (47.8%), early primed for differentiation (2.8%), and late primed for differentiation (1.1%). For each subpopulation, we were able to identify the genes and pathways that define differences in pluripotent cell states. Our method identified four transcriptionally distinct predictor gene sets composed of 165 unique genes that denote the specific pluripotency states; using these sets, we developed a multigenic machine learning prediction method to accurately classify single cells into each of the subpopulations. Compared against a set of established pluripotency markers, our method increases prediction accuracy by 10%, specificity by 20%, and explains a substantially larger proportion of deviance (up to threefold) from the prediction model. Finally, we developed an innovative method to predict cells transitioning between subpopulations and support our conclusions with results from two orthogonal pseudotime trajectory methods.


Figures

Figure 1.
Figure 1.
Identification of four cell subpopulations from 18,787 hiPSC cells, sequenced from five biological replicates. (A) Three-dimensional t-SNE distribution of cells based on gene expression value. Each point represents a single cell in three-dimensional space. A t-SNE transformation of the data was used for positioning cells; four cell subpopulation labels (marked by different colors) represent results from clustering and are independent of t-SNE data transformation (for an interactive, searchable figure, see http://computationalgenomics.com.au/shiny/hipsc/). Pathway analysis based on differential expression identified functional properties that distinguish each subpopulation. (B) Four pluripotent subpopulations functionally separated from a homogeneous hiPSC population. (C) The top significantly differentially expressed genes of cells in a subpopulation compared to cells in the remaining three subpopulations. Genes denoted with orange points are known naive and primed markers. Genes represented with blue and purple points are those in the top 0.5% highest logFC or −log(P-value), respectively. (D) Unsupervised clustering of all cells into four subpopulations. The dendrogram tree displays distance and agglomerative clustering of the cells. Each branch represents one subpopulation. The clustering is based on a Dynamic Tree Cut that performs a bottom-up merging of similar branches. The number of cells in each of the four subpopulations are given below the branches.
Figure 2.
Figure 2.
Expression levels of known pluripotency and lineage-primed markers. (A) Violin and jitter plots and t-SNE plots for expression of top pluripotency markers. Each point represents a single cell. The color gradient in the t-SNE plot represents the relative expression level of the gene in a cell across the whole population and subpopulations: (light gray) low; (dark purple) high. (B) Heatmap of the mean expression of known markers within each subpopulation. The upper panel shows the classifications of genes into pluripotency and lineage-primed markers.
Figure 3.
Figure 3.
Selection of significant gene predictors for classifying each subpopulation using LASSO regression. (A) For each subpopulation, a LASSO model was run using a set of differentially expressed (DE) genes and another set of known markers. Dashed lines are receiver operating characteristic (ROC) curves for models using known markers. Continuous lines are for models using differentially expressed genes. The text shows corresponding area under the curve (AUC) values for ROC curves. For each case (known markers or DE genes), a model with the lowest AUC and another model with the highest AUC are given. Lower AUC values (and ROC curves) in the prediction models using known markers suggested that the models using DE genes performed better in sensitivity and specificity. (B) Each deviance plot shows the deviance explained (x-axis) by a set of gene predictors (numbers of genes is shown as vertical lines and varies from 1 to maximum value as the total number of gene input or to the minimum number of genes that can explain most of the deviance). The remaining space between the last gene and 1.0 border represents deviance not explained by the genes in the model. (C) Classification accuracy calculated using a bootstrap method using all known markers (both pluripotent markers and primed lineage markers) or markers from our differentially expressed gene list is shown. Expression of LASSO-selected genes for subpopulation one and subpopulation two is shown in Supplemental Figure S7. The x-axis labels are for three cases: using LASSO-selected differentially expressed genes (DE); LASSO-selected pluripotency/lineage-primed markers (PL); and all pluripotency/lineage-primed markers (All PL).
Figure 4.
Figure 4.
Trajectory and cell cycle membership analysis. Cell differentiation potential was mapped using two pseudotime approaches implemented in Monocle 2 and Destiny and a novel transition estimation method. (A) The results of the Monocle 2 analysis, colored by subpopulation, and the normalized density of the cells in each location along the trajectory is shown as a density curve in the x and y plot margins. (B) The differentiation distance from the root cell to the terminal state, for which the dark blue represents the beginning (the root) and light blue represents the end (the most distant cells from the root) of the pseudotime differentiation pathway. (C,D) The results of diffusion pseudotime analysis, colored by cluster (C) and by diffusion pseudotime (D). DC refers to diffusion component, and DPT refers to diffusion pseudotime. The red and blue pathways in C and D represent the transition path from cell to cell calculated by a random-walk algorithm. (E) We developed a novel approach that uses the LASSO classifier to quantify directional transitions between subpopulations. The percent of transitioning cells predicted between subpopulations. The weight of the arrows is relative to percentage (thicker is higher percentage), and the light gray dotted arrows represent percentages lower than 20. (F) Cell cycle stages were predicted for each cell by subpopulation. Subpopulation one (“Core”) contains a significantly lower number of cells in the S phase (synthesis) compared to subpopulation two (“Proliferative”; Fisher's exact test, P < 2.2 × 10⁻¹⁶).

References

    1. Anders S, Huber W. 2010. Differential expression analysis for sequence count data. Genome Biol 11: R106. - PMC - PubMed
    1. Angerer P, Haghverdi L, Büttner M, Theis FJ, Marr C, Buettner F. 2016. destiny: diffusion maps for large-scale single-cell data in R. Bioinformatics 32: 1241–1243. - PubMed
    1. Artavanis-Tsakonas S, Rand MD, Lake RJ. 1999. Notch signaling: cell fate control and signal integration in development. Science 284: 770–776. - PubMed
    1. Bargaje R, Trachana K, Shelton MN, McGinnis CS, Zhou JX, Chadick C, Cook S, Cavanaugh C, Huang S, Hood L. 2017. Cell population structure prior to bifurcation predicts efficiency of directed differentiation in human induced pluripotent cells. Proc Natl Acad Sci 114: 2271–2276. - PMC - PubMed
    1. Boyer LA, Lee TI, Cole MF, Johnstone SE, Levine SS, Zucker JP, Guenther MG, Kumar RM, Murray HL, Jenner RG, et al. 2005. Core transcriptional regulatory circuitry in human embryonic stem cells. Cell 122: 947–956. - PMC - PubMed

Publication types

MeSH terms