. 2018 Jul 1;201(1):278-295.
doi: 10.4049/jimmunol.1701069. Epub 2018 May 11.

Myeloid-Derived Suppressor Cells Impair B Cell Responses in Lung Cancer through IL-7 and STAT5

Affiliations

Myeloid-Derived Suppressor Cells Impair B Cell Responses in Lung Cancer through IL-7 and STAT5

Yong Wang et al. J Immunol. .

Abstract

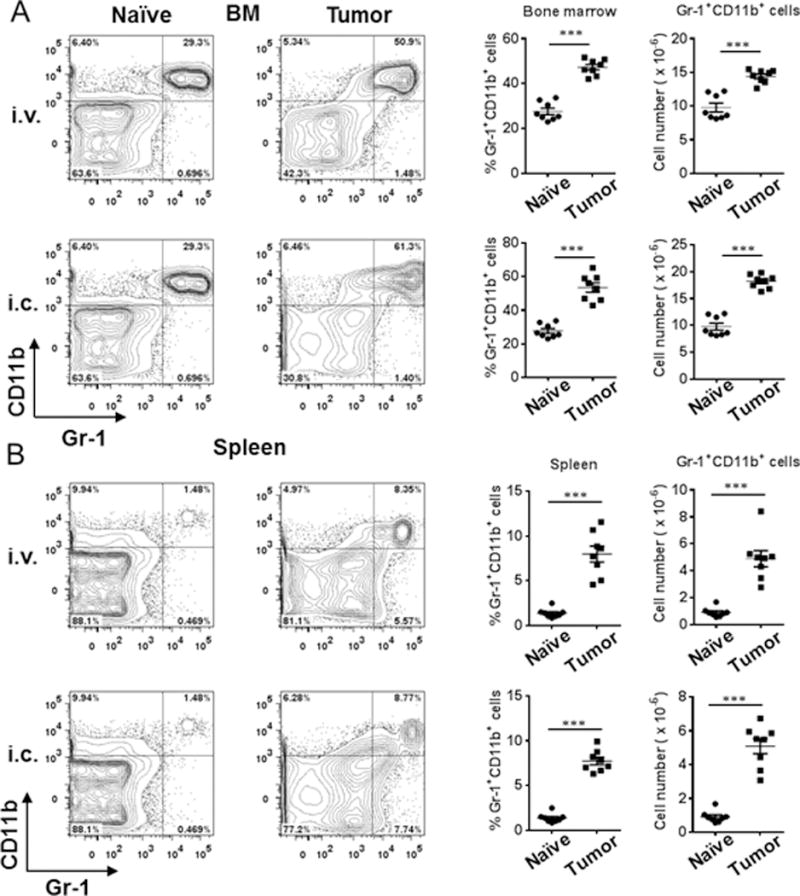
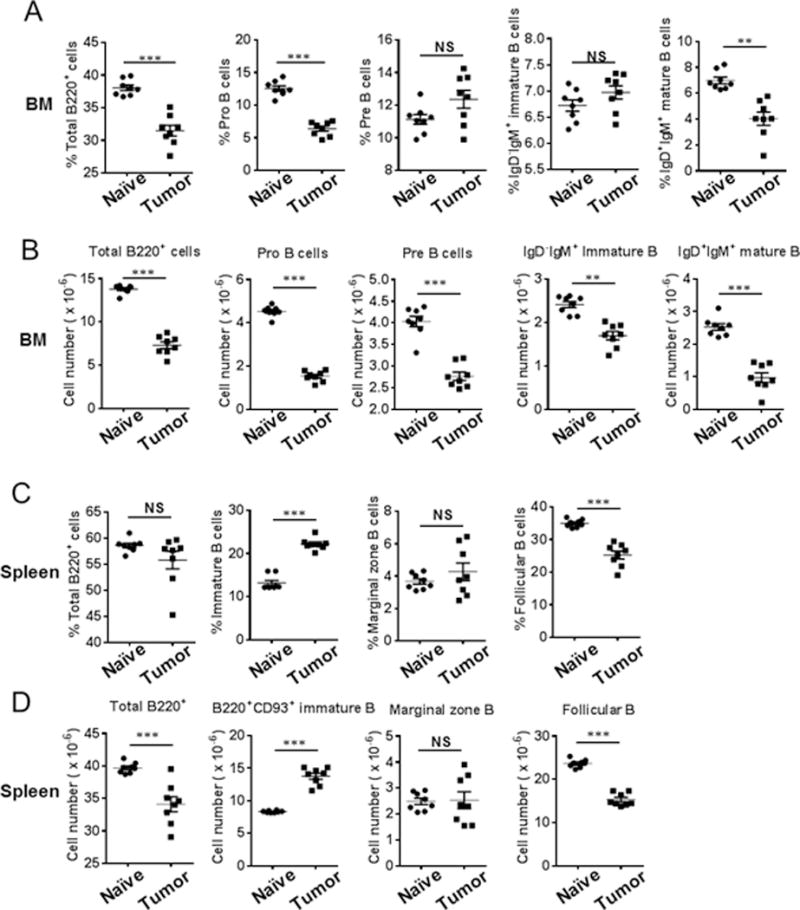
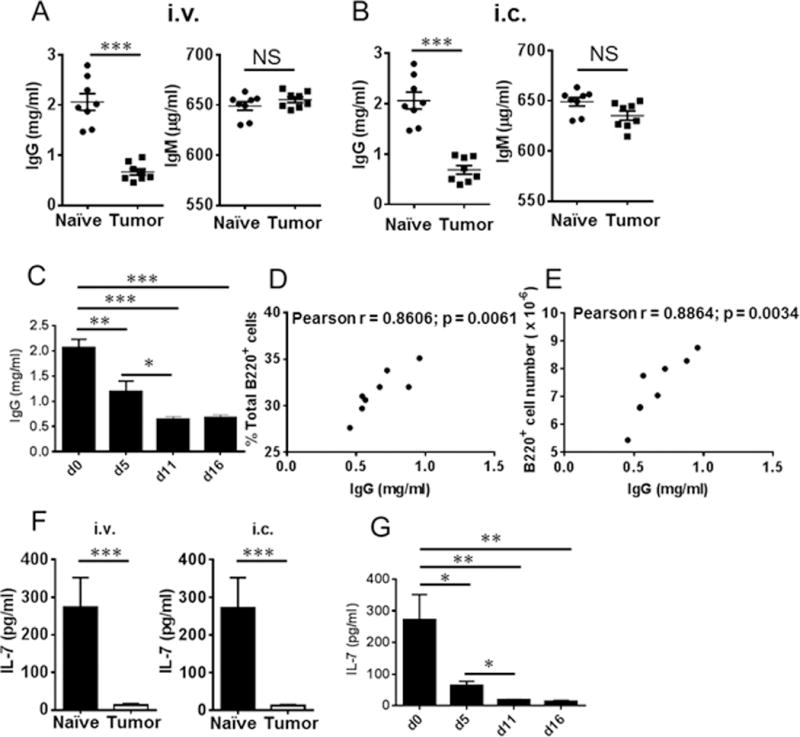
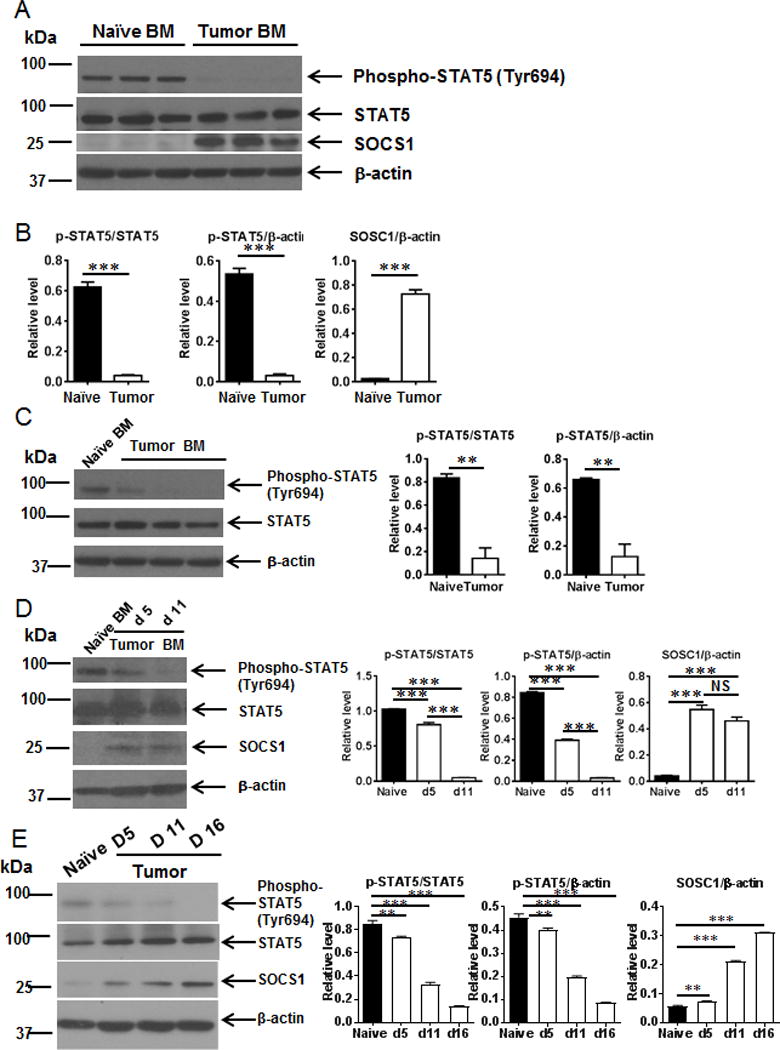
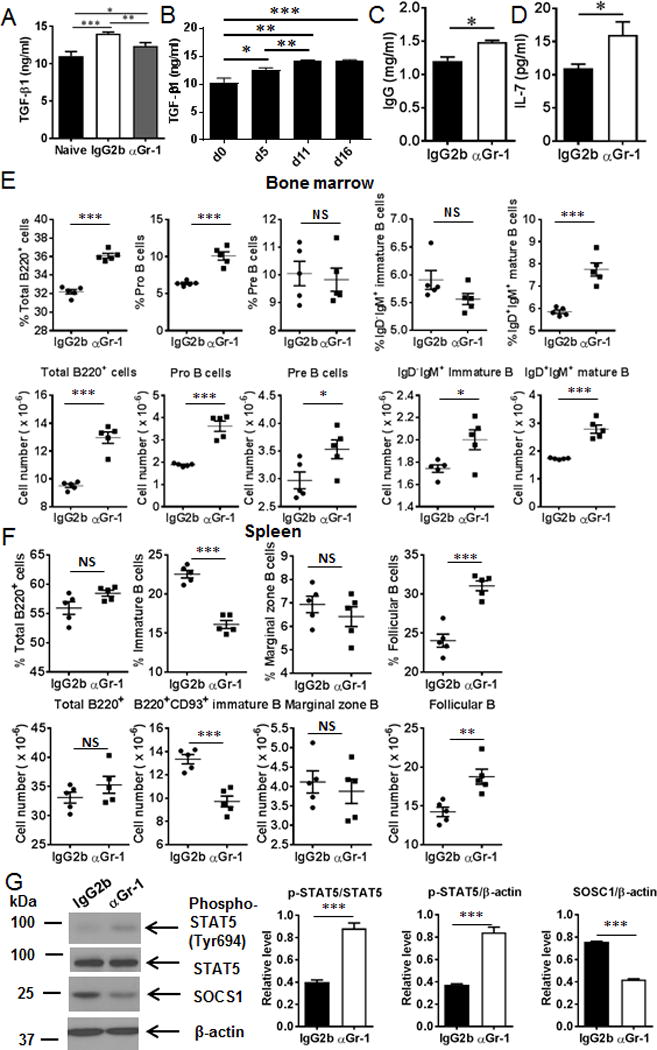
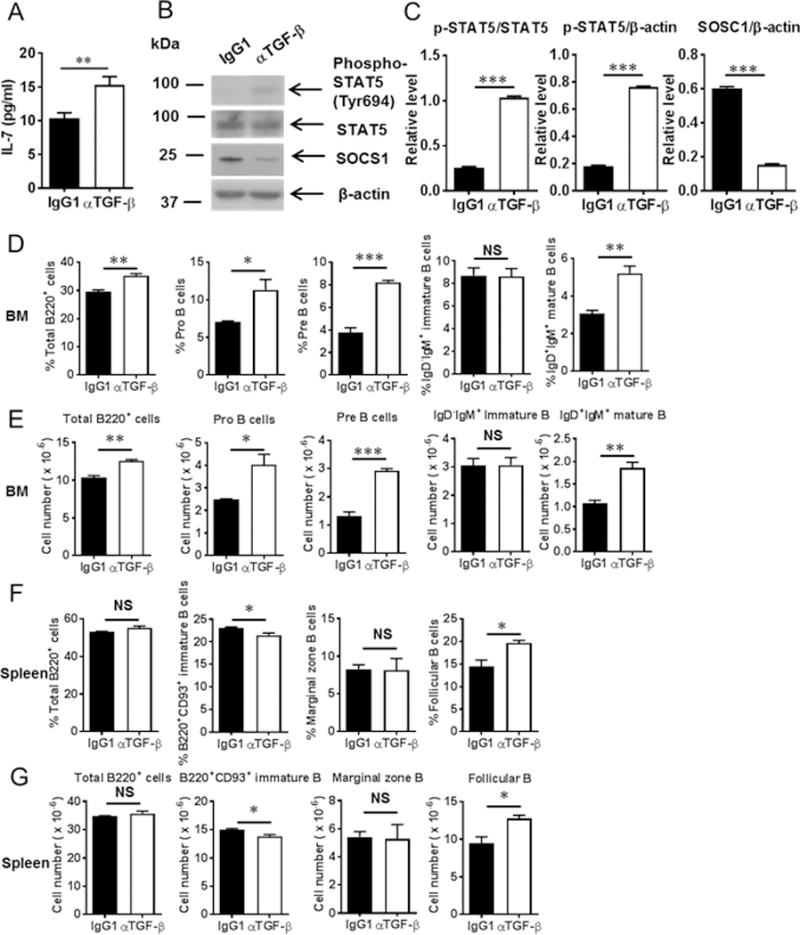
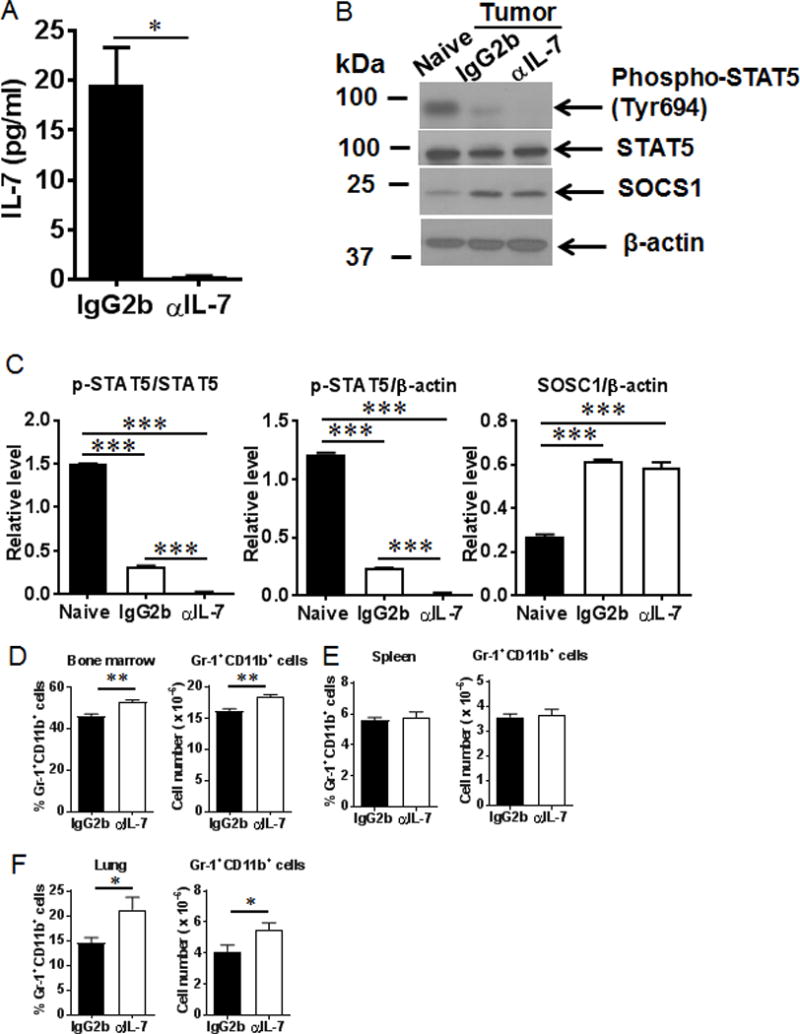
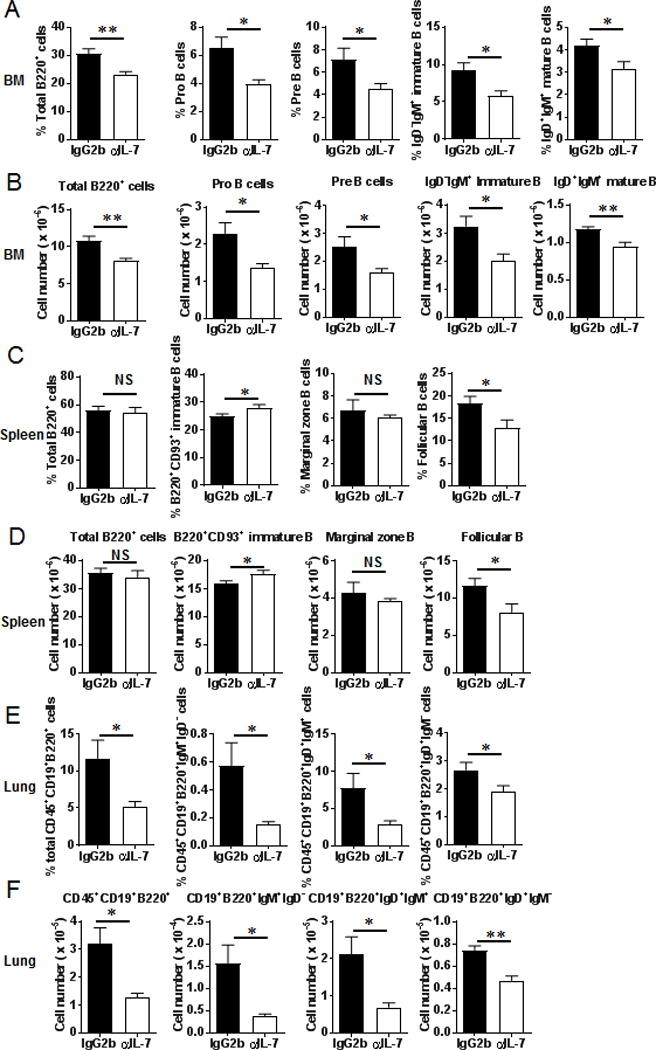
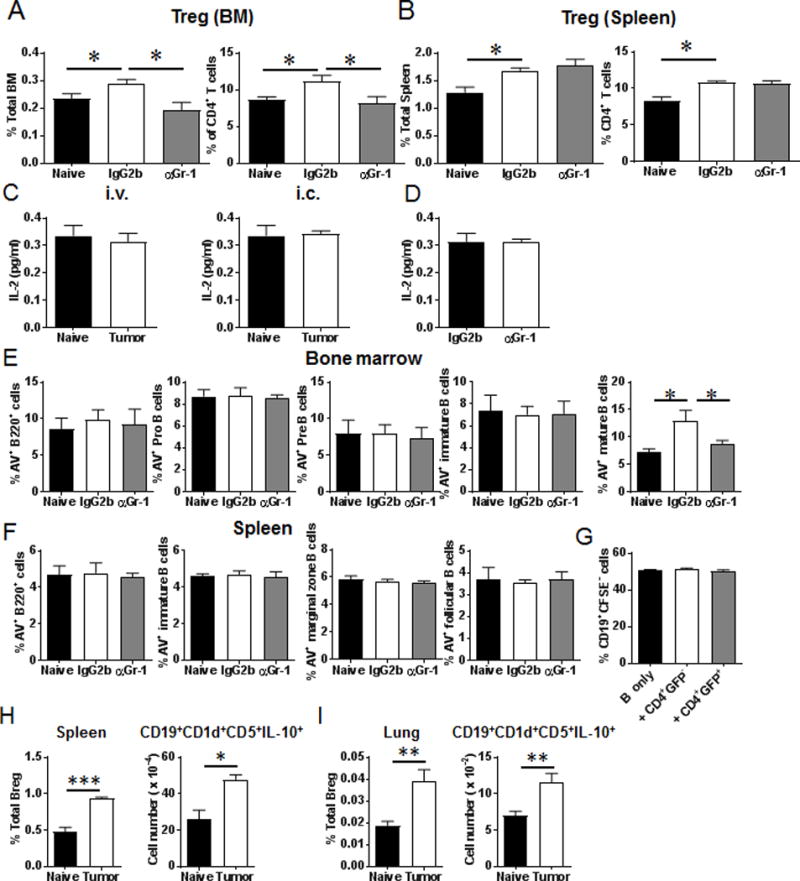
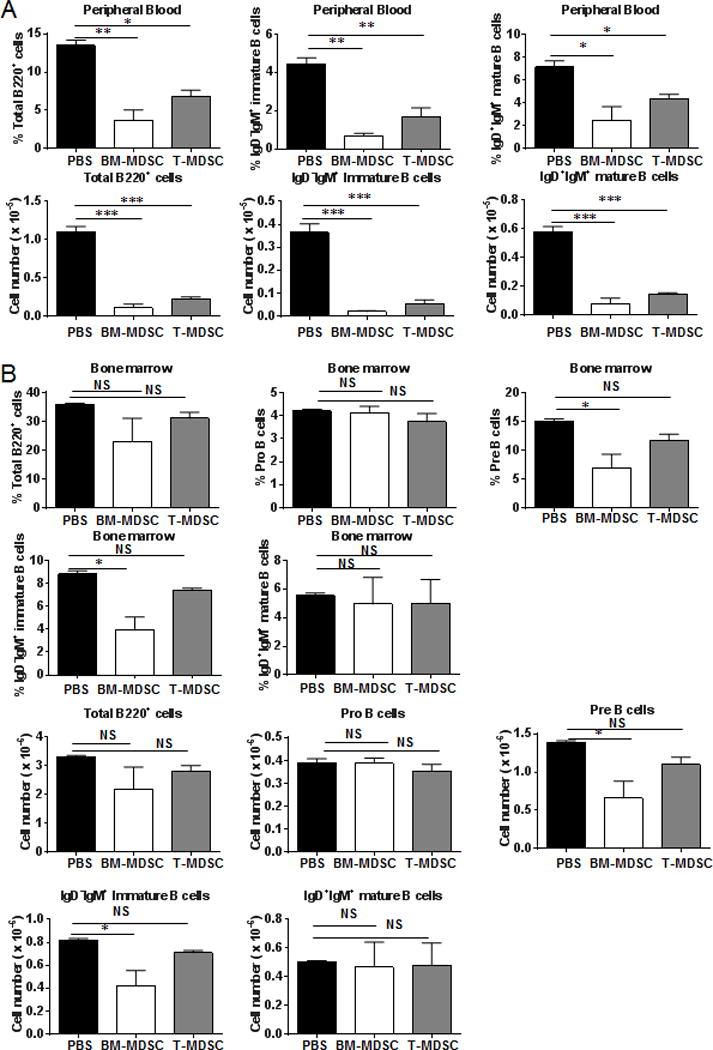
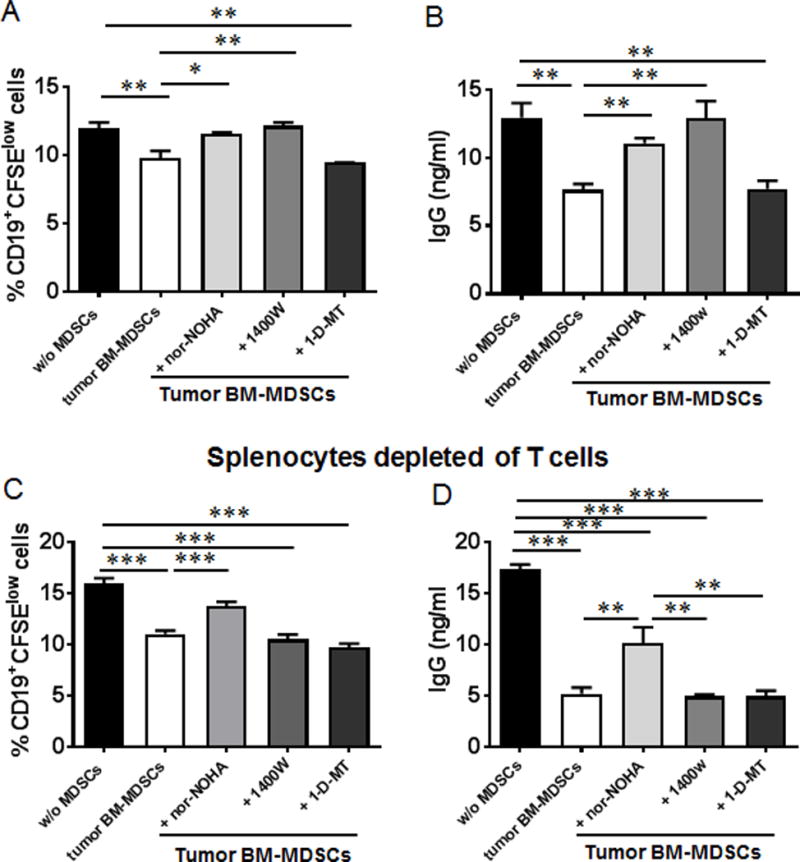
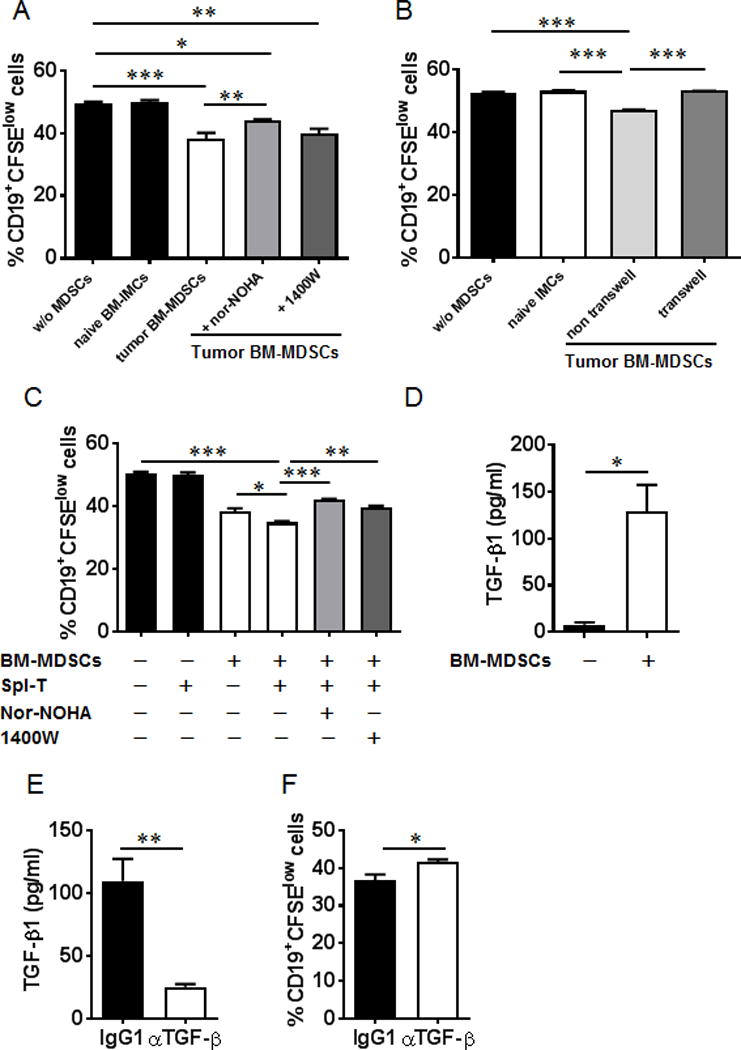
Myeloid-derived suppressor cells (MDSCs) are known suppressors of antitumor immunity, affecting amino acid metabolism and T cell function in the tumor microenvironment. However, it is unknown whether MDSCs regulate B cell responses during tumor progression. Using a syngeneic mouse model of lung cancer, we show reduction in percentages and absolute numbers of B cell subsets including pro-, pre-, and mature B cells in the bone marrow (BM) of tumor-bearing mice. The kinetics of this impaired B cell response correlated with the progressive infiltration of MDSCs. We identified that IL-7 and downstream STAT5 signaling that play a critical role in B cell development and differentiation were also impaired during tumor progression. Global impairment of B cell function was indicated by reduced serum IgG levels. Importantly, we show that anti-Gr-1 Ab-mediated depletion of MDSCs not only rescued serum IgG and IL-7 levels but also reduced TGF-β1, a known regulator of stromal IL-7, suggesting MDSC-mediated regulation of B cell responses. Furthermore, blockade of IL-7 resulted in reduced phosphorylation of downstream STAT5 and B cell differentiation in tumor-bearing mice and administration of TGF-β-blocking Ab rescued these IL-7-dependent B cell responses. Adoptive transfer of BM-derived MDSCs from tumor-bearing mice into congenic recipients resulted in significant reductions of B cell subsets in the BM and in circulation. MDSCs also suppressed B cell proliferation in vitro in an arginase-dependent manner that required cell-to-cell contact. Our results indicate that tumor-infiltrating MDSCs may suppress humoral immune responses and promote tumor escape from immune surveillance.


Conflict of interest statement

Conflict of Interest: There are no financial conflicts of interest for any of the authors listed.

Figures

Figure 1
Figure 1
Increased MDSCs in the BM and spleens of tumor-bearing mice. (A) FACS plots, percentages and cell numbers of Gr-1+CD11b+ MDSCs in the BM from naïve mice and tumor-bearing mice on day 16 post-LLC intravenous injection and on day 11 post-LLC intra-cardiac injection (n = 8 mice/group). (B) FACS plots, percentages and cell numbers of Gr-1+CD11b+ MDSCs in the spleens from naïve mice and tumor-bearing mice on day 16 post-LLC intravenous injection and on day 11 post-LLC intra-cardiac injection (n = 8 mice/group). **, P < 0.01; ***, P < 0.001.
Figure 2
Figure 2
Impairment of B cell subsets in the BM and spleens of tumor-bearing mice. Percentages of Pro- and mature B cells were reduced whereas absolute numbers of Pro-, Pre-, immature and mature B cells decreased in bone marrow of tumor-bearing mice after intravenous challenge with LLC tumor cells. (A) The percentages of total B220+, Pro-, Pre-, immature, and mature B cells were determined by FACS analysis of cells harvested from the BM of naïve and tumor-bearing mice on day 16 post-LLC intravenous challenge (n = 8 mice/group). (B) Absolute numbers of total B220+, Pro-, Pre-, immature, and mature B cells in the BM were calculated. Percentages and absolute numbers of follicular B cells were reduced, while immature B cells were increased in the spleens of tumor-bearing mice on day 16 post-LLC intravenous challenge with LLC tumor cells (n = 8 mice/group). (C) The percentages of total B, immature B, marginal zone B, and follicular B cells were determined by FACS analysis of cells harvested from the spleens of naïve and tumor-bearing mice on day 16 post-LLC intravenous challenge (n = 8 mice/group). (D) Absolute numbers of total B, immature B, marginal zone B, and follicular B cells in the spleens are presented (n = 8 mice/group). **, P < 0.01; ***, P < 0.001.
Figure 3
Figure 3
Reduced IgG and IL-7 levels in the serum of tumor-bearing mice. (A) IgG and IgM levels were detected in the serum of tumor-bearing mice on day 16 post-LLC intravenous challenge (n = 8 mice/group). (B) IgG and IgM levels were detected in the serum of tumor-bearing mice on day 11 post-LLC intracadiac challenge (n = 8 mice/group). (C) Time course of serum IgG at the indicated time points post-LLC intravenous injection (n = 4 mice/group). (D) Pearson correlation analysis of IgG levels with the percentages of total B cells in the BM of tumor-bearing mice (n = 8). (E) Pearson correlation analysis of IgG levels with the absolute numbers of B cells in the BM of tumor-bearing mice (n = 8). (F) IL-7 was reduced in the serum of tumor-bearing mice on 16 post-LLC intravenous challenge or on day 11 post-LLC intracadiac challenge (n = 6 mice/group). (G) Time course of serum IL-7 at the indicated time points after LLC intravenous challenge (n = 4 mice/group). *, P < 0.05; **, P < 0.01; ***, P < 0.001.
Figure 4
Figure 4
Impairment of STAT5 signaling in the BM of tumor-bearing mice. (A) and (B) Impairment of STAT5 signaling in the BM of tumor-bearing mice. BM lysates were collected from tumor-bearing mice on day 16 post-LLC intravenous challenge. Western blotting was performed with p-STAT5, STAT5 and SOCS1 antibodies. The relative expression of p-STAT5 or SOSC1 was normalized with STAT5, or β-actin, respectively. (C) Phosphorylation of STAT5 was reduced in the BM of tumor-bearing mice on day 11 post-LLC intra-cardiac challenge. The relative expression of p-STAT5 was normalized with STAT5, or β-actin, respectively. (D) Time course of impairment of STAT5 signaling in the BM of tumor-bearing mice at the indicated time points post-LLC intravenous challenge. The relative expression of p-STAT5 or SOSC1 was normalized with STAT5, or β-actin, respectively. Data are presented as mean ± s.e.m. of triplicates. (E) Time course of impairment of STAT5 signaling in the sorted CD19+B220+ cells from the BM of naïve or tumor-bearing mice at the indicated time points post-LLC intravenous challenge. The relative expression of p-STAT5 or SOSC1 was normalized with STAT5, or β-actin, respectively. **, P < 0.01; ***, P < 0.001.
Figure 5
Figure 5
Anti-Gr-1 treatment partially rescued serum TGF-β1, IgG and IL-7 levels as well as B cell subsets and STAT5 signaling in tumor-bearing mice. (A) Serum TGF-β1 levels were elevated in tumor-bearing mice, and TGF-β1 levels were reduced after MDSC depletion by anti-Gr-1 treatment (n = 5 mice/group). (B) Time course of serum TGF-β1 at the indicated time points after LLC intravenous injection (n = 4 mice/group). (C) Serum IgG levels were elevated after anti-Gr-1 treatment (n = 5 mice/group). (D) Serum IL-7 levels were increased after anti-Gr-1 treatment (n = 5 mice/group). (E) Percentages and absolute numbers of total B220+, Pro-, Pre-, immature and mature B cells in the BM of tumor-bearing mice treated with anti-Gr-1 antibody (n = 5 mice/group). (F) The percentages and absolute numbers of immature B cells were decreased whereas the percentages and absolute numbers of follicular B cells were increased after anti-Gr-1 treatment (n = 5 mice/group). (G) Phospho-STAT5 was elevated whereas SOCS1 was reduced after anti-Gr-1 treatment in tumor-bearing mice. Densitometry data were quantified with ImageJ software. The relative expression of p-STAT5 or SOSC1 was normalized with STAT5, or β-actin, respectively. *, P < 0.05; .**, P < 0.01; ***, P < 0.001.
Figure 6
Figure 6
Anti-TGF-β treatment partially rescued serum IL-7 levels and STAT5 signaling as well as B cell subsets in tumor-bearing mice. (A) Serum IL-7 levels were increased after anti-TGF-β treatment (n = 3 mice/group). (B) Phospho-STAT5 was elevated whereas SOCS1 was reduced after anti-TGF-β treatment in tumor-bearing mice (n = 3 mice/group). (C) Densitometry data were quantified with ImageJ software. The relative expression of p-STAT5 or SOSC1 was normalized with STAT5, or β-actin, respectively. (D) and (E) Percentages and absolute numbers of total B220+, Pro-, Pre-, immature and mature B cells in the BM of tumor-bearing mice treated with anti-TGF-β antibody (n = 3 mice/group). (F) and (G) The percentages and absolute numbers of immature B cells were decreased whereas the percentages and absolute numbers of follicular B cells were increased in the spleens after anti-TGF-β treatment (n = 3 mice/group). *, P < 0.05; **, P < 0.01; ***, P < 0.001.
Figure 7
Figure 7
Serum IL-7 levels and STAT5 signaling were reduced after IL-7 blockade. (A) Serum IL-7 levels were decreased after anti-IL-7 treatment. (B) and (C) Phospho-STAT5 was reduced after anti-IL-7 treatment in tumor-bearing mice. The percentages and cell numbers of Gr-1+CD11b+ MDSCs were elevated in the bone marrow (D) and lungs (F) after anti-IL-7 treatment in tumor-bearing mice. No changes of MDSCs were observed in the spleens (E) of tumor-bearing mice after anti-IL-7 treatment (n = 5 mice/group). *, P < 0.05; **, P < 0.01; ***, P < 0.001.
Figure 8
Figure 8
Anti-IL-7 treatment further reduced B cell subsets in the BM, spleens and lungs of tumor-bearing mice. (A) and (B) The percentages and absolute numbers of total B220+, Pro-, Pre-, immature and mature B cells in the BM of tumor-bearing mice treated with anti-IL-7 antibody (n = 5 mice/group). (C) and (D) The follicular B cells were reduced in the spleens of tumor-bearing mice after anti-IL-7 treatment (n = 5 mice/group). (E) and (F) B cell subsets were decreased in the lung of tumor-bearing mice after anti-IL-7 treatment (n = 5 mice/group). *, P < 0.05; **, P < 0.01.
Figure 9
Figure 9
Treg cells and apoptosis of B cell subsets in the BM and spleens of tumor-bearing mice. (A) Percentages of Treg in total cells and CD4+ T cells in the BM (n = 4 mice/group). (B) Percentages of Treg in total cells and CD4+ T cells in the spleens (n = 4 mice/group). (C) Serum IL-2 levels were not altered in tumor-bearing mice (n = 4 mice/group). (D) Serum IL-2 levels were not changed after anti-Gr-1 treatment (n = 4 mice/group). (E) Percentages of Annexin V+ B220+ cells, Annexin V+ Pro B cells, Annexin V+ Pre B cells, Annexin V+ immature B cells and Annexin V+ mature B cells in the BM (n = 4 mice/group). (F) Percentages of Annexin V+ B220+ cells, Annexin V+ immature B cells, Annexin V+ marginal zone B cells and Annexin V+ follicular B cells in the spleens (n = 4 mice/group). Naïve: naïve tumor free mice; IgG2b: tumor-bearing mice treated with IgG2b control antibody; αGr-1: tumor-bearing mice treated with anti-Gr-1 antibody. (G) Splenocytes from naïve mice were stimulated with LPS (20 μg/ml) and IL-4 (10 ng/ml) for 24 hrs. B220+CD19+ cells were sorted and labeled with CFSE. The sorted B cells were co-cultured with CD4+GFP+ Treg cells or CD4+GFP T cells purified from spleen of tumor-bearing Foxp3-DTR-GFP mice. The percentages of CD19+CFSElow cells were determined by FACS analysis. (H) Percentages and cell numbers of CD19+CD1d+CD5+IL-10+ Breg cells in the spleens of naïve and tumor-bearing mice on day 16 post-LLC intravenous injection (n = 4 mice/group). (I) Percentages and cell numbers of CD19+CD1d+CD5+IL-10+ Breg cells in the lungs of naïve and tumor-bearing mice on day 16 post-LLC intravenous injection (n = 4 mice/group). *, P < 0.05; **, P < 0.01; ***, P < 0.001.
Figure 10
Figure 10
Adoptive intratibial transfer of MDSCs reduced circulating B cells as well as pre B and immature B cells in the BM. (A) Percentages and absolute numbers of total B, immature B, and mature B cells were reduced in peripheral blood of congenic CD45.1+ mice on day 7 after intra-tibial injection of BM-MDSCs and Tumor-MDSCs from CD45.2+ tumor-bearing mice (n = 4 mice/group). (B) Percentages and absolute numbers of Pre B and immature B cells were reduced in the BM of congenic CD45.1+ mice on day 7 after intratibial injection of BM-MDSCs from tumor-bearing mice (n = 4 mice/group). *, P < 0.05; **, P < 0.01; ***, P < 0.001.
Figure 11
Figure 11
Suppression of B cell proliferation and function by MDSCs from tumor-bearing mice. (A) Splenocytes from naïve mice were labeled with CFSE and cultured with LPS (20 μg/ml) and IL-4 (10 ng/ml). 72 hours later, the pre-activated splenocytes were co-cultured with MDSCs purified from the BM of tumor-bearing mice in the absence or presence of arginase inhibitor nor-NOHA, iNOS inhibitor 1400W or IDO inhibitor 1-D-MT for 48 hrs. The percentages of CD19+CFSElow cells were determined by FACS analysis. (B) IgG detection from the supernatant collected from the co-culture. (C) and (D) Splenocytes depleted of T cells were labeled with CFSE and cultured with LPS and IL-4. The same experiments were performed as described in (A) and (B). *, P < 0.05; **, P < 0.01; ***, P < 0.001.
Figure 12
Figure 12
Suppression of B cell proliferation by MDSCs through iNOS is dependent on T cells. (A) Splenocytes from naïve mice were stimulated with LPS (20 μg/ml) and IL-4 (10 ng/ml) for 24 hrs. B220+CD19+ cells were sorted and labeled with CFSE. The sorted B cells were co-cultured with MDSCs purified from bone marrow of tumor-bearing mice in the absence or presence of arginase inhibitor nor-NOHA or iNOS inhibitor 1400W for 72 hrs. The percentages of CD19+CFSElow cells were determined by FACS analysis. (B) Purified B220+CD19+ cells were co-cultured with MDSCs from tumor-bearing mice in the absence or presence of a transwell system for 72 hrs. The percentages of CD19+CFSElow cells were determined by FACS analysis. (C) T cells purified from spleen of tumor-bearing mice were added to the co-cultures of B and MDSCs described in (A) in the absence or presence of arginase inhibitor nor-NOHA or iNOS inhibitor 1400W. The percentages of CD19+CFSElow cells were determined by FACS analysis. (D) TGF-β1 levels were elevated in the supernatants from the co-cultures of B cells and MDSCs. (E) TGF-β1 was reduced in the co-cultures of B cells and MDSCs in the presence of TGF-β neutralizing Ab. (F) The proliferation of B cells was increased in the co-cultures after TGF-β blockade. *, P < 0.05; **, P < 0.01; ***, P < 0.001.

Comment in

References

    1. Gabrilovich DI, Nagaraj S. Myeloid-derived suppressor cells as regulators of the immune system. Nat Rev Immunol. 2009;9:162–174. - PMC - PubMed
    1. Condamine T, Gabrilovich DI. Molecular mechanisms regulating myeloid-derived suppressor cell differentiation and function. Trends Immunol. 2011;32:19–25. - PMC - PubMed
    1. Gabrilovich DI, Ostrand-Rosenberg S, Bronte V. Coordinated regulation of myeloid cells by tumours. Nat Rev Immunol. 2012;12:253–268. - PMC - PubMed
    1. Youn JI, Nagaraj S, Collazo M, Gabrilovich DI. Subsets of myeloid-derived suppressor cells in tumor-bearing mice. J Immunol. 2008;181:5791–5802. - PMC - PubMed
    1. Khaled YS, Ammori BJ, Elkord E. Myeloid-derived suppressor cells in cancer: recent progress and prospects. Immunol Cell Biol. 2013;91:493–502. - PubMed

Publication types

MeSH terms