Comparative Study
. 2018 Jul 6;293(27):10826-10840.
doi: 10.1074/jbc.RA117.000378. Epub 2018 May 11.

Specific glycosaminoglycan chain length and sulfation patterns are required for cell uptake of tau versus α-synuclein and β-amyloid aggregates

Affiliations
Comparative Study

Specific glycosaminoglycan chain length and sulfation patterns are required for cell uptake of tau versus α-synuclein and β-amyloid aggregates

Barbara E Stopschinski et al. J Biol Chem. .

Abstract

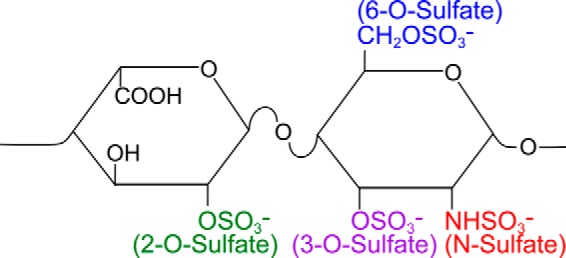
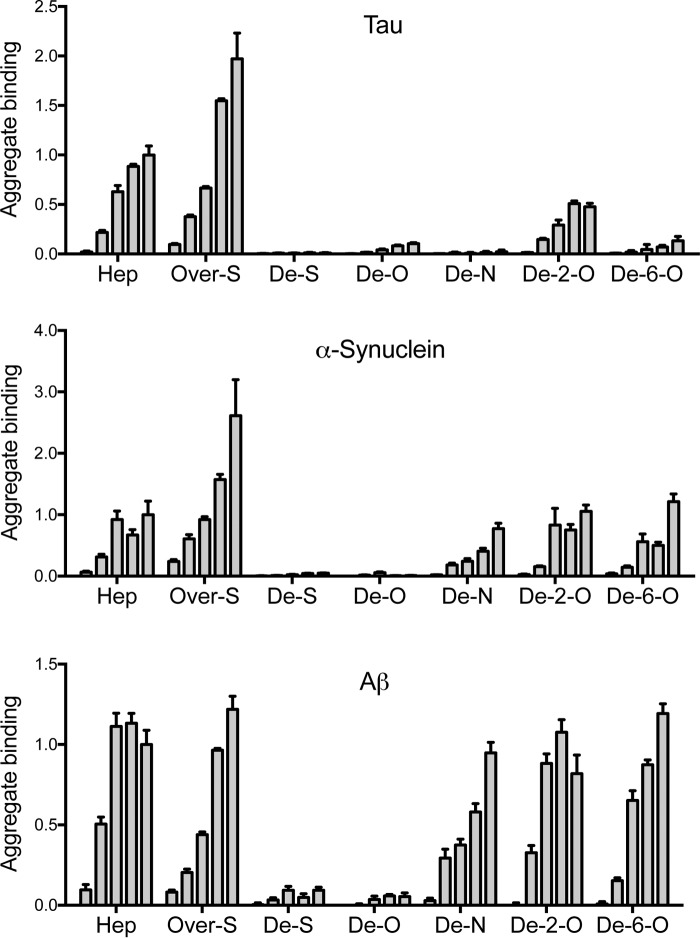
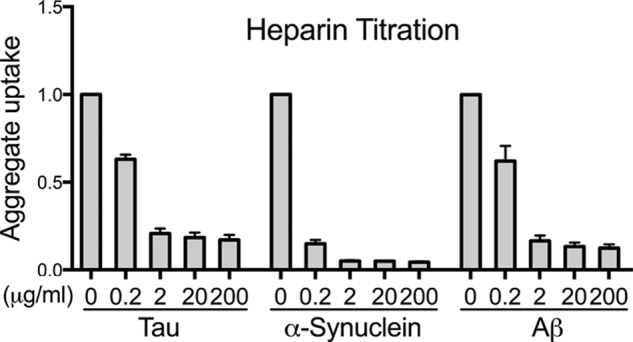
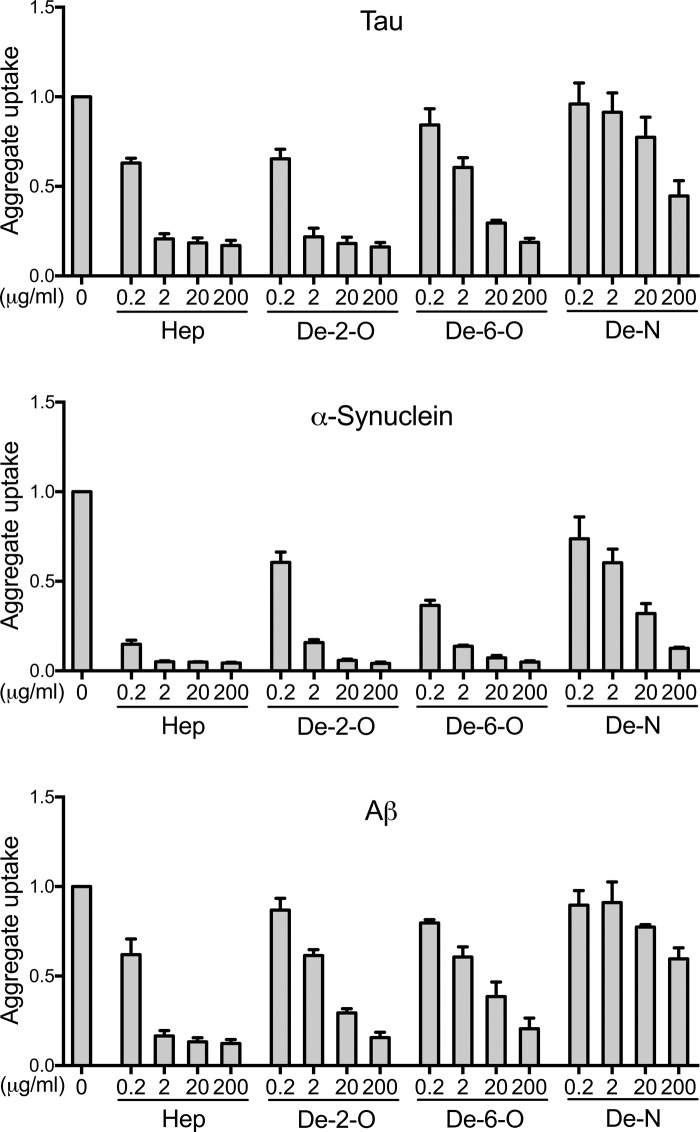
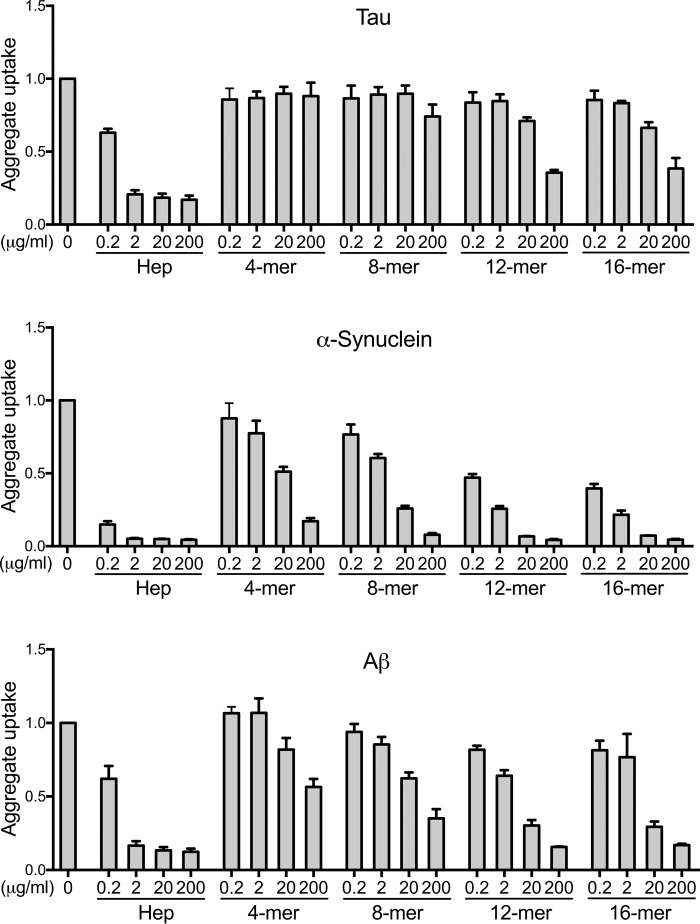
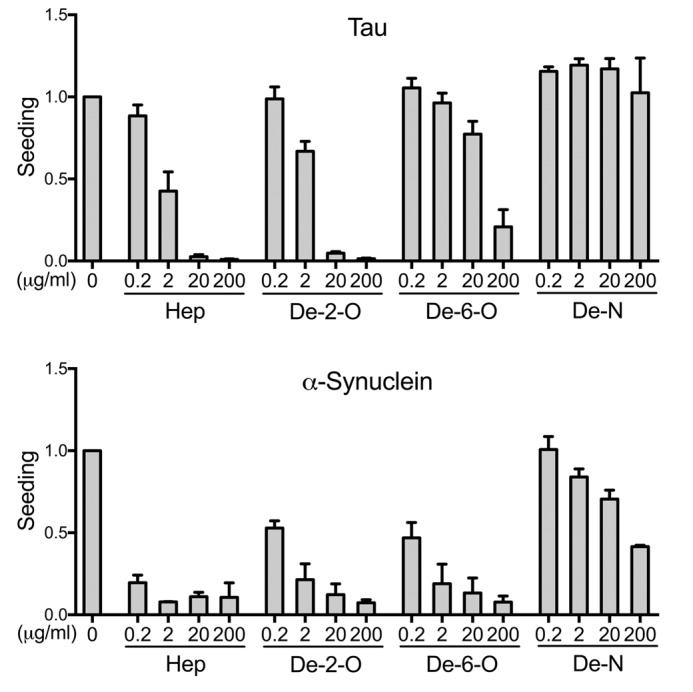
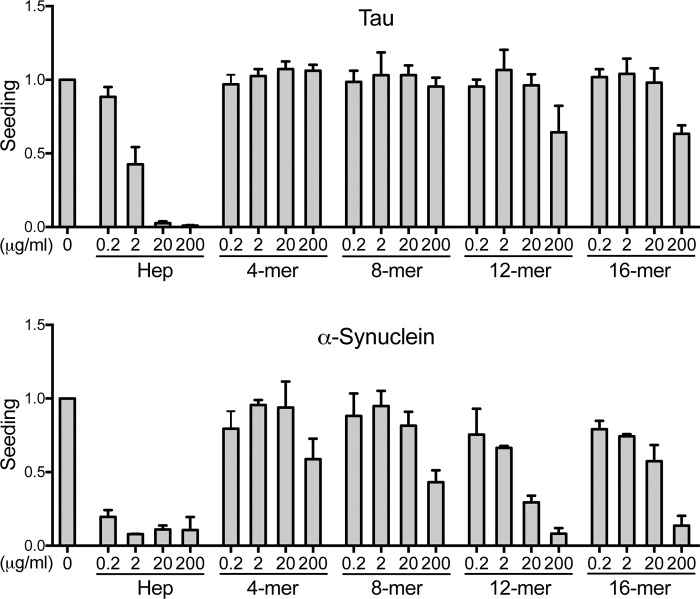
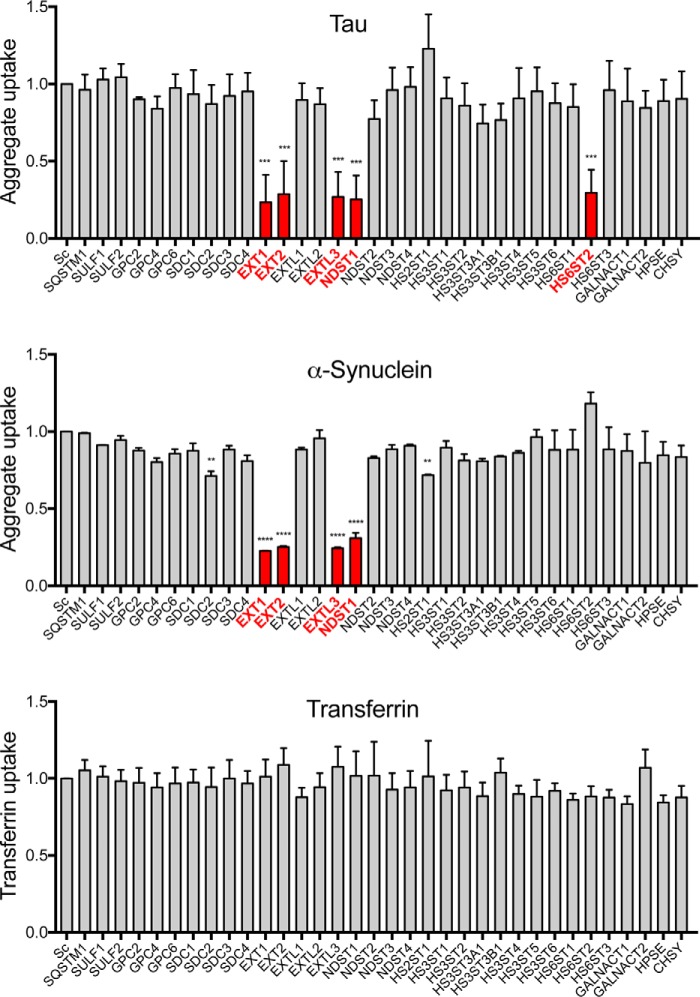
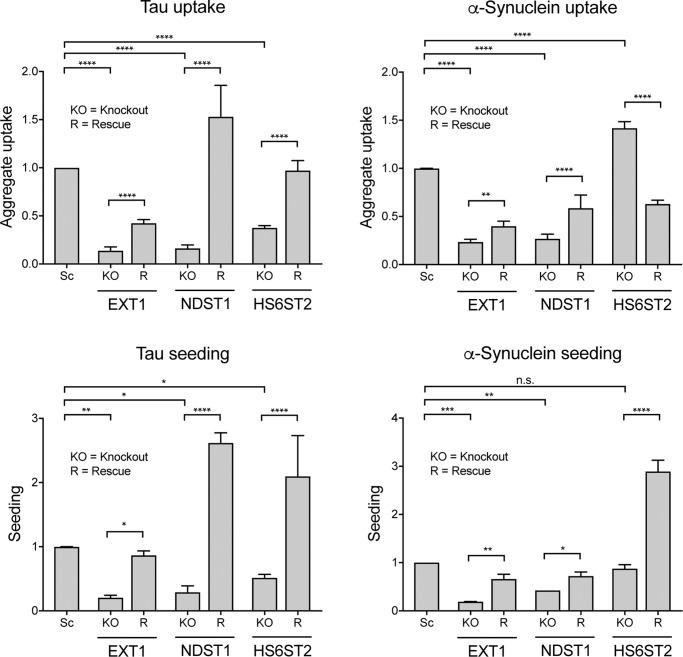
Transcellular propagation of protein aggregate "seeds" has been proposed to mediate the progression of neurodegenerative diseases in tauopathies and α-synucleinopathies. We previously reported that tau and α-synuclein aggregates bind heparan sulfate proteoglycans (HSPGs) on the cell surface, promoting cellular uptake and intracellular seeding. However, the specificity and binding mode of these protein aggregates to HSPGs remain unknown. Here, we measured direct interaction with modified heparins to determine the size and sulfation requirements for tau, α-synuclein, and β-amyloid (Aβ) aggregate binding to glycosaminoglycans (GAGs). Varying the GAG length and sulfation patterns, we next conducted competition studies with heparin derivatives in cell-based assays. Tau aggregates required a precise GAG architecture with defined sulfate moieties in the N- and 6-O-positions, whereas the binding of α-synuclein and Aβ aggregates was less stringent. To determine the genes required for aggregate uptake, we used CRISPR/Cas9 to individually knock out the major genes of the HSPG synthesis pathway in HEK293T cells. Knockouts of the extension enzymes exostosin 1 (EXT1), exostosin 2 (EXT2), and exostosin-like 3 (EXTL3), as well as N-sulfotransferase (NDST1) or 6-O-sulfotransferase (HS6ST2) significantly reduced tau uptake, consistent with our biochemical findings, and knockouts of EXT1, EXT2, EXTL3, or NDST1, but not HS6ST2 reduced α-synuclein uptake. In summary, tau aggregates display specific interactions with HSPGs that depend on GAG length and sulfate moiety position, whereas α-synuclein and Aβ aggregates exhibit more flexible interactions with HSPGs. These principles may inform the development of mechanism-based therapies to block transcellular propagation of amyloid protein-based pathologies.

Keywords: Alzheimer disease; CRISPR/Cas; HSPG; Tau protein (Tau); amyloid-β (Aβ); heparan sulfate; neurodegeneration; neurodegenerative disease; proteoglycan; tauopathies; α-synuclein.


Conflict of interest statement

The authors declare that they have no conflicts of interest with the contents of this article

Figures

Figure 1.
Figure 1.
Basic disaccharide unit of heparan sulfate and heparin. The basic disaccharide unit of heparan sulfate and heparin is composed of uronic acid (glucuronic acid or iduronic acid, left) and glucosamine (right). Iduronic acid results from epimerization of glucuronic acid. Heparin differs from HS by shorter average chain lengths, higher contents of iduronic acid, and a higher charge density per residue. Uronic acid residues are sulfated at the 2-O-position, whereas glucosamine residues are sulfated at the N-, 3-O-, and 6-O-positions (2, 3).
Figure 2.
Figure 2.
Carbohydrate microarray analyses identify unique amyloid–GAG interactions. Biotin-labeled tau, α-synuclein, and Aβ fibrils at 1 μm (monomer equivalent) were applied to a glass surface coated with heparin derivatives at 0.5, 1, 5, 10, and 15 μm (left to right): heparin (Hep), oversulfated heparin (Over-S), fully desulfated heparin (De-S), O-desulfated heparin (De-O), N-desulfated heparin (De-N), 2-O-desulfated heparin (De-2-O), and 6-O-desulfated heparin (De-6-O). We applied an anti-biotin IgG antibody conjugated to Cy5 and quantified relative fibril binding by measuring fluorescence. Each protein was analyzed in triplicate, and the data represent an average value for 10 spots at a given carbohydrate concentration. The average values were standardized to the highest concentration of heparin (15 μm) in each data set. Note distinct binding patterns for N-desulfated heparin, 2-O-desulfated heparin, and 6-O-desulfated heparin. Error bars show S.E.
Figure 3.
Figure 3.
Heparin blocks aggregate uptake of Tau, α-synuclein, and Aβ. Tau, α-synuclein, or Aβ seeds labeled with Alexa Fluor 647 fluorescent dye were applied to C17.2 cells with increasing doses of heparin (0.2, 2, 20, and 200 μg/ml). We quantified aggregate uptake based on the MFI per cell by flow cytometry. Heparin dose-dependently decreased cellular uptake in all cases. Each condition was recorded in triplicate, and values represent the average of three separate experiments. Data reflect uptake relative to the untreated samples. Error bars show S.D.
Figure 4.
Figure 4.
Heparin-mediated inhibition of aggregate uptake requires specific sulfation patterns. Normal heparin and 2-O-, 6-O-, and N-desulfated forms were tested as inhibitors of cellular uptake for tau, α-synuclein, and Aβ aggregates in C17.2 cells. N- and 6-O-desulfated heparins weakly inhibited and 2-O-desulfated heparins strongly inhibited tau uptake. For α-synuclein and Aβ, removal of N-sulfation and to a lesser degree 6-O-sulfation and 2-O-sulfation reduced inhibitor efficacy. Each condition was recorded in triplicate, and values represent the average of three separate experiments. Data reflect uptake relative to the untreated group. Error bars show S.D.
Figure 5.
Figure 5.
Inhibition of aggregate uptake requires a critical heparin size. The 4-, 8-, 12-, and 16-mer heparins were evaluated as inhibitors of tau, α-synuclein, and Aβ aggregate internalization in C17.2 cells. Potency increased with the GAG chain length. Each condition was recorded in triplicate, and values represent the average of three separate experiments. Data reflect uptake relative to the untreated group. Error bars show S.D.
Figure 6.
Figure 6.
Sulfation pattern specifies inhibition of seeding. 2-O-, 6-O-, and N-desulfated heparins were evaluated for inhibition of tau seeding in the P301S FRET biosensor cell line and α-synuclein seeding in the A53T FRET biosensor cell line. We used flow cytometry to quantify seeding based on the percentage of FRET-positive cells. Inhibition of tau seeding required N-sulfation and, to a lesser extent, 6-O-sulfation. By contrast, α-synuclein primarily required N-sulfation and 6-O- and 2-O-sulfation to a lesser degree. In every experiment, each condition was tested in triplicate. Values represent the average of three separate experiments for tau, and two separate experiments for α-synuclein. The data reflect seeding relative to the untreated group. Error bars show S.D.
Figure 7.
Figure 7.
GAG size specifies inhibition of seeding. The potency of different heparins against tau seeding in the P301S FRET biosensor cell line and α-synuclein seeding in the A53T FRET biosensor cell line depended on the chain lengths of the heparins. The 4-, 8-, 12-, and 16-mer heparins were evaluated as inhibitors of tau and α-synuclein seeding. The inhibitory potency of the heparin fragments increased with GAG chain length. In every experiment, each condition was tested in triplicate. Values represent the average of three separate experiments for tau, and two separate experiments for α-synuclein. Data reflect seeding relative to the untreated group. Error bars show S.D.
Figure 8.
Figure 8.
HSPG genes critical for the internalization of tau and α-synuclein aggregates. Genes implicated in HSPG synthesis were individually targeted in HEK293T cells using CRISPR/Cas9 to create polyclonal knockout lines. The cell lines were then tested for internalization of fluorescently labeled tau and α-synuclein aggregates by measuring MFI per cell with flow cytometry. The cells were treated in parallel with fluorescently labeled transferrin to control for nonspecific reduction of clathrin-mediated uptake. Knockout of four genes (EXT1, EXT2, EXTL3, and NDST1) reduced both tau and α-synuclein uptake, whereas the knockout of HS6ST2 only reduced tau uptake. None of the gene knockouts reduced transferrin uptake. Data were collected in duplicate on 2 different days for each cell line and each aggregate type and normalized to uptake from control cells treated with scrambled gRNA (Sc). For transferrin uptake, the data from all 4 experimental days was combined. Red columns indicate the gene knockouts with the strongest effects. Error bars show S.D. For statistical analyses, we combined the averages for each experimental day. ****, p < 0.0001; ***, p < 0.001; **, p < 0.01; one-way ANOVA, Dunnett.
Figure 9.
Figure 9.
Rescue of tau and α-synuclein uptake and seeding after gene knockout. We generated knockout (KO) cell lines using HEK293T cells for uptake, the P301S FRET biosensor cell line for tau seeding, and the A53T FRET biosensor cell line for α-synuclein seeding for the main genes of interest (EXT1, NDST1, and HS6ST2) and tested them with and without genetic rescue (R) by lentiviral cDNA. For tau, knockout of all three genes was rescued by overexpression for both uptake and seeding. For α-synuclein, knockout of EXT1 and NDST1 was rescued for uptake and seeding. However, HS6ST2 knockout increased α-synuclein uptake and did not change α-synuclein seeding, whereas HS6ST2 overexpression decreased α-synuclein uptake and increased seeding. Data were collected from at least three different experiments in triplicate for tau uptake and seeding and for α-synuclein uptake, and from two different experiments for α-synuclein seeding. The uptake or seeding in knockout cell lines was normalized to the uptake/seeding detected in scrambled control cells (Sc). Error bars show S.D. For statistical analyses, we combined the averages for each experiment. n.s., not significant, *, p < 0.05; **, p < 0.01; ***, p < 0.001; ****, p < 0.0001; one-way ANOVA, Holm-Šídák testing.

References

    1. Holmes B. B., DeVos S. L., Kfoury N., Li M., Jacks R., Yanamandra K., Ouidja M. O., Brodsky F. M., Marasa J., Bagchi D. P., Kotzbauer P. T., Miller T. M., Papy-Garcia D., and Diamond M. I. (2013) Heparan sulfate proteoglycans mediate internalization and propagation of specific proteopathic seeds. Proc. Natl. Acad. Sci. U.S.A. 110, E3138–E3147 10.1073/pnas.1301440110 - DOI - PMC - PubMed
    1. Xu D., and Esko J. D. (2014) Demystifying heparan sulfate-protein interactions. Annu. Rev. Biochem. 83, 129–157 10.1146/annurev-biochem-060713-035314 - DOI - PMC - PubMed
    1. Lindahl U., and Kjellén L. (2013) Pathophysiology of heparan sulphate: many diseases, few drugs. J. Intern. Med. 273, 555–571 10.1111/joim.12061 - DOI - PubMed
    1. Bishop J. R., Schuksz M., and Esko J. D. (2007) Heparan sulphate proteoglycans fine-tune mammalian physiology. Nature 446, 1030–1037 10.1038/nature05817 - DOI - PubMed
    1. Wang Z., Hsieh P. H., Xu Y., Thieker D., Chai E. J., Xie S., Cooley B., Woods R. J., Chi L., and Liu J. (2017) Synthesis of 3-O-sulfated oligosaccharides to understand the relationship between structures and functions of heparan sulfate. J. Am. Chem. Soc. 2017 10.1021/jacs.7b01923 - DOI - PMC - PubMed

Publication types

MeSH terms