. 2018 Jul;188(7):1536-1554.
doi: 10.1016/j.ajpath.2018.03.019. Epub 2018 May 18.

Obstructive Lymphangitis Precedes Colitis in Murine Norovirus-Infected Stat1-Deficient Mice

Affiliations

Obstructive Lymphangitis Precedes Colitis in Murine Norovirus-Infected Stat1-Deficient Mice

Audrey Seamons et al. Am J Pathol. 2018 Jul.

Abstract

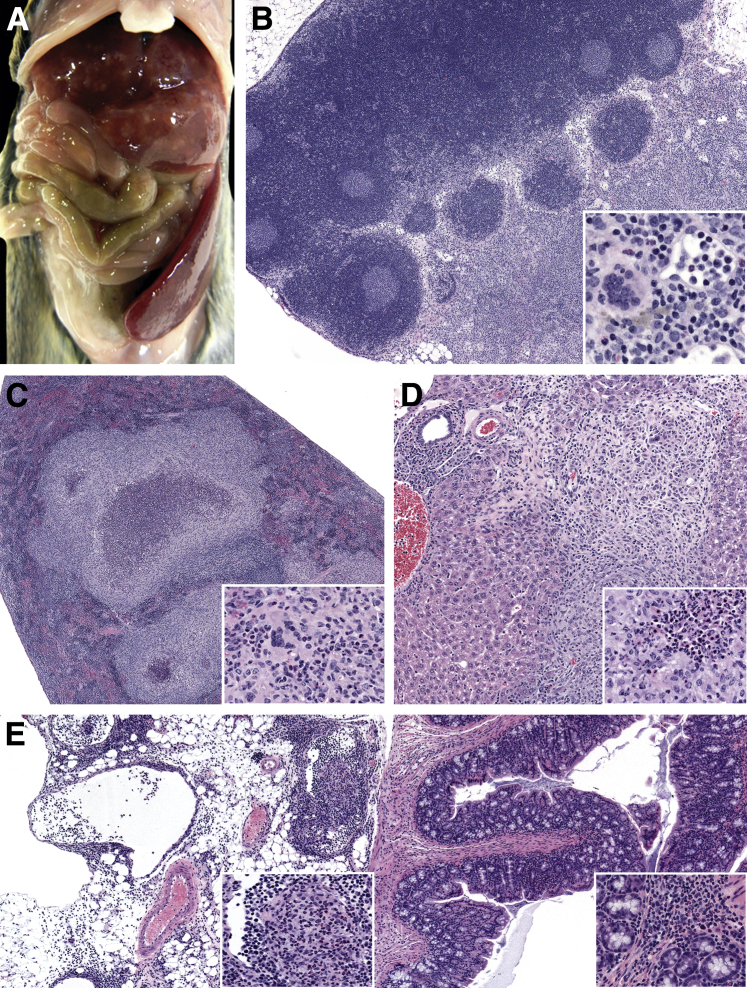
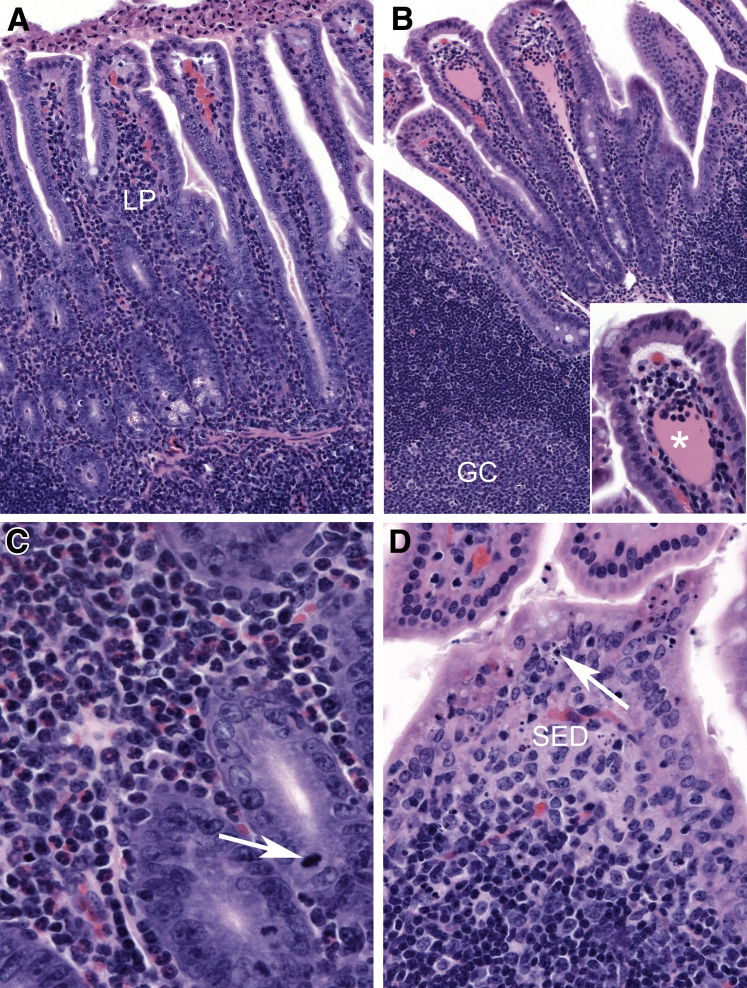
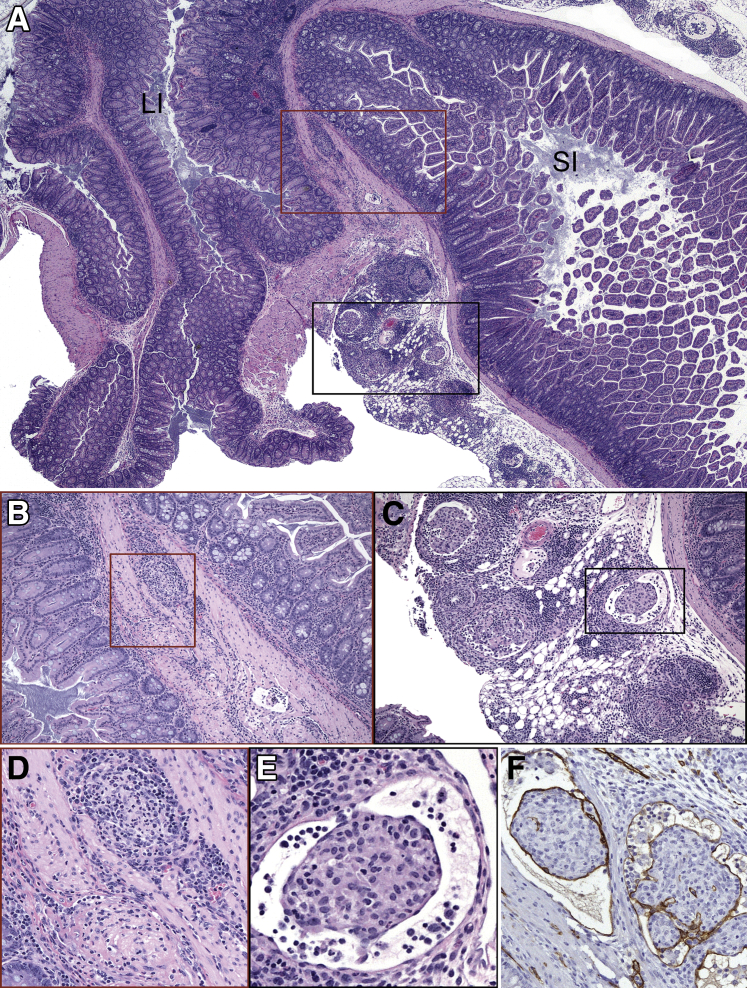
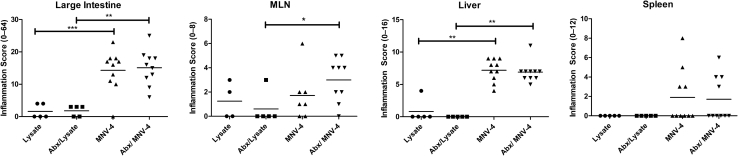
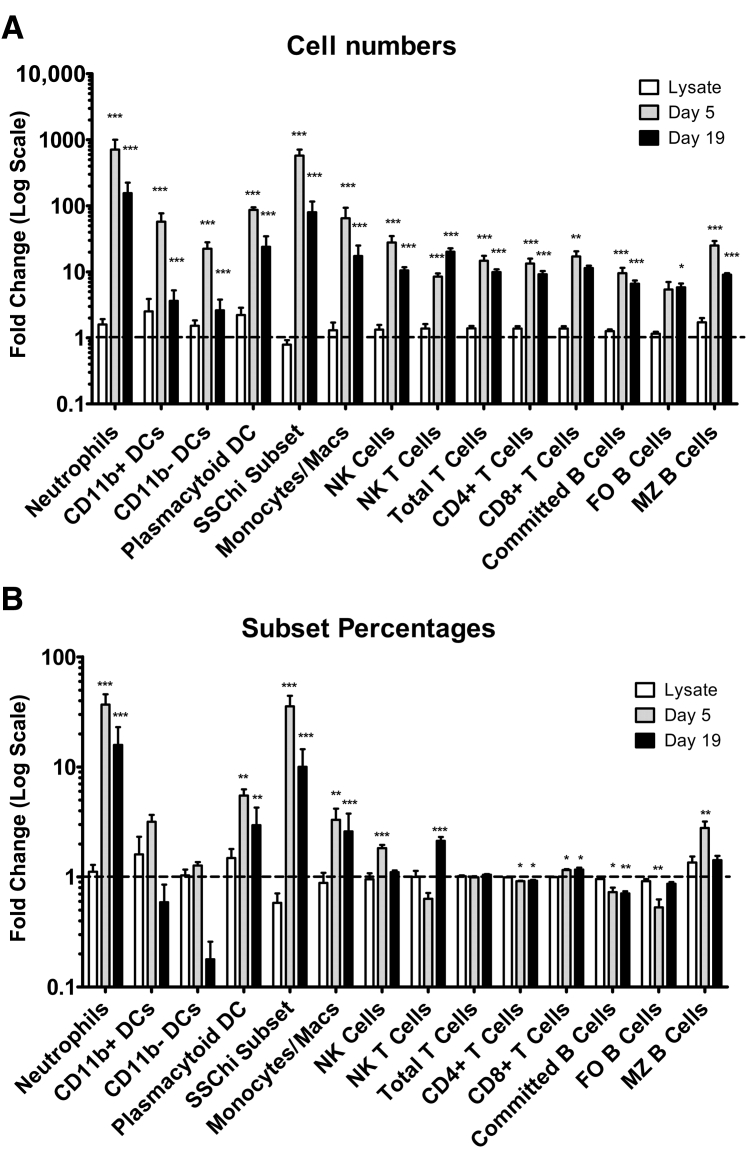
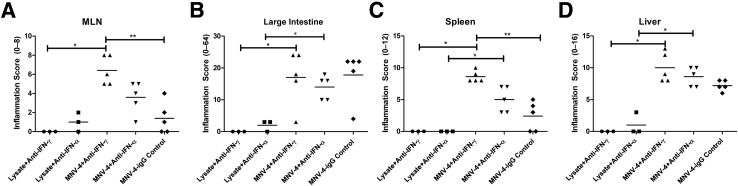
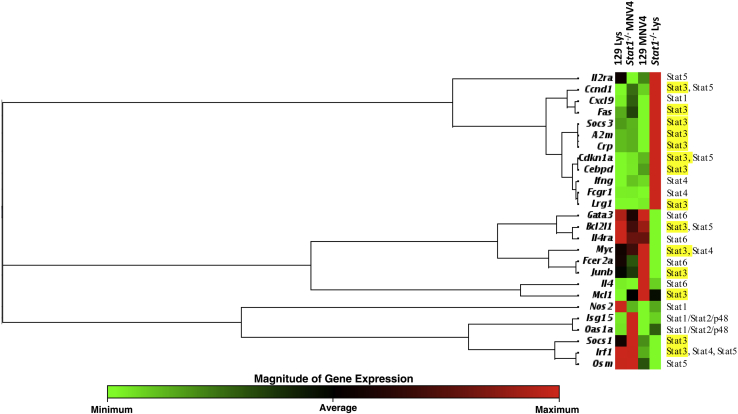
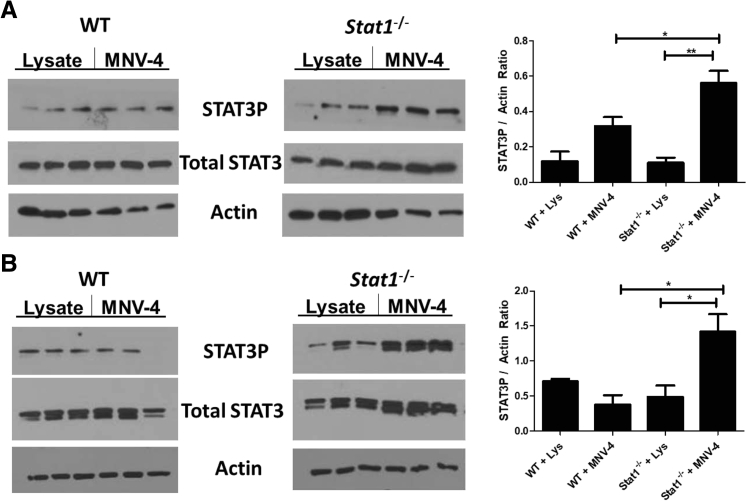
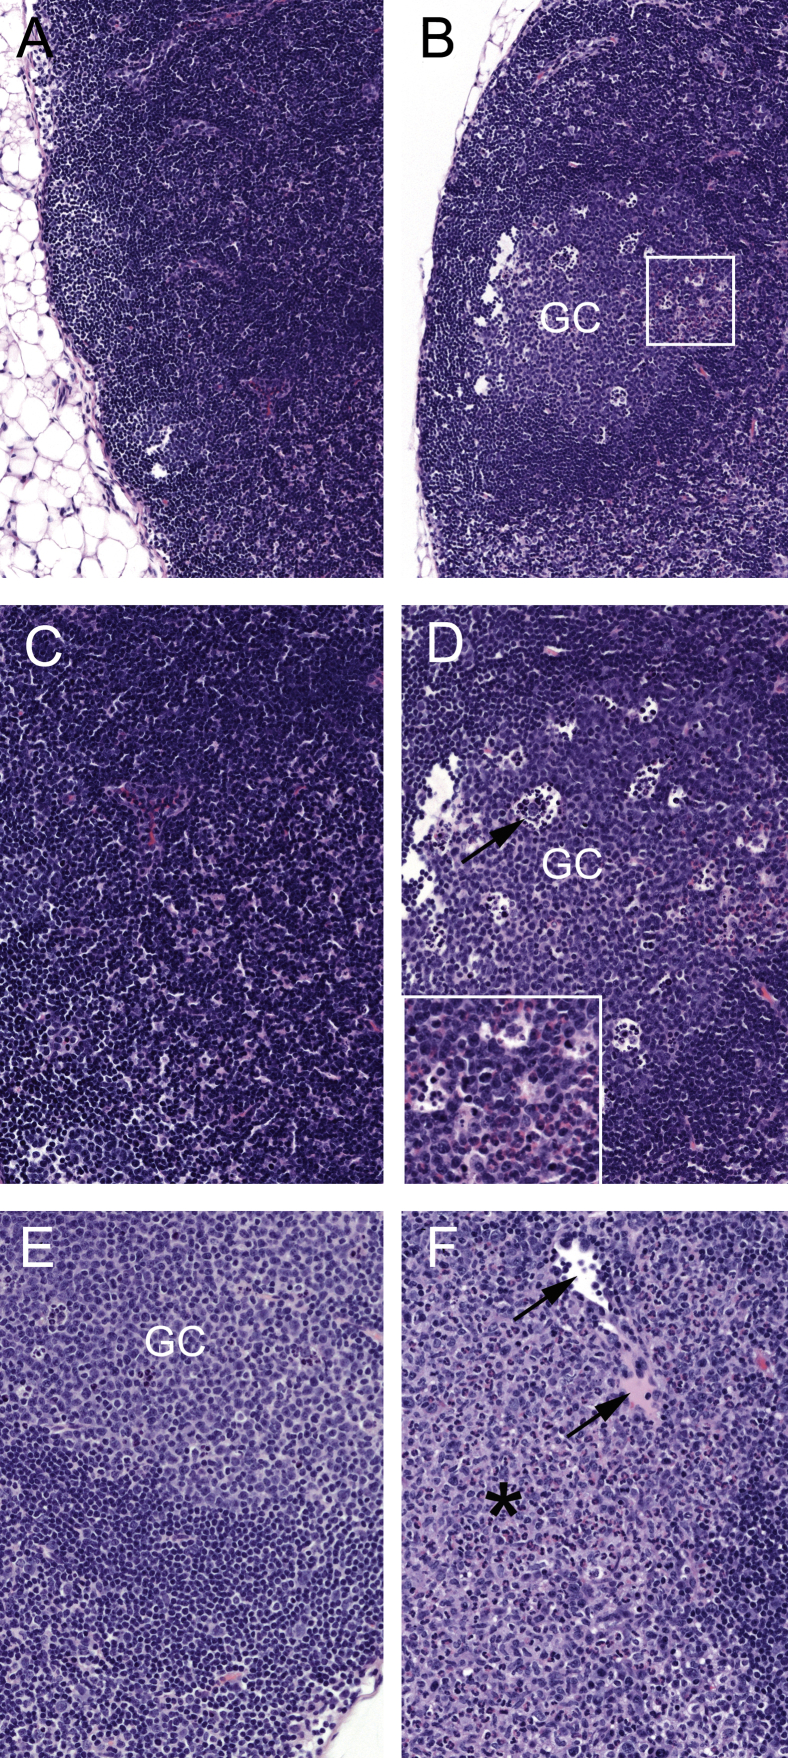
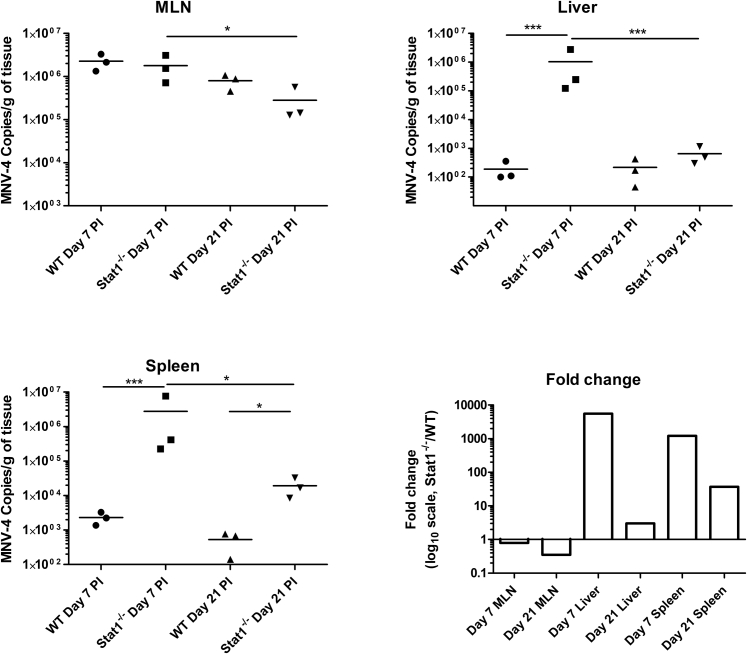
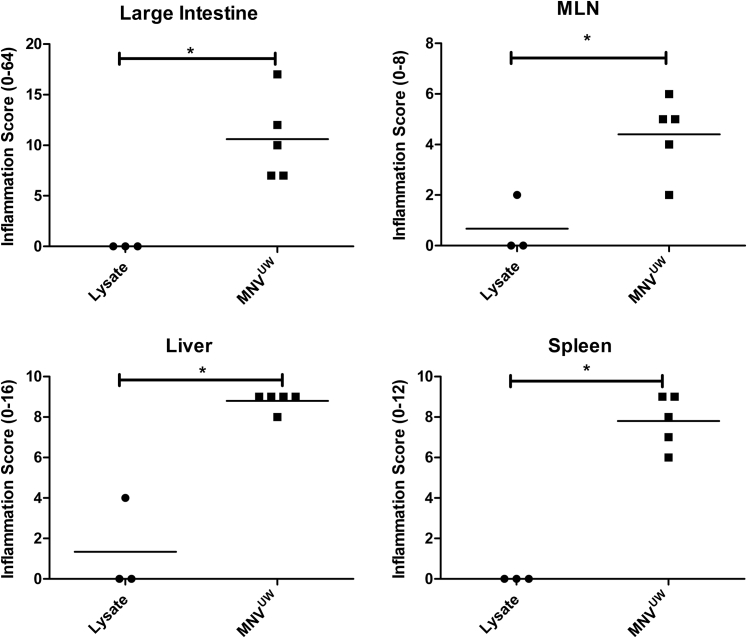
Murine norovirus (MNV) is an RNA virus that can prove lethal in mice with impaired innate immunity. We found that MNV-4 infection of Stat1-/- mice was not lethal, but produced a 100% penetrant, previously undescribed lymphatic phenotype characterized by chronic-active lymphangitis with hepatitis, splenitis, and chronic cecal and colonic inflammation. Lesion pathogenesis progressed from early ileal enteritis and regional dilated lymphatics to lymphangitis, granulomatous changes in the liver and spleen, and, ultimately, typhlocolitis. Lesion development was neither affected by antibiotics nor reproduced by infection with another enteric RNA virus, rotavirus. MNV-4 infection in Stat1-/- mice decreased expression of vascular endothelial growth factor (Vegf) receptor 3, Vegf-c, and Vegf-d and increased interferon (Ifn)-γ, tumor necrosis factor-α, and inducible nitric oxide synthase. However, anti-IFN-γ and anti-tumor necrosis factor-α antibody treatment did not attenuate the histologic lesions. Studies in Ifnαβγr-/- mice suggested that canonical signaling via interferon receptors did not cause MNV-4-induced disease. Infected Stat1-/- mice had increased STAT3 phosphorylation and expressed many STAT3-regulated genes, consistent with our findings of increased myeloid cell subsets and serum granulocyte colony-stimulating factor, which are also associated with increased STAT3 activity. In conclusion, in Stat1-/- mice, MNV-4 induces lymphatic lesions similar to those seen in Crohn disease as well as hepatitis, splenitis, and typhlocolitis. MNV-4-infected Stat1-/- mice may be a useful model to study mechanistic associations between viral infections, lymphatic dysfunction, and intestinal inflammation in a genetically susceptible host.


Figures

Figure 1
Figure 1
MNV-4–induced disease in Stat1−/− mice. Female Stat1−/− mice were infected with MNV-4 or gavaged with lysate control and necropsied 62 days p.i. A: Gross image of an MNV-4–infected mouse with enlarged spleen and liver lesions. B: Enlarged mesenteric lymph nodes of the same mouse with higher magnification of attached mesentery shown in the inset. C: Spleen with inflammatory foci in another MNV-4–infected mouse. Inset: High magnification of pyogranulomatous foci. D: Liver with periportal inflammation and bridging pyogranuloma. Inset: Liver pyogranuloma. E: Colon and attached mesentery. Insets: Intralymphatic pyogranulomatous inflammation (left inset) and mild chronic-active mucosal inflammation (right inset). All histology panels are stained with hematoxylin and eosin. n = 10 MNV-4-infected (5 MNV-4H and 5 MNV-4C); n = 3 (lysate control). Original magnification: ×40 (B, C, and E, main images); ×400 (B, inset); ×100 (D, main image, and E, inset); ×200 (C and D, insets).
Figure 2
Figure 2
Small intestinal lesions in MNV-4–infected Stat1−/− mice early after infection. A: At day 3 after MNV-4 infection, there is minimal to mild neutrophilic, lymphocytic, and proliferative ileitis centered on hypercellular gut-associated lymphoid tissue (GALT). B: Ectatic lacteals (asterisk) contain pink fluid and accumulations of mononuclear cells; GALT with germinal center (GC) is shown. Inset: High magnification of ectatic lacteal. C: Mixed neutrophilic and lymphocytic inflammation in the lamina propria (LP) with crypt basophilia and prominent mitotic figures (arrow). D: Prominent apoptotic cellular debris in the follicle-associated epithelium (arrow) and the subepithelial dome region (SED) of Peyer's patch. Hematoxylin and eosin staining was used. A summary of these findings and animal numbers evaluated are presented in Table 1. Original magnification: ×100 (A and B, main image); ×200 (B, inset); ×600 (C); ×400 (D).
Figure 3
Figure 3
Regional lymphatic lesions in MNV-4–infected Stat1−/− mice at 21 days p.i. A: IIeocecocolic junction for orientation; large intestine (LI) and small intestine (SI) are indicated. There is severe inflammation of the regional lymphatics within the intestine and adherent mesentery. Boxed areas are shown at higher magnification in B and C. B–F: Lymphatics in the tunica muscularis and serosa are expanded and obliterated by dense accumulations of mononuclear cells within a fibrillary pink matrix admixed with low numbers of granulocytes. Mesenteric lymphatics are ectatic with intraluminal aggregates of mononuclear cells embedded in a pink fibrillary matrix surrounded by thin flat endothelium, which is LYVE-1 positive (brown staining). A summary of these findings and animal numbers evaluated are presented in Table 1. Boxed areas in B and C are shown at higher magnification in D and E, respectively. Original magnification: ×40 (A); ×100 (B and C); ×200 (D and F); ×400 (E).
Figure 4
Figure 4
Evaluation of the role of gut bacteria in disease progression in MNV-4–infected Stat1−/− mice. Stat1−/− animals, aged 7 and 8 weeks, were gavaged with either control (flavored vehicle without antibiotics) or antibiotic solution for 5 days and then placed on antibiotic water for 3 more days before gavage with MNV-4 or lysate. Antibiotic water was continued for the duration of the experiment (20 days p.i.). Possible score range for each tissue is indicated on the y axis (parentheses). Mesenteric lymph node (MLN) inflammation score is the summed adenitis and lymphangitis scores of MLN and any associated mesentery. Antibiotic treatment (Abx) does not produce significant differences in disease severity in MNV-4–infected mice. Significant pairwise comparisons are shown (U-test). P < 0.05, ∗∗P < 0.01, and ∗∗∗P < 0.001.
Figure 5
Figure 5
Changes in immune cells in MNV-4–infected mesenteric lymph node (MLN). Absolute numbers (A) or percentage (B) of various MLN cell subsets was determined, and fold change compared with one arbitrary control sample was calculated for the three treatment groups. Data were compiled from two separate experiments (day 5 and day 19 p.i.), with lysate samples from both experiments combined into one group. The dashed line in each graph shows a fold change of one (no change from lysate). Significant differences compared with lysate control are indicated. n = 6 (A and B, lysate, lymphoid cell subsets); n = 5 (A and B, lysate, myeloid subsets, and days 5 and 19 after MNV-4 infection). P < 0.05, ∗∗P < 0.01, and ∗∗∗P < 0.001. DC, dendritic cell; FO, follicular; MZ, marginal zone; NK, natural killer; SSC, side scatter.
Figure 6
Figure 6
Anti-cytokine treatment of MNV-4–infected Stat1−/− mice. Stat1−/−.mice were treated with anti–interferon (IFN)-γ or anti–tumor necrosis factor (TNF)-α antibodies 1 day before MNV infection, 2 days p.i., and then twice weekly for the duration of the study (20 days p.i.). Inflammation scores of mesenteric lymph node (MLN; A), colon (B), spleen (C) and liver (D) determined by histologic analysis are shown. Statistical comparison between MNV-infected groups was by nonparametric analysis of variance with Dunn's post test. MNV-4–infected mice were compared with lysate controls with the U-test. P < 0.05, ∗∗P < 0.01.
Figure 7
Figure 7
Mesenteric lymph node (MLN) Janus kinase/STAT array results in uninfected or MNV-4–infected (day 7 p.i.) wild-type and Stat1−/− mice. A clustergram of STAT-induced genes generated by unsupervised clustering of fold change data normalized to the mean expression of all genes is shown. Dendrogram clusters represent coregulated genes. Shown at the right are the STATs associated with induction of each gene (as defined by Qiagen in the array), with STAT3-pathway associations highlighted in yellow.
Figure 8
Figure 8
STAT3 phosphorylation in mesenteric lymph node (MLN) and bone marrow of MNV-4–infected mice. Protein lysates were prepared from cell suspensions generated from MLN and bone marrow of Stat1−/− mice gavaged with either control lysate (Lys) or MNV-4 and collected at 7 days p.i. Western blots for STAT3 phosphorylation (STAT3-P), total STAT3, and β-actin are shown in MLN (A) and bone marrow (B) for one of the three experiments. Signals were quantified from gel images with ImageJ (bar graphs). Data are expressed as means ± SEM (A and B). P < 0.05, ∗∗P < 0.01 (two-tailed unpaired t-test). WT, wild type.
Supplemental Figure S1
Mesenteric lymph nodes (MLNs) of Stat1−/− mice infected with either MNV-4 or lysate at day 3 and day 7 p.i. A and C: At 3 days p.i., MLNs from lysate mice are normal. B and D: In contrast, MLNs from MNV-4–infected mice have mild neutrophilic lymphadenitis (B, boxed region, and D, inset) and lymphoid hyperplasia with germinal centers (GCs) and tingible body macrophages (arrow). E: At 7 days p.i., MLNs from lysate mice have mild lymphoid hyperplasia with GC formation. F: MLNs from MNV-4–infected mice have lymphoid hyperplasia and focal mild pyogranulomatous lymphadenitis (asterisk) with a dilated lymphatic (arrows). All histology panels are stained with hematoxylin and eosin. Original magnification: ×100 (A and B); ×200 (C–F, and D, inset).
Supplemental Figure S3
Increased MNV-4 genomic copies in spleen and liver of Stat1−/− mice compared with wild-type (WT) mice. Stat1−/− and WT mice were infected with MNV-4. On day 7 or 21 p.i., tissues were collected, RNA was extracted, and quantitative RT-PCR for MNV-4 was performed to determine the copies of MNV-4 per mg of the indicated tissue in the top left, top right, and bottom left panels. Average fold change is summarized in the bottom right panel. Data were log transformed, and statistical significance was determined by analysis of variance, followed by Tukey's post test. n = 3 per group. P < 0.05, ∗∗∗P < 0.001. MLN, mesenteric lymph node.
Supplemental Figure S4
Tissue inflammation scores of Stat1−/− mice infected with MNVUW (20 days p.i.). P < 0.05 (U-test). MLN, mesenteric lymph node.

References

    1. Crohn B.B., Ginzburg L., Oppenheimer G.D. Regional ileitis a pathologic and clinical entity. J Am Med Assoc. 1932;99:1323–1329. - PubMed
    1. Warren S., Sommers S.C. Cicatrizing enteritis as a pathologic entity: analysis of 120 cases. Am J Pathol. 1948;24:475–501. - PMC - PubMed
    1. Lockhart-Mummery H.E., Morson B.C. Crohn's disease of the large intestine. Gut. 1964;5:493–509. - PMC - PubMed
    1. Becker F., Potepalov S., Shehzahdi R., Bernas M., Witte M., Abreo F., Traylor J., Orr W.A., Tsunoda I., Alexander J.S. Downregulation of FoxC2 increased susceptibility to experimental colitis: influence of lymphatic drainage function? Inflamm Bowel Dis. 2015;21:1282–1296. - PMC - PubMed
    1. Alexander J.S., Chaitanya G.V., Grisham M.B., Boktor M. Emerging roles of lymphatics in inflammatory bowel disease. Ann N Y Acad Sci. 2010;1207 Suppl 1:E75–E85. - PubMed

Publication types

MeSH terms