. 2018 May 22;114(10):2473-2482.
doi: 10.1016/j.bpj.2018.04.038. Epub 2018 May 10.

Membrane Potential Distinctly Modulates Mobility and Signaling of IL-2 and IL-15 Receptors in T Cells

Affiliations

Membrane Potential Distinctly Modulates Mobility and Signaling of IL-2 and IL-15 Receptors in T Cells

Éva Nagy et al. Biophys J. .

Abstract

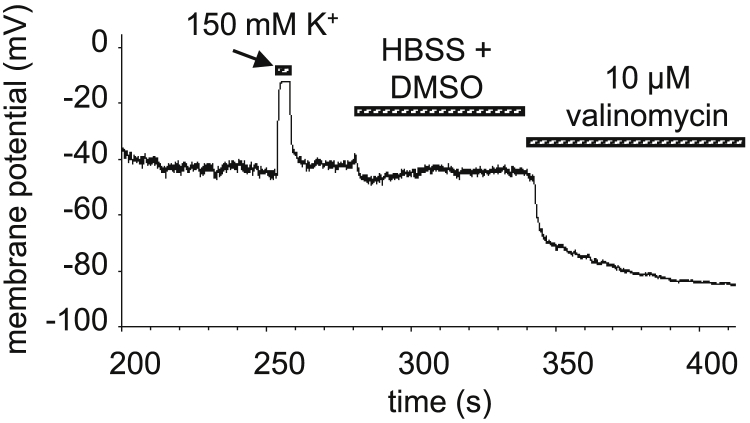
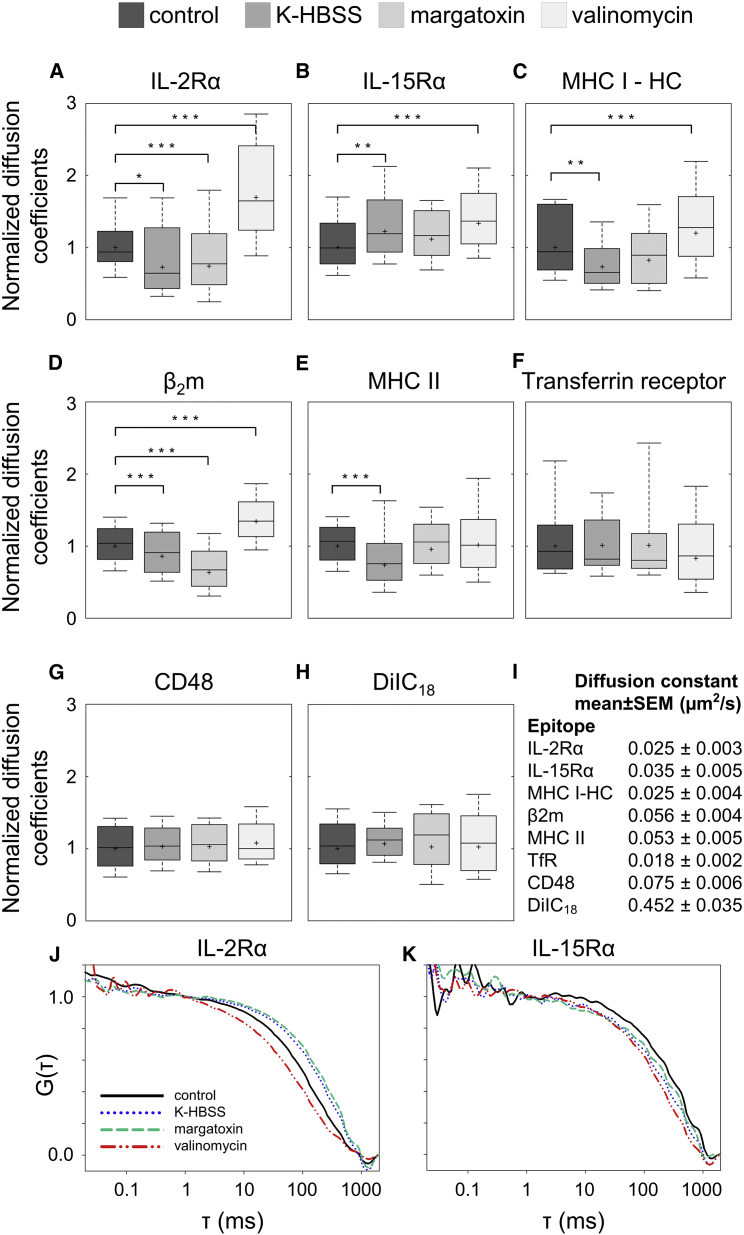
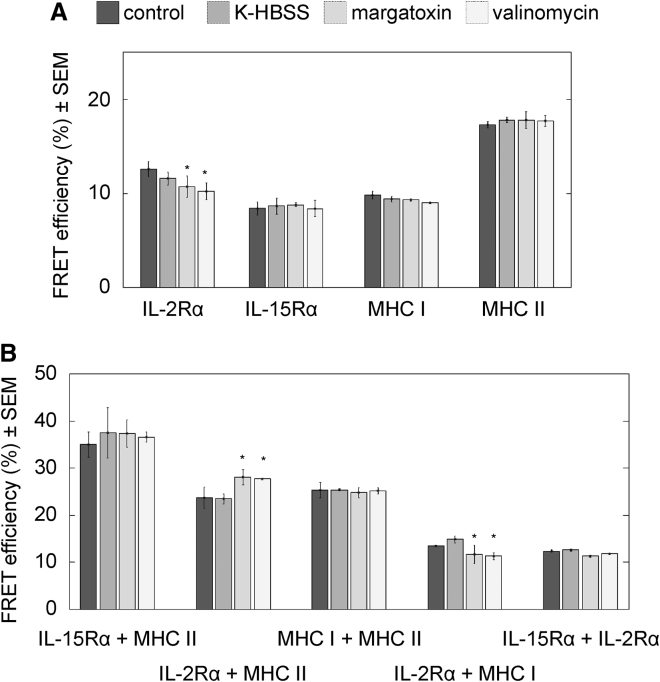
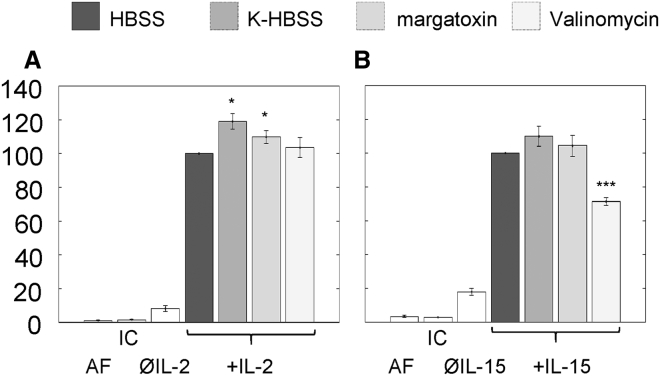
The high electric field across the plasma membrane might influence the conformation and behavior of transmembrane proteins that have uneven charge distributions in or near their transmembrane regions. Membrane depolarization of T cells occurs in the tumor microenvironment and in inflamed tissues because of K+ release from necrotic cells and hypoxia affecting the expression of K+ channels. However, little attention has been given to the effect of membrane potential (MP) changes on membrane receptor function. Therefore, we studied the influence of membrane de- and hyperpolarization on the biophysical properties and signaling of interleukin-2 (IL-2) and interleukin-15 (IL-15) receptors, which play important roles in T cell function. We investigated the mobility, clustering, and signaling of these receptors and major histocompatibility complex (MHC) I/II glycoproteins forming coclusters in lipid rafts of T cells. Depolarization by high K+ buffer or K+ channel blockers resulted in a decrease in the mobility of IL-2Rα and MHC glycoproteins, as shown by fluorescence correlation spectroscopy, whereas hyperpolarization by the K+ ionophore valinomycin increased their mobility. Contrary to this, the mobility of IL-15Rα decreased upon both de- and hyperpolarization. These changes in protein mobility are not due to an alteration of membrane fluidity, as evidenced by fluorescence anisotropy measurements. Förster resonance energy transfer measurements showed that most homo- or heteroassociations of IL-2R, IL-15R, and MHC I did not change considerably, either. MP changes modulated signaling by the two cytokines in distinct ways: depolarization caused a significant increase in the IL-2-induced phosphorylation of signal transducer and activator of transcription 5, whereas hyperpolarization evoked a decrease only in the IL-15-induced signal. Our data imply that the MP may be an important modulator of interleukin receptor signaling and dynamics. Enhanced IL-2 signaling in depolarized Treg cells highly expressing IL-2R may contribute to suppression of antitumor immune surveillance.


Figures

Figure 1
Figure 1
Membrane potential changes on K6 cells. Membrane potential was measured by patch clamp with perforated patch configuration. Depolarization was achieved by the high K+ buffer K-HBSS. K-HBSS was washed out with the perfusion system for repolarization, and then hyperpolarization was induced by valinomycin (10 μM).
Figure 2
Figure 2
Dependence of FCS-determined diffusion coefficients of membrane components on the membrane potential (AI). All measurements were carried out on K6 cells except with IL-15Rα, which was measured on FT7.10 cells. Control samples were incubated in HBSS, and depolarization was achieved by K-HBSS buffer or by margatoxin (1.5 nM); hyperpolarization was induced by valinomycin (10 μM). (AH) D values were normalized to the geometric mean (marked by asterisk) measured at resting MP; the horizontal line marks the median, the boxes denote the 25 and 75 percentile values, and the whiskers indicate the 10 and 90 percentile values. (I) Geometric mean of D and SEs are shown (n: 32–207 cells/treatment). Statistically significant changes relative to the control sample are marked as p < 0.05, ∗∗p < 0.01, and ∗∗∗p < 0.001. (J and K) Autocorrelation functions of IL-2Rα and IL-15Rα are shown (tagged by Alexa488-anti-Tac Fab and Alexa488-anti-FLAG Fab). The curves shown are the averages of normalized autocorrelation curves for n = 14–20 cells per treatment. To see this figure in color, go online.
Figure 3
Figure 3
Homoassociations (A) and heteroassociations of (B) of IL-2Rα, IL-15Rα, MHC I, and MHC II detected by flow cytometric FRET measurements on FT7.10 cells. Receptors were labeled with donor-tagged (Alexa 546) and acceptor-tagged (Alexa 647) mAbs. The average FRET efficiencies from three independent experiments are shown; in each experiment, >10,000 cells were measured per treatment. Control samples were incubated in HBSS, and depolarization was achieved either by K-HBSS buffer or by margatoxin (1.5 nM); hyperpolarization was induced by valinomycin (10 μM). Statistically significant changes relative to the control sample are marked as p < 0.05. Histograms of donor and acceptor intensity are shown; FRET efficiency as well as the dependence of FRET efficiency on the acceptor expression level is shown in Fig. S1.
Figure 4
Figure 4
Signaling efficiency of IL-2 and -15 receptors. Flow cytometry was used to measure STAT5 phosphorylation on a cell-by-cell basis using Alexa647-anti-PSTAT mAbs. Control samples were incubated in HBSS, and depolarization was achieved either by K-HBSS buffer or by margatoxin (1.5 nM); hyperpolarization was induced by valinomycin (10 μM). (A) K6 cells were stimulated with IL-2 (50 pM, 10 min, 37°C). (B) FT7.10 cells were treated with IL-15 (50 pM, 5 min, 37°C). Data from labeled samples were corrected with the mean fluorescence of the isotype controls (IC) and normalized to the intensities measured at resting MP. Autofluorescence (AF) is also shown. The third columns (ØIL-2, ØIL-15) display the normalized basal STAT5 phosphorylation in the absence of cytokine. Averages ± SEM of n = 6 independent measurements are presented. Statistically significant changes relative to the control sample are marked as p < 0.05 and ∗∗∗p < 0.001. Gating strategies and histograms of cell-by-cell PSTAT5 distributions are shown in Fig. S2.

References

    1. Fehniger T.A., Cooper M.A., Caligiuri M.A. Interleukin-2 and interleukin-15: immunotherapy for cancer. Cytokine Growth Factor Rev. 2002;13:169–183. - PubMed
    1. Waldmann T.A. The biology of interleukin-2 and interleukin-15: implications for cancer therapy and vaccine design. Nat. Rev. Immunol. 2006;6:595–601. - PubMed
    1. Waldmann T.A., Dubois S., Tagaya Y. Contrasting roles of IL-2 and IL-15 in the life and death of lymphocytes: implications for immunotherapy. Immunity. 2001;14:105–110. - PubMed
    1. Germain R.N. MHC-dependent antigen processing and peptide presentation: providing ligands for T lymphocyte activation. Cell. 1994;76:287–299. - PubMed
    1. Damjanovich S., Bene L., Waldmann T.A. Preassembly of interleukin 2 (IL-2) receptor subunits on resting Kit 225 K6 T cells and their modulation by IL-2, IL-7, and IL-15: a fluorescence resonance energy transfer study. Proc. Natl. Acad. Sci. USA. 1997;94:13134–13139. - PMC - PubMed

Publication types

Substances

LinkOut - more resources