. 2018 Jun 6;98(5):963-976.e5.
doi: 10.1016/j.neuron.2018.04.021. Epub 2018 May 10.

A Genetically Encoded Biosensor Reveals Location Bias of Opioid Drug Action

Affiliations

A Genetically Encoded Biosensor Reveals Location Bias of Opioid Drug Action

Miriam Stoeber et al. Neuron. .

Abstract

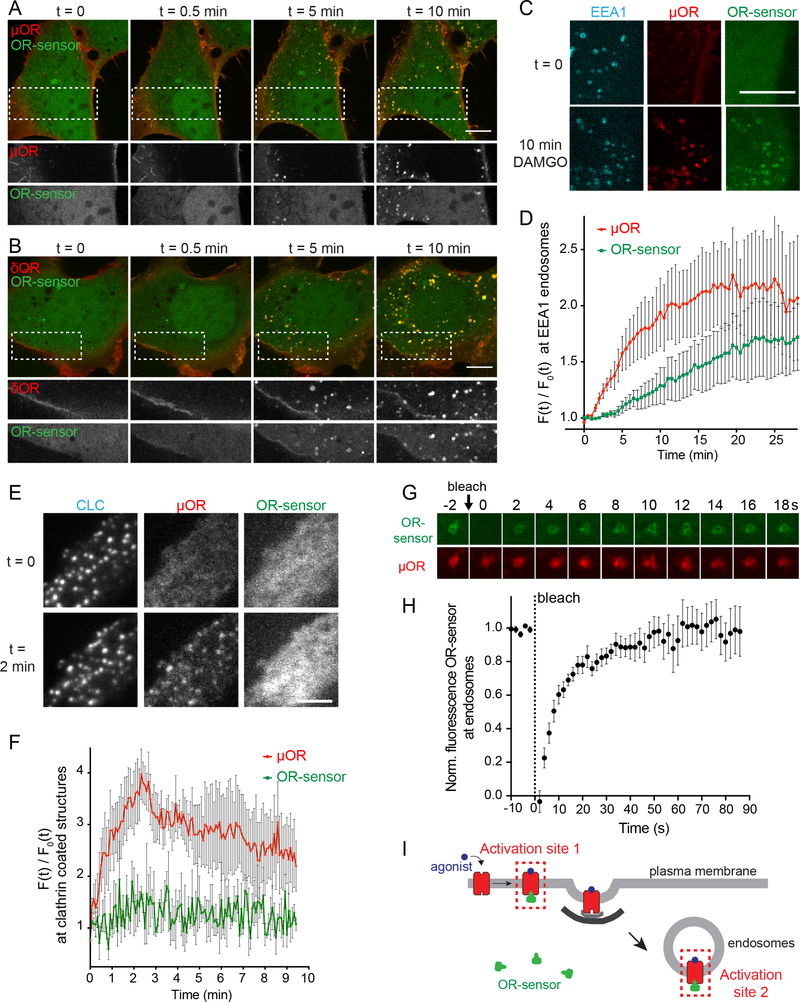
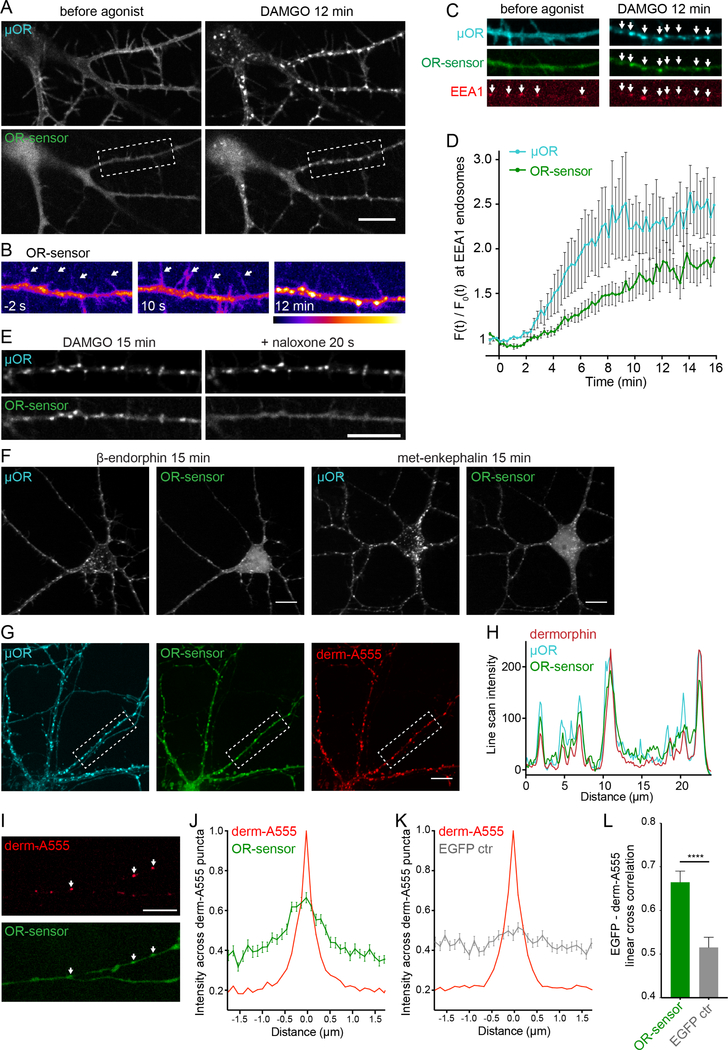
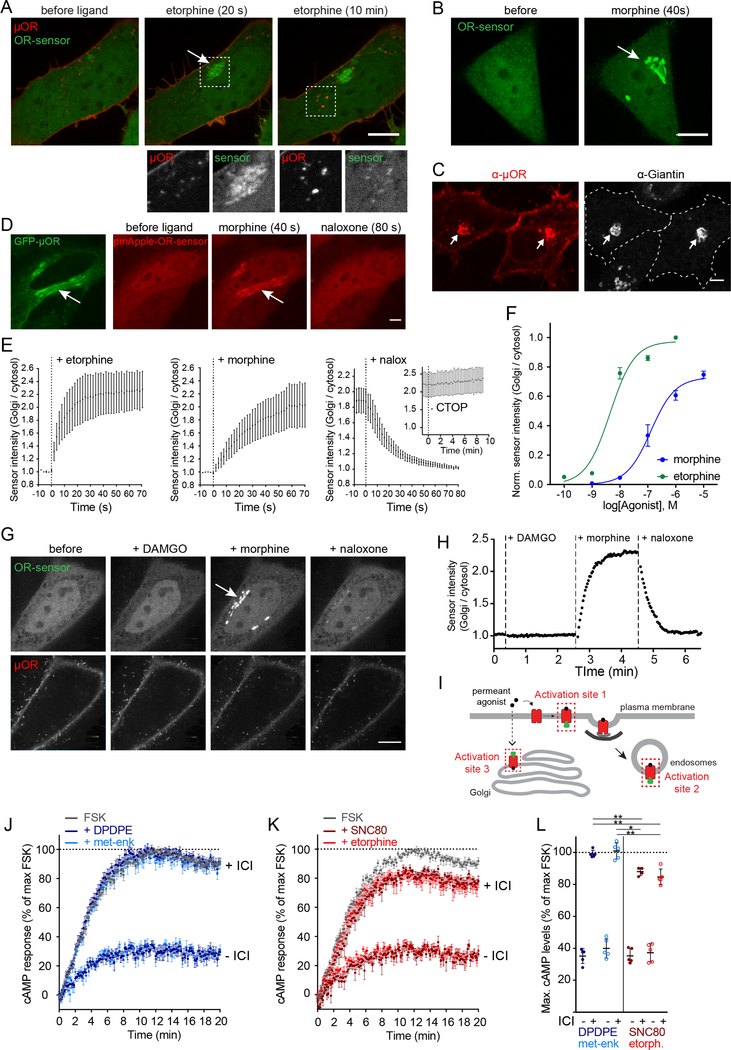
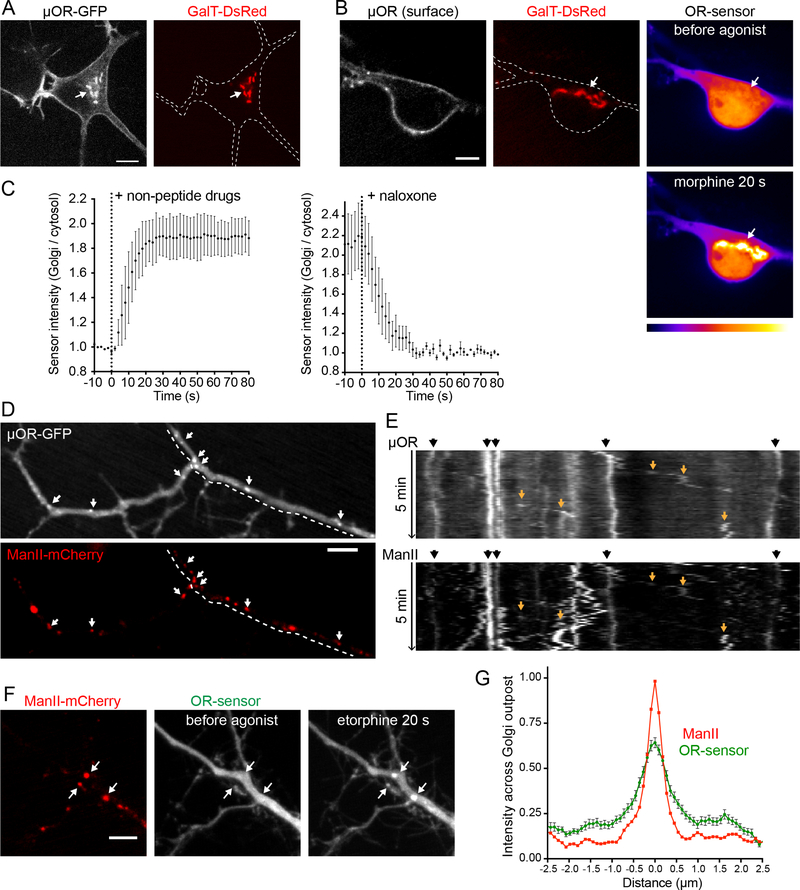
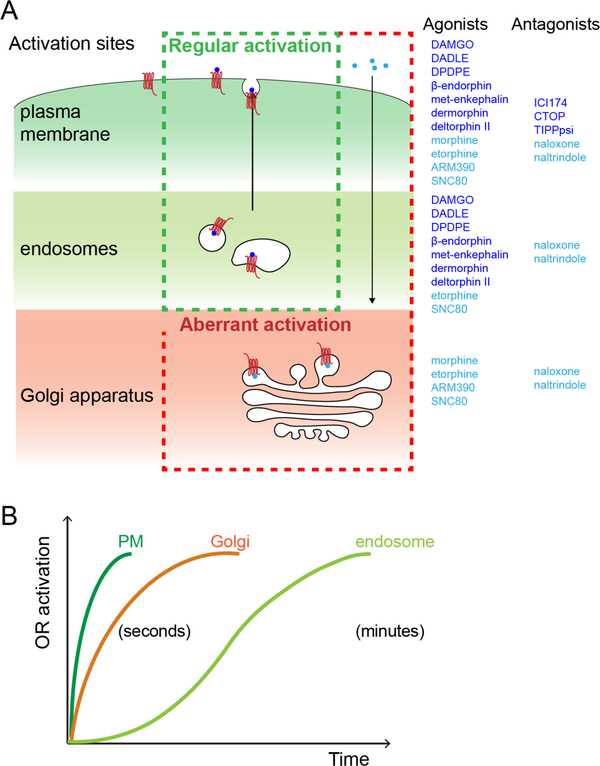
Opioid receptors (ORs) precisely modulate behavior when activated by native peptide ligands but distort behaviors to produce pathology when activated by non-peptide drugs. A fundamental question is how drugs differ from peptides in their actions on target neurons. Here, we show that drugs differ in the subcellular location at which they activate ORs. We develop a genetically encoded biosensor that directly detects ligand-induced activation of ORs and uncover a real-time map of the spatiotemporal organization of OR activation in living neurons. Peptide agonists produce a characteristic activation pattern initiated in the plasma membrane and propagating to endosomes after receptor internalization. Drugs produce a different activation pattern by additionally driving OR activation in the somatic Golgi apparatus and Golgi elements extending throughout the dendritic arbor. These results establish an approach to probe the cellular basis of neuromodulation and reveal that drugs distort the spatiotemporal landscape of neuronal OR activation.

Keywords: GPCR; Golgi; biosensor; endosome; ligand bias; ligand-induced activation; opioid drug; opioid receptor; signaling; subcellular location.


Conflict of interest statement

Declaration of Interests

The authors declare no competing interests.

Figures

Figure 1:
Figure 1:. A conformational biosensor for direct detection of OR activation.
(A) Crystal structures of inactive, β-FNA-bound (PDB: 4DKL) and active, BU27-bound (PDB: 5C1M) MOR (red). The active conformation is stabilized by a nanobody (Nb39, green), named OR-sensor. Ligands are in blue. Arrow: outward movement of TM6 upon activation. See also Figure S1. (B) Schematic of OR-sensor and MOR localization in cells and expected OR-sensor re-localization upon agonist addition. Total internal reflection fluorescence microscopy (TIR-FM) light beam is indicated. PM = plasma membrane. (C) TIR-FM images of a time series of a HEK293 cell, expressing EGFP-OR-sensor (and MOR, not shown). Media exchange to DAMGO (1 μM, agonist) or naloxone (10 μM, antagonist) by perfusion. Scale bar: 10 μm. See also Movie S1. (D) EGFP-OR-sensor intensity during TIR-FM time-lapse series with media exchange to DAMGO and naloxone. 2 s between frames. F0 = average fluorescence intensity before agonist. See also Figure S2. (E & F) Recruitment and detachment kinetics of OR-sensor to MOR or DOR, measured by EGFP-OR-sensor intensity increase using TIR-FM. 2 s between frames. Normalization of EGFP-intensity values (range [0–1]). Data fit with one-phase exponential association or decay formula. (E) HEK293 cells expressing MOR and OR-sensor. Left: DAMGO (1 μM) was applied by media perfusion starting at t = 0. (n=9, average +/− sem). Right: media exchange from DAMGO (1 μM) to naloxone (10 μM) or no agonist (washout) (naloxone: n=4, washout n=8, average +/− sem). (F) HEK293 cells expressing DOR and OR-sensor. Left: DADLE (1 μM) was applied by media perfusion starting at t = 0 (n=5, average +/− sem). Right: Media exchange from DADLE (1 μM) to naloxone (10 μM) (n=5, average +/− sem). (G) EGFP-OR-sensor intensity measured by TIR-FM in a HEK293 cell expressing OR-sensor and DOR (not shown). Repeated media exchange to 1 μM DADLE (1 min), 10 μM naloxone (2 min), and wash out (2 min). (H) Maximal cAMP response measured by pGloSensor cAMP sensor in HEK293 cells expressing DOR and EGFP-control or EGFP-OR-sensor. Cells were stimulated with Forskolin (FSK, 2 μM) and different concentrations of DAMGO. Data normalized to 100% FSK control. (n=3, average +/− SD, n.s. = no significant difference, unpaired t test). (I) EGFP-OR-sensor intensity during TIR-FM time-lapse series of a HEK293 cell, co-expressing EGFP-OR-sensor and MOR, adding increasing concentrations of DAMGO. 5 s between frames. (J) Concentration-dependent recruitment of ORsensor to MOR measured by TIR-FM (n=5, average +/− sem). Normalization of EGFP-intensity values (range [0–1]). Regression curves with Hill slope of 1. EC50: DAMGO: 57 nM, morphine: 20 nM, etorphine: 0.7 nM. (K) Western Blot analysis of EGFP-OR-sensor biotinylation by engineered ascorbate peroxidase (APEX)-fused to MOR captured by streptavidin agarose resin, showing untreated cells or cells treated with DAMGO, naloxone, or DAMGO followed by naloxone.
Figure 2:
Figure 2:. An endosome-localized wave of OR activation.
(A & B) Confocal images of time series of HEK293 cells, expressing EGFP-OR-sensor and FLAGMOR (A) or FLAG-DOR (B). Receptors were surface-labeled with anti-FLAG M1-AF555. 10 μM DAMGO (A) or DADLE (B) was added at t=0. Boxed areas are displayed separately for both fluorophores below respective images. Scale bar: 10 μm. See also Movies S2 and S3. (C) Maximum Z-projection of 12 confocal slices of a HEK293 cell, expressing EGFP-OR-sensor, FLAG-MOR (surface-labeled with M1-AF647, red), and an early endosomal marker (DsRed-EEA1-FYVE, blue) before (t=0) and after (t=15 min) adding DAMGO (10 μM). Images are representative examples used for quantification shown in (D). Scale bar 10 μm. (D) Quantification and kinetics of MOR and OR-sensor recruitment to EEA1 endosomes. F0 = average fluorescence signal in EEA1 mask before agonist addition. Movie length 25 min, 30 s between Z-stacks (n=5, average +/− sem). (E) TIR-FM images of a time series of a HEK293 cell, co-expressing clathrinlight-chain (CLC)-DsRed, FLAG-MOR (surface-labeled with M1-AF647) and EGFP-OR-sensor. DAMGO (10 μM) was added at t=0. Scale bar 5 μm. See also Figure S3. (F) Quantification of MOR and OR-sensor intensity in clathrin-coated pits (CCPs) vs. PM over time. CLC-positive spots were used as quantification mask. F0 = average fluorescence signal in CCPs before agonist addition. Movie length 10 min, 5 s between frames (n=3, average +/− sem). (G) Fluorescencerecovery after photobleaching (FRAP) series displaying intensity of EGFP-OR-sensor (photobleached) and MOR (surface-labeled with M1-AF647) at a bleached endosome, 2 s intervals. (H) FRAP of EGFP-OR-sensor at MOR-loaded endosomes in HEK293 cells, stimulated for 15 min with DAMGO (10 μM). Normalized EGFP-OR-sensor florescence in bleached area over time. 2 s interval between frames during acquisition (n=7, average +/− sem) (I) Scheme depicting the two distinct sites of OR-sensor recruitment to peptide ligand activated receptors: activation site 1: plasma membrane, activation site 2: endosomes.
Figure 3:
Figure 3:. Endosomal OR activation is ligand-dependent and sustained.
(A) Probing OR activation in endosomes using OR-sensor. (B) Confocal images of a HEK293 cell expressing MOR (surface-labeled with M1-AF555) and EGFP-OR-sensor. Top: 15 min after adding DAMGO (1 μM). Bottom: 30 s after adding naloxone (10 μM). Scale bar: 10 μm. (C) Quantification of EGFP-OR-sensor intensity at MOR-containing endosomes (treated for 15 min with 1 μM DAMGO) after adding 10 μM of non-peptide (naloxone) or peptide (CTOP) antagonist or upon agonist washout. EEA1-endosomes were used as quantification mask and intensity normalized to cytoplasmic OR-sensor signal at each time point. Naloxone: 2 s between frames, n=6, CTOP: 30 s between frames, n=4, washout: 30 s between frames, n=3, average +/− sem. (D) Quantification of EGFP-OR-sensor intensity at DOR-containing endosomes (15 min 1 μM DADLE) after adding 10 μM of non-peptide (naltrindole) or peptide (TIPPpsi) antagonist or upon agonist washout. DOR-positive endosomes were used as quantification mask and intensity normalized to cytoplasmic OR-sensor signal at each time point. Naltrindole: 2 s between frames, n=5, TIPPpsi: 30 s between frames n=5, washout: 30 s between frames, n=5, average +/− sem. (E) Experimental setup to test endosomal OR signaling. (F) cAMP response in living HEK293 cells expressing DOR and the luciferase cAMP reporter GloSensor-20F. Forskolin (FSK, 2 μM)-induced cAMP response (black curve) and effect of persistent presence of DOR agonist (1 μM DADLE, grey curve) and agonist removal (1 μM DADLE, followed by washout, blue curve) (n=5, average +/− sem). (G) Same experiments as in (F) in the presence of the endocytosis inhibitor Dyngo-4a (30 μM) (n=4, average +/− sem).
Figure 4:
Figure 4:. OR activation in somatodendritic endosomes.
(A) Striatal neuron (12 DIV), expressing FLAG-MOR (surface-labeled with M1-AF555) and EGFPOR-sensor. Images of a time series, before and 12 min after adding DAMGO (10 μM). See also Movie S4. (B) Pseudocolor images (low to high intensity) of OR sensor, corresponding to boxed area in (A). Dendrite before (−2 s), immediately after (10 s) and 12 min after adding DAMGO. Arrows depict dendritic processes. (C) Dendrite of a striatal neuron (12 DVI), expressing FLAGMOR (surface-labeled with M1-AF647), OR-sensor, and EEA1 before agonist and 12 min after adding DAMGO (10 μM). Arrows depict EEA1-positive endosomes that contain MOR and recruit OR-sensor after agonist addition. (D) Quantification and kinetics of MOR and OR-sensor recruitment to EEA1 endosomes in dendrites. F0 = average fluorescence signal before agonist addition. Movie length 16 min, 5 s between frames (n=5, average +/− sem). (E) Localization of MOR and OR-sensor 15 min after adding DAMGO, and 20 s after adding naloxone (10 μM). (F) Confocal images of striatal neurons (12–14 DIV) expressing FLAG-MOR (surface-labeled with M1-AF647) and EGFP-OR-sensor, 15 min after adding β-endorphin (1 μM) or met-enkephalin (10 μM). See also Figure S4. (G) Confocal images showing localization of FLAG-MOR (surfacelabeled with M1-AF647, blue), EGFP-OR-sensor, and fluorescent dermorphin (derm-A555, red) in striatal neurons 15 min after derm-A555 addition. (H) Fluorescence intensity profile (line scan) of dermorphin (red), MOR (blue), and OR-sensor along dendritic process, boxed in (F). (I) Dendrite of a striatal neuron (14 DIV) expressing OR-sensor, incubated with derm-A555 (1 μM) for 15 min. Arrows depict dermorphin-loaded endosomes that co-localize with OR-sensor. (J,K) Average fluorescence intensity profile (line scans) of EGFP-OR-sensor (J) or EGFP control (K) along dendrite across derm-A555-labeled endosomes in striatal neurons. (OR-sensor: n=110 endosomes from 15 cells, EGFP-control: n=102 endosomes from 18 cells, average +/− sem.) (L) Peak cross correlation at derm-A555 puncta (average +/− sem). EGFP-OR-sensor = 0.6645 ± 0.0257, EGFP control = 0.5152 ± 0.0233, ****p <0.0001, unpaired t test. All scale bars: 10 μm.
Figure 5:
Figure 5:. Non-peptide drugs activate Golgi-localized ORs.
(A) Confocal images of a time series of a HEK293 cell, expressing EGFP-OR-sensor and FLAGMOR (surface-labeled with M1-AF555). Etorphine (1 μM) was added at t=0. Boxed areas are displayed separately for both fluorophores below respective images. See also Movie S5. (B) Confocal images of time series of a HeLa cells, expressing EGFP-OR-sensor and FLAG-MOR (not depicted). OR-sensor localization is shown before and 20 s after adding morphine (1 μM). (C) Confocal images of HeLa cells, expressing FLAG-MOR. Cells were fixed, permeabilized, and immunolabelled with anti-FLAG (red) and anti-Giantin (grey) antibodies. The internal OR pool colocalizes with Golgi marker (arrows). See also Figure S5A. (D) Rapid activation of Golgi-localized MORs by morphine. Confocal images of a time series of a HeLa cell, expressing MOR-EGFP and mCherry-OR-sensor. Cell was treated with morphine (1 μM), followed by naloxone (10 μM). See also Movie S6. (E) Quantification and kinetics of EGFP-OR-sensor intensity at Golgi apparatus upon agonist or antagonist addition in HeLa cells, expressing OR-sensor, GalT-DsRed, and MOR. GalT-marked Golgi apparatus was used as quantification mask and intensity normalized to cytoplasmic OR-sensor signal. Morphine n=4, etorphine n=3, 1 μM etorphine followed by 10 μM naloxone n=6, or by 10 μM CTOP n=5. 2 s intervals for non-peptide ligands, 15 s intervals for peptide ligand (CTOP), average +/− sem. See also Figure S5B–D. (F) Ligand concentrationdependent recruitment of OR-sensor to MOR in GalT-marked Golgi apparatus (n=5, average +/− sem). Normalization of EGFP-intensity values (range [0–1]). Regression curves with Hill slope of 1. EC50: morphine: 130 nM, etorphine: 4.5 nM. See also Figure S5E. (G) Confocal images of a time series of a HeLa cell, expressing EGFP-OR-sensor, FLAG-MOR (surface labeled with M1–647) and GalT-DsRed (Golgi-marker, not shown). Cell was treated with DAMGO (10 μM, t = 20 s), morphine (1 μM, t = 150 s), and naloxone (10 μM, t = 270 s). See also Figure S5F. (H) Quantification of EGFP-OR-sensor intensity at GalT-marked Golgi apparatus, normalized to cytoplasmic OR-sensor signal. 10 s between frames. (I) Scheme depicting three distinct sites of OR-sensor recruitment to activated receptors following etorphine addition: activation site 1: plasma membrane, activation site 2: endosomes, activation site 3: Golgi apparatus. (J) cAMP response in living HEK293 cells expressing DOR and the luciferase cAMP reporter GloSensor-20F. Forskolin (FSK, 2 μM)-induced cAMP response (grey curve) and effect of 100 nM DADLE or met-enkephalin in the absence (-ICI) or presence (+ICI) of 100 μM ICI-174,864 (n=5, average +/− sem). (K) Forskolin (FSK, 2 μM)-induced cAMP response (grey curve) and effect of 100 nM SNC80 or etorphine in the absence (-ICI) or presence (+ICI) of 100 μM ICI-174,864 (n=5, average +/− sem). (L) Maximum cAMP levels of experiments presented in (J) and (K) (average +/− SD). Unpaired t test between peptide or non-peptide agonists in the presence of ICI: DPDPE vs. SNC80 (p<0.05), or vs. etorphine (p<0.01), and met-enkephalin vs. SNC80 (p<0.01) or vs. etorphine (p<0.01). All scale bars: 10 μm.
Figure 6:
Figure 6:. OR activation in somatic Golgi and Golgi outposts of neurons.
(A) Soma of a striatal neuron (12 DIV), expressing MOR-EGFP and GalT-DsRed. Internal MORs co-localize with GalT-marked Golgi apparatus (arrow). (B) Soma of striatal neuron (14 DIV), expressing FLAG-MOR (surface-labeled with M1-AF647), GalT-DsRed, and OR-sensor (pseudocolored low to high intensity). OR-sensor distribution is depicted before agonist and 20 s after adding morphine (1 μM). See also Movie S7 and Figure S6. (C) Quantification and kinetics of EGFP-OR-sensor intensity at somatic Golgi upon non-peptide agonist or antagonist addition in striatal neurons, expressing OR-sensor, FLAG-MOR, and GalT-DsRed. Time series with 5 s intervals. Left: Averaged data using non-peptide drugs, from n=2 morphine (1 μM) and n=2 etorphine (1 μM). Left: 1 μM etorphine followed by naloxone (10 μM), n=3. Average +/− sem. (D) Dendrite of a striatal neuron (13 DIV), expressing MOR-EGFP and ManII-mCherry (Golgi-outpost (GOP) marker). Puncta of MOR co-localize with GOP (arrows). (E) 5 min kymograph along the dendritic branch highlighted by dashed line in (D). Black arrows (top): stable dendritic GOPs appear as straight, vertical lines. Orange arrows (in kymograph): sloped traces of mobile secretory carriers. (F) Dendrite of a striatal neuron (12 DIV), expressing ManII-mCherry, EGFP-OR-sensor, and FLAG-MOR (not depicted). OR-sensor distribution before agonist and 20 s after adding etorphine (1 μM). GOPs recruit OR-sensor upon receptor activation (arrows). (G) Average fluorescence intensity profile (line scan) of EGFP-OR-sensor across ManII-labeled GOPs after adding etorphine. n=47 GOPs from 14 cells, average +/− sem. All scale bars: 10 μm.
Figure 7:
Figure 7:. Spatiotemporal landscape of OR activation in the cell.
(A) Summary of findings: Activation of OR occurs at distinct cellular membrane compartments in a ligand-dependent manner. Peptides agonists tested (dark blue) drive a ‘regular’ activation pattern, with two sequential waves of OR activation, first in plasma membrane and then in endosomes following internalization of the receptor. Non-peptide agonist (light blue) distort this pattern by activating a Golgi-localized internal OR pool (‘aberrant’ activation). The distinct OR activation sites are differentially affected by peptide (dark blue) and non-peptide (light blue) antagonists. (B) Kinetics of OR activation at distinct cellular membrane compartments. Activation of ORs in PM and the Golgi apparatus occurs within seconds of agonist application. The endosome activation wave lags several minutes.

Comment in

References

    1. Arttamangkul S, Alvarez-Maubecin V, Thomas G, Williams JT, and Grandy DK (2000). Binding and internalization of fluorescent opioid peptide conjugates in living cells. Mol. Pharmacol 58, 1570–1580. - PubMed
    1. Arttamangkul S, Torrecilla M, Kobayashi K, Okano H, and Williams JT (2006). Separation of mu-opioid receptor desensitization and internalization: endogenous receptors in primary neuronal cultures. J. Neurosci 26, 4118–4125. - PMC - PubMed
    1. Bradbury AF, Smyth DG, and Snell CR (1976). Biosynthetic origin and receptor conformation of methionine enkephalin. Nature 260, 165–166. - PubMed
    1. Calebiro D, Nikolaev VO, Gagliani MC, de Filippis T, Dees C, Tacchetti C, Persani L, and Lohse MJ (2009). Persistent cAMP-Signals Triggered by Internalized G-Protein-Coupled Receptors. PLoS Biol. 7, e1000172–25. - PMC - PubMed
    1. Calebiro D, Nikolaev VO, Persani L, and Lohse MJ (2010). Signaling by internalized Gprotein-coupled receptors. Trends Pharmacol. Sci 31, 221–228. - PubMed

Publication types

MeSH terms