. 2018 Jun 7;102(6):1031-1047.
doi: 10.1016/j.ajhg.2018.03.023. Epub 2018 May 10.

A Statistical Framework for Mapping Risk Genes from De Novo Mutations in Whole-Genome-Sequencing Studies

Affiliations

A Statistical Framework for Mapping Risk Genes from De Novo Mutations in Whole-Genome-Sequencing Studies

Yuwen Liu et al. Am J Hum Genet. .

Abstract

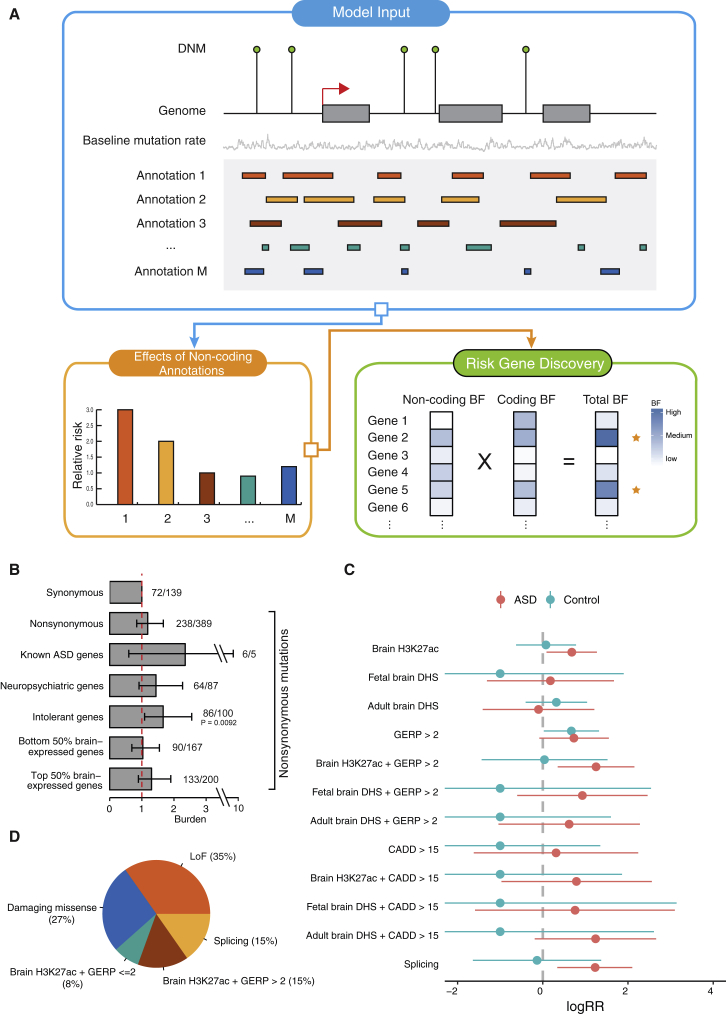
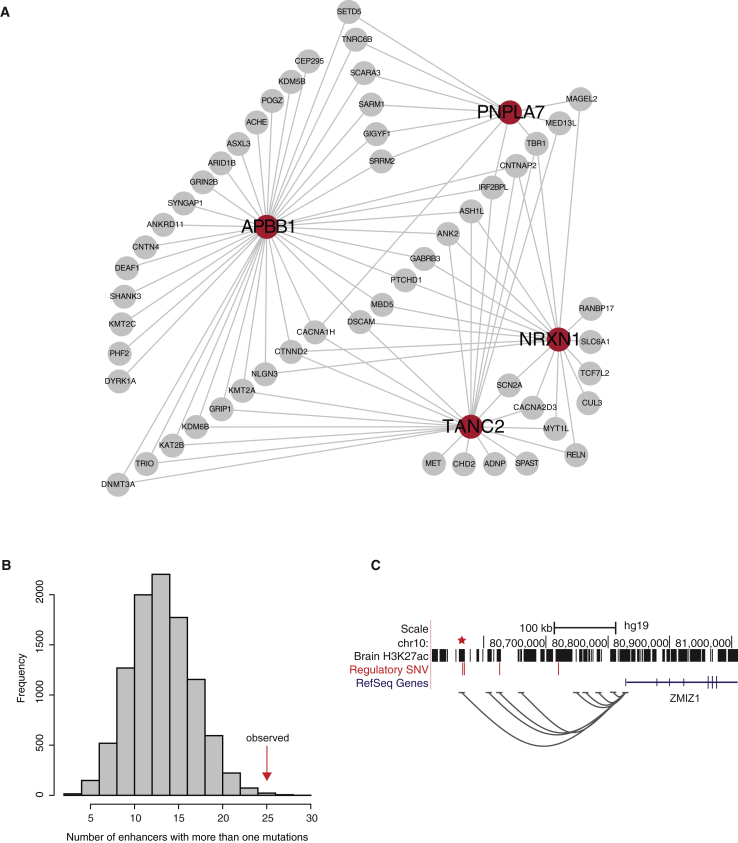
Analysis of de novo mutations (DNMs) from sequencing data of nuclear families has identified risk genes for many complex diseases, including multiple neurodevelopmental and psychiatric disorders. Most of these efforts have focused on mutations in protein-coding sequences. Evidence from genome-wide association studies (GWASs) strongly suggests that variants important to human diseases often lie in non-coding regions. Extending DNM-based approaches to non-coding sequences is challenging, however, because the functional significance of non-coding mutations is difficult to predict. We propose a statistical framework for analyzing DNMs from whole-genome sequencing (WGS) data. This method, TADA-Annotations (TADA-A), is a major advance of the TADA method we developed earlier for DNM analysis in coding regions. TADA-A is able to incorporate many functional annotations such as conservation and enhancer marks, to learn from data which annotations are informative of pathogenic mutations, and to combine both coding and non-coding mutations at the gene level to detect risk genes. It also supports meta-analysis of multiple DNM studies, while adjusting for study-specific technical effects. We applied TADA-A to WGS data of ∼300 autism-affected family trios across five studies and discovered several autism risk genes. The software is freely available for all research uses.

Keywords: autism; de novo mutations; epigenomics; noncoding sequences; psychiatric disorders; statistical model.


Figures

Figure 1
Figure 1
TADA-A and Its Application in Studying the Genetic Basis of ASD (A) Overview of TADA-A. The blue frame illustrates the inputs of the model, including mutation counts, baseline mutation rates, and annotations (assumed to be binary). The orange frame shows an example of relative risk estimates of different noncoding annotations by TADA-A. The green frame illustrates our gene mapping strategy. For each gene, we derived its noncoding BF based on the relative risks of its noncoding mutations and calibrated mutation rates, which is then multiplied to the gene’s coding BF to get a total BF. (B) Burden analyses of different types of de novo nonsynonymus mutations. The error bars represent the 95% confidence intervals of burdens (ORs), based on Fisher’s exact tests. On the top of each bar, we labeled the number of mutations in ASD followed by in control. (C) Estimated relative risks of different annotations using ASD DNMs and control DNMs. The x axis is the Log(Relative risks). The error bars represent the 95% confidence intervals. (D) Partition of de novo ASD risk into coding and non-coding mutations.
Figure 2
Figure 2
Predicted Risk Genes and Enhancers of ASD (A) GeneMania network analysis of the four “novel ASD genes.” Red circles represent novel ASD genes while gray circles represent known ones. Two genes are connected if their co-expression across multiple tissues reaches a threshold. Only connections between the two gene sets are shown. (B) Distribution of the number of enhancers with recurrent (two or more) de novo SNVs from 10,000 simulations. The vertical red arrow marks the observed number of enhancers with recurrent de novo SNVs. (C) A distal enhancer (marked by a star) of ZMIZ1 with recurrent SNVs. Grey curves represent possible interactions between enhancers and promoters (correlated activities across multiple tissues). Note that the region contains two additional DNMs in other sequences.
Figure 3
Figure 3
Comparison of Power between WES and WGS from Simulations Power is measured as the number of discovered ASD risk genes at q-value < 0.1 and is obtained at each level of sample size (A) and sequencing cost (B). Error bars represent the standard deviations of the numbers of the discovered ASD risk genes.

References

    1. De Rubeis S., He X., Goldberg A.P., Poultney C.S., Samocha K., Cicek A.E., Kou Y., Liu L., Fromer M., Walker S., DDD Study. Homozygosity Mapping Collaborative for Autism. UK10K Consortium Synaptic, transcriptional and chromatin genes disrupted in autism. Nature. 2014;515:209–215. - PMC - PubMed
    1. Sanders S.J., He X., Willsey A.J., Ercan-Sencicek A.G., Samocha K.E., Cicek A.E., Murtha M.T., Bal V.H., Bishop S.L., Dong S., Autism Sequencing Consortium Insights into autism spectrum disorder genomic architecture and biology from 71 risk loci. Neuron. 2015;87:1215–1233. - PMC - PubMed
    1. Lelieveld S.H., Reijnders M.R.F., Pfundt R., Yntema H.G., Kamsteeg E.-J., de Vries P., de Vries B.B.A., Willemsen M.H., Kleefstra T., Löhner K. Meta-analysis of 2,104 trios provides support for 10 new genes for intellectual disability. Nat. Neurosci. 2016;19:1194–1196. - PubMed
    1. Fromer M., Pocklington A.J., Kavanagh D.H., Williams H.J., Dwyer S., Gormley P., Georgieva L., Rees E., Palta P., Ruderfer D.M. De novo mutations in schizophrenia implicate synaptic networks. Nature. 2014;506:179–184. - PMC - PubMed
    1. Allen A.S., Berkovic S.F., Cossette P., Delanty N., Dlugos D., Eichler E.E., Epstein M.P., Glauser T., Goldstein D.B., Han Y., Epi4K Consortium. Epilepsy Phenome/Genome Project De novo mutations in epileptic encephalopathies. Nature. 2013;501:217–221. - PMC - PubMed

Publication types