. 2018 Jun 5;26(6):848-856.e3.
doi: 10.1016/j.str.2018.04.004. Epub 2018 May 10.

Atomic Resolution Cryo-EM Structure of β-Galactosidase

Affiliations

Atomic Resolution Cryo-EM Structure of β-Galactosidase

Alberto Bartesaghi et al. Structure. .

Abstract

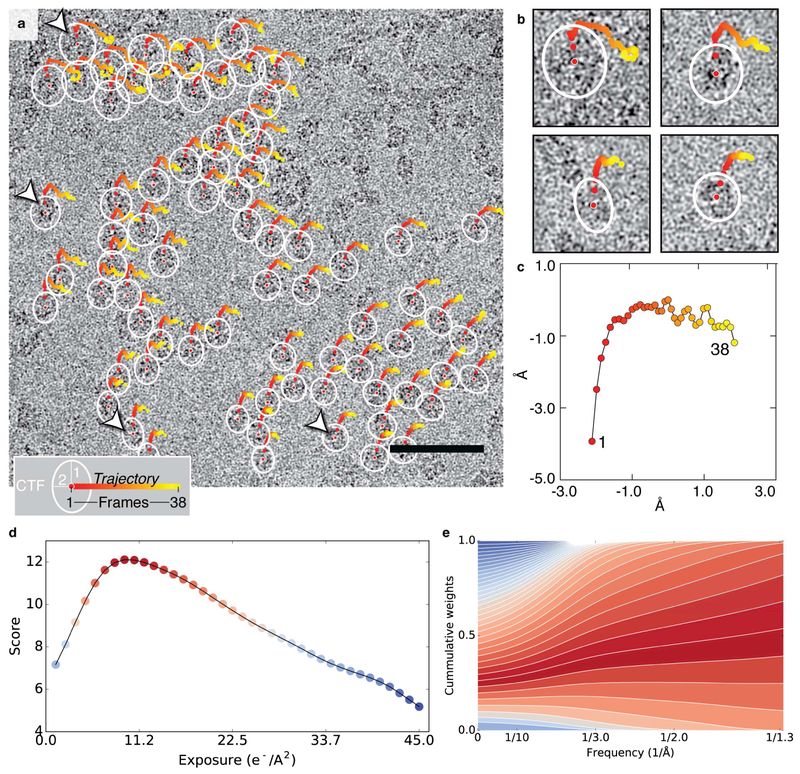
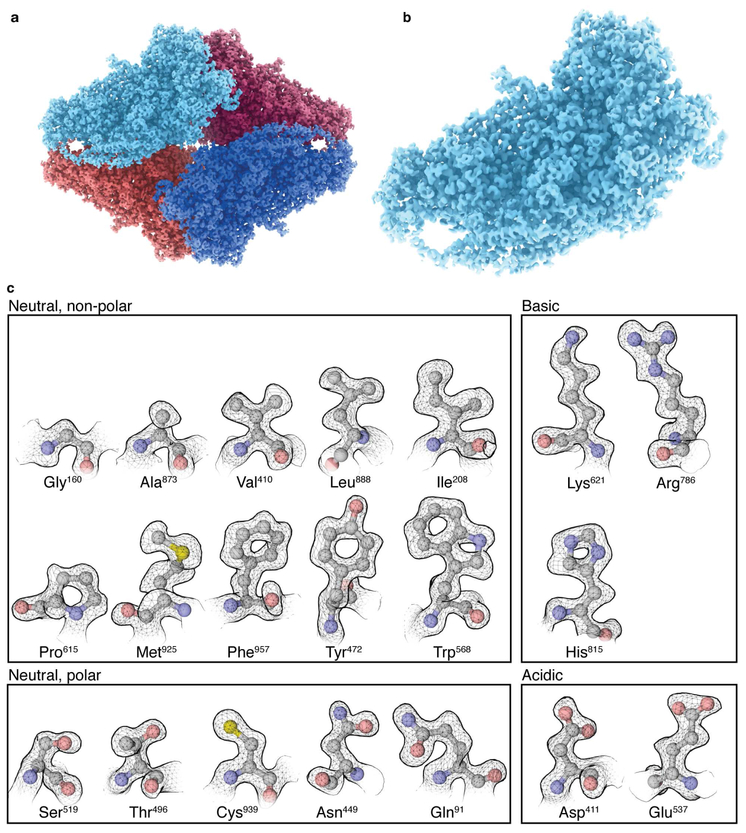
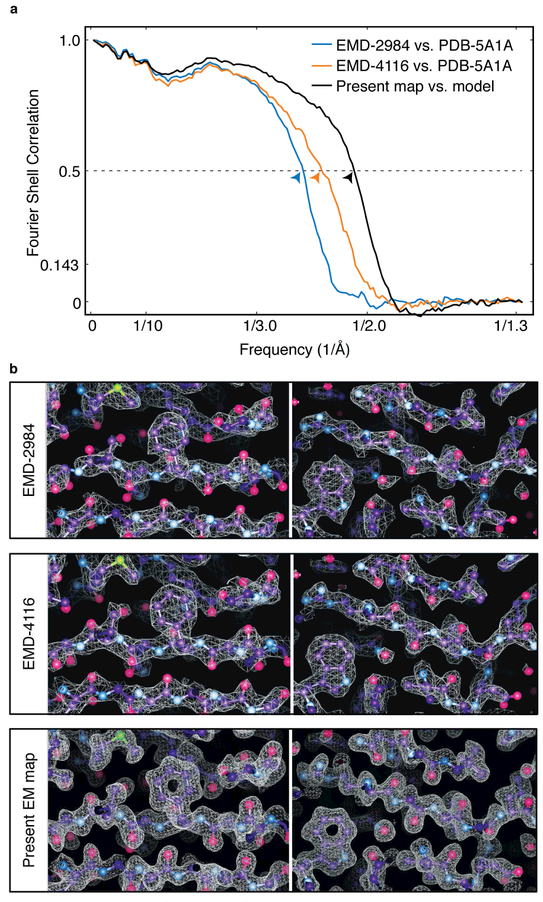
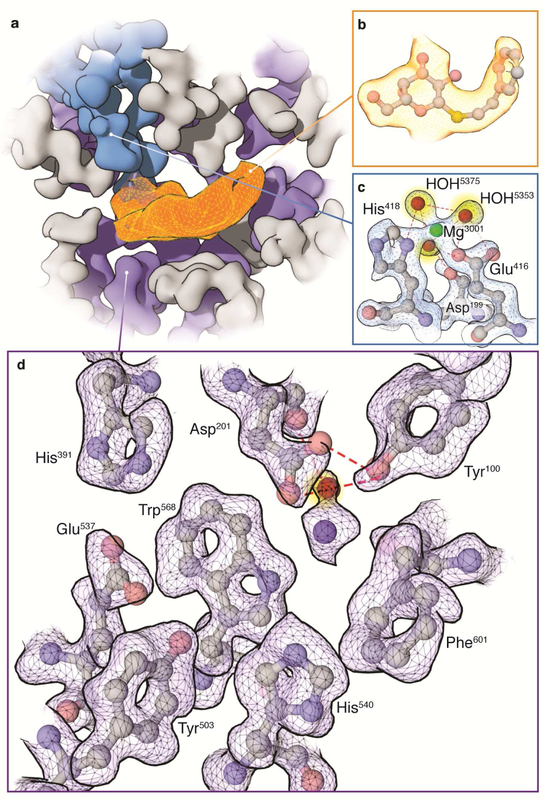
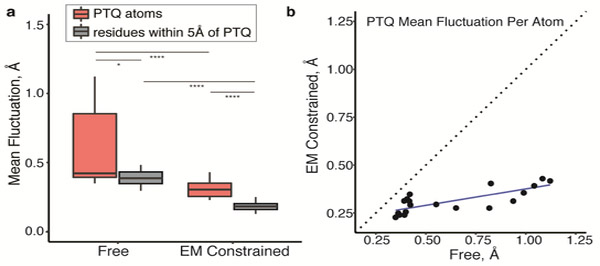
The advent of direct electron detectors has enabled the routine use of single-particle cryo-electron microscopy (EM) approaches to determine structures of a variety of protein complexes at near-atomic resolution. Here, we report the development of methods to account for local variations in defocus and beam-induced drift, and the implementation of a data-driven dose compensation scheme that significantly improves the extraction of high-resolution information recorded during exposure of the specimen to the electron beam. These advances enable determination of a cryo-EM density map for β-galactosidase bound to the inhibitor phenylethyl β-D-thiogalactopyranoside where the ordered regions are resolved at a level of detail seen in X-ray maps at ∼ 1.5 Å resolution. Using this density map in conjunction with constrained molecular dynamics simulations provides a measure of the local flexibility of the non-covalently bound inhibitor and offers further opportunities for structure-guided inhibitor design.

Keywords: atomic resolution; computer-aided drug discovery; drift correction; drug discovery; high-resolution protein structure; precision medicine; radiation damage; single-particle cryo-EM.


Figures

Figure 1.
Figure 1.. Per-particle drift movement and local CTF estimation.
a) Trajectories of individual particles from micrograph EMD-2984_0925 start at the center of the white ellipsoidal markers and range from red (first frame) to yellow (last frame). Defocus changes across the field of view are typically small and were encoded as follows to improve visualization: mean ellipse radius is proportional to the average defocus (DF1+DF2)/2 and ellipticity is proportional to the amount of astigmatism difference measured at the location of each particle with respect to the global astigmatism value. Scale bar is 50nm. b) Zoomed-in view of selected particles indicated by arrowheads in (a). c) Global drift trajectory obtained by averaging all local particle trajectories in this micrograph. d) Average FREALIGN score computed over all particles in each frame plotted as a function of the cumulative electron dose. High scores are shown in red and low scores in blue. e) Corresponding 2D weights showing the relative contribution of each frame to the weighted average as a function of spatial frequency (color scheme as in (d)). Related to Supplementary Figure 1.
Figure 2.
Figure 2.. Cryo-EM map and visualization of atomic resolution features.
a-b) Overview of β-galactosidase tetramer (a) and detailed view of asymmetric unit (b). c) Gallery of selected residues for each of the 20 amino acids showing delineation of the contours for non H-atoms as discrete, punctate features and clear density for side chains such as lysine and arginine that faithfully follow the kinks in the extended side chains. Related to Supplementary Figures 1-4 and Video 1.
Figure 3.
Figure 3.. Comparison with density maps of β-galactosidase obtained from EMPIAR-10061.
a) FSC plots of map against atomic model for our original map (EMD-2984), the one obtained by Scheres and co-workers using RELION (EMD-4116) and the present map, showing resolution improvements compared with the original map of ~0.2 Å and ~0.5 Å1 (corresponding to 0.5-FSC cutoffs of ~2.6 Å, ~2.4 Å and ~2.1 Å, respectively). The mask used for the FSC calculations includes the entire protein and is available from the EMDB (entry EMD-4116). b) Side-by-side comparison of regions surrounding residues 957 (left) and 353 (right) from the three maps, showing corresponding improvements in map appearance. Related to Supplementary Figure 4.
Figure 4.
Figure 4.. Visualization of the active site at atomic resolution.
a) Overview of contoured cryo-EM map highlighting density for PETG (orange), Mg+ interacting residues (blue), and selected neighboring residues (purple). b) Density for the ligand and fitted coordinates showing features consistent with resolutions of ~ 3 Å - 3.5 Å. In panels (a) and (b), density shown for PETG is from the unsharpened map because sharpening of this region with the same B-factor as the rest of the protein leads to increased noise and artifacts due to its lower resolution. c) Density for residues in the active site interacting with Mg+ (green) and visualization of water molecules (highlighted in yellow). d) Close-up view of density map and fitted atomic model for selected active site residues showing delineation of atomic contours. Related to Supplementary Video 1.
Figure 5.
Figure 5.. Local fluctuation of atomic positions in inhibitor and surrounding active site residues measured by molecular dynamics simulations.
a) Mean fluctuation in the absence (Free) or presence of map constraints (EM constrained) for atomic positions in PETG (coral), and residues within a 5 Å distance (gray) of the inhibitor. Center crossbar indicates median; boxplot shows quartiles. *p < 0.05; **** p < 0.0001. b) Non-uniform reduction in the per-atom fluctuation in PETG inhibitor when measured in the presence of map constraints.

References

    1. Abrishami V, Vargas J, Li X, Cheng Y, Marabini R, Sorzano C, Oscar S, and Carazo JM (2015). Alignment of direct detection device micrographs using a robust Optical Flow approach. Journal of Structural Biology 189, 163–176. - PubMed
    1. Aguerrebere C, Delbracio M, Bartesaghi A, and Sapiro G (2016). Fundamental Limits in Multi-Image Alignment. IEEE Transactions on Signal Processing 64, 5707–5722.
    1. Baker LA, Smith EA, Bueler SA, and Rubinstein JL (2010). The resolution dependence of optimal exposures in liquid nitrogen temperature electron cryomicroscopy of catalase crystals. Journal of Structural Biology 169, 431–437. - PubMed
    1. Bartesaghi A, Matthies D, Banerjee S, Merk A, and Subramaniam S (2014). Structure of β-galactosidase at 3.2-Å resolution obtained by cryo-electron microscopy. Proceedings of the National Academy of Sciences 111, 11709–11714. - PMC - PubMed
    1. Bartesaghi A, Merk A, Banerjee S, Matthies D, Wu X, Milne JL, and Subramaniam S (2015). 2.2 A resolution cryo-EM structure of beta-galactosidase in complex with a cell-permeant inhibitor. Science (New York, NY) 348, 1147–1151. - PMC - PubMed

Publication types