. 2018 Jun 5;27(6):1294-1308.e7.
doi: 10.1016/j.cmet.2018.04.013. Epub 2018 May 10.

The Polycomb-Dependent Epigenome Controls β Cell Dysfunction, Dedifferentiation, and Diabetes

Affiliations

The Polycomb-Dependent Epigenome Controls β Cell Dysfunction, Dedifferentiation, and Diabetes

Tess Tsai-Hsiu Lu et al. Cell Metab. .

Abstract

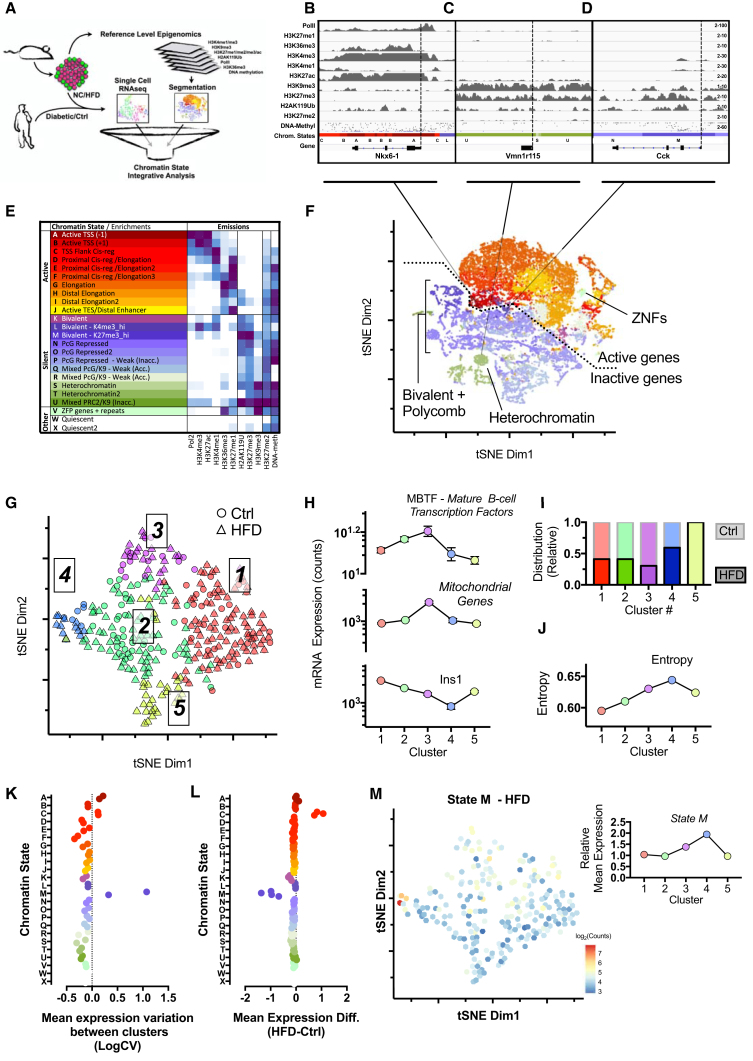
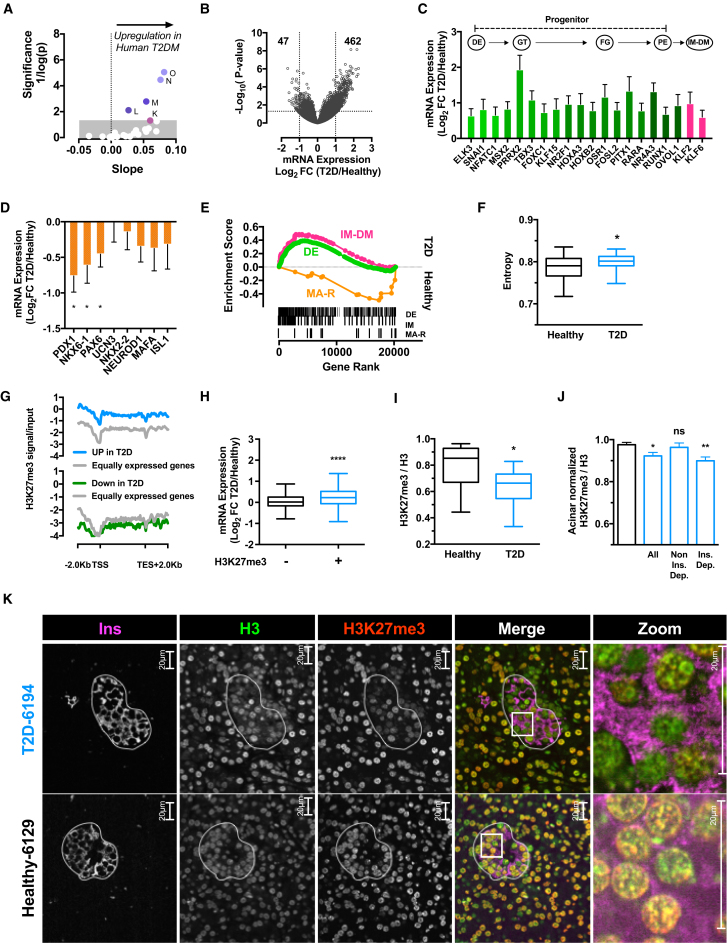
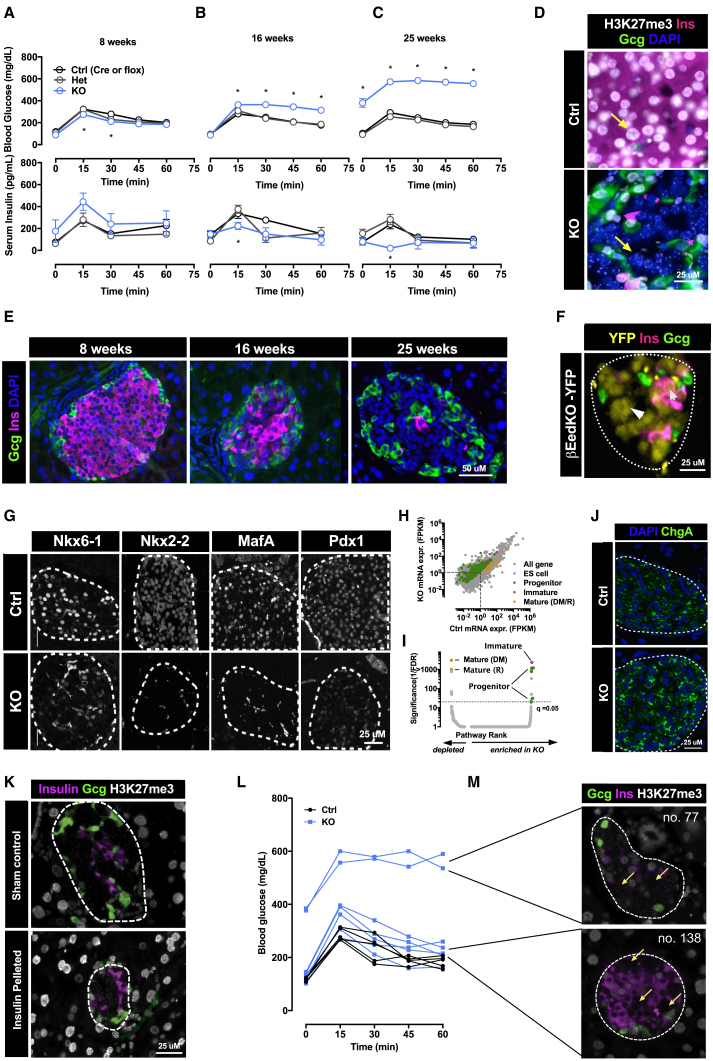
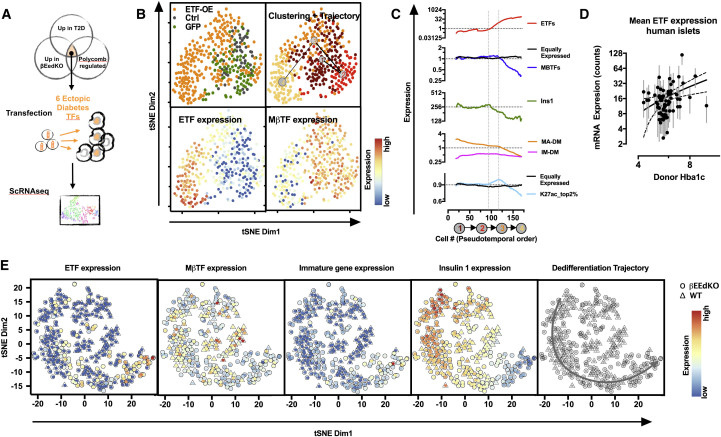
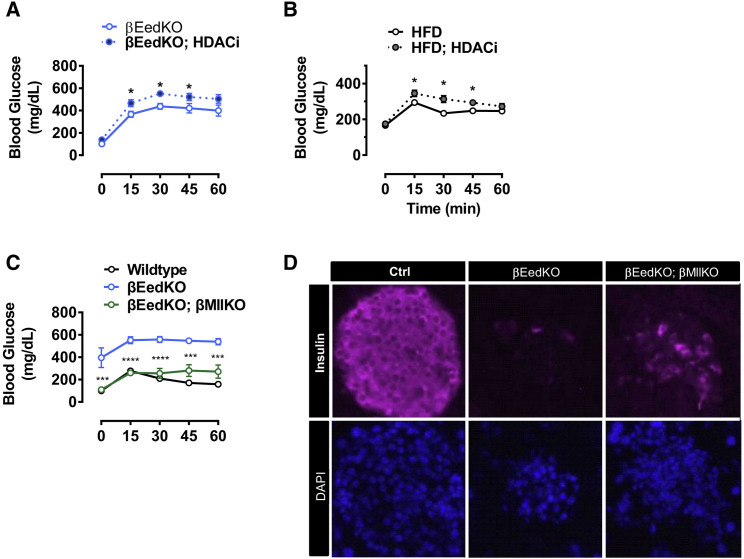
To date, it remains largely unclear to what extent chromatin machinery contributes to the susceptibility and progression of complex diseases. Here, we combine deep epigenome mapping with single-cell transcriptomics to mine for evidence of chromatin dysregulation in type 2 diabetes. We find two chromatin-state signatures that track β cell dysfunction in mice and humans: ectopic activation of bivalent Polycomb-silenced domains and loss of expression at an epigenomically unique class of lineage-defining genes. β cell-specific Polycomb (Eed/PRC2) loss of function in mice triggers diabetes-mimicking transcriptional signatures and highly penetrant, hyperglycemia-independent dedifferentiation, indicating that PRC2 dysregulation contributes to disease. The work provides novel resources for exploring β cell transcriptional regulation and identifies PRC2 as necessary for long-term maintenance of β cell identity. Importantly, the data suggest a two-hit (chromatin and hyperglycemia) model for loss of β cell identity in diabetes.

Keywords: Eed; Polycomb; cell identity; chromatin; complex diseases; de-differentiation; diabetes; epigenetic; type 2 diabetes; β cells.


Figures

None
Graphical abstract
Figure 1
Figure 1
Chromatin State-Specific Dysregulation Is a Hallmark of β Cell Dysfunction (A) Schematic of the generation, intersection, and analyses of chromatin driven regulatory events in β cell dysfunction. (B–D) Histone mark occupancy and DNA methylation state at (B). Nkx6-1 (state A), (C) Vmn1r115 (state S), and (D) Cck (state M) gene loci. Dashed line indicates transcription start site (TSS). (E) EpiCSeq chromatin-state segmentation in healthy islets and manual annotation according to emissions and annotations in D (Inacc, inaccessible; +1 or −1, ± nucleosome position around TSS). (F) tSNE representation of all genes highlighting chromatin states in annotated colors based on (E). Dotted line segregates active and inactive genes. Solid lines point toward the epigenomic cluster of Nkx6-1, Vmn1r115, and Cck genes, respectively. (G) tSNE representation of control diet (Ctrl) and high-fat diet (HFD) β cell transcriptomes clustering, indicating five distinct β cell sub-types. (H) Average expression of MBTFs (top), mitochondrial genes (middle), and insulin (Ins1, bottom) from clusters 1–5 from (G). (I) Relative fraction of cells across clusters 1–5 from (G) from either control (Ctrl) or high-fat diet (HFD)-treated samples. (J) Median entropy level across clusters 1–5 from (G). (K) Variation in mean gene expression in cluster 4 (Ctrl) and 5 (HFD) for all chromatin states. CV, coefficient of variation. (L) Difference in mean gene expression between HFD and Ctrl for each of clusters 1–4 for all chromatin states. (M) tSNE representation of mean expression levels of state M genes in HFD β cell transcriptomes (left panel). Relative mean expression of state M genes across clusters 1–5 (right panel). See also Figure S1.
Figure 2
Figure 2
Polycomb (Dys)regulation and Dedifferentiation in Human T2D (A) Significance and correlation (slope) of human orthologs embedded in respective mouse chromatin states in human T2D states (Fadista et al., 2014). Arrow indicates direction of positive correlation with gene upregulation in human T2D tested with linear regression. Upper boundary of gray box indicates p = 0.05. (B) Volcano plot of mRNA-seq data from human T2D islets. Horizontal dotted line indicates p = 0.05, vertical lines indicates ±2-fold difference. Number of significantly up- or downregulated genes are shown. (C) Mean expression fold change of transcription factors in mRNA-seq data from human T2D islets (gene sets from DE, definitive endoderm; GT, gut tube; FG, fore gut; PE, pancreatic endoderm; Xie et al., 2013) and immature β cells (IM-DM; Blum et al., 2012). Arrows represent hypothetical developmental trajectory. Genes listed show core enrichment in gene set enrichment analysis (GSEA) analysis and are significantly different between healthy and T2D islets with false discovery rate (FDR)-q < 0.05. (D) Mean expression fold change of MBTFs between human T2D and healthy islet transcriptomes. p < 0.05. (E) GSEA of definitive endoderm (DE) (Xie et al., 2013), immature (IM-DM) (Blum et al., 2012), and mature β cell genes (MA(R); REACTOME, regulation of gene expression in β cell) in human T2D islets. FDR-q < 0.05 for all gene sets shown. (F) Median entropy in T2D islet versus healthy islet transcriptomes. Boxplot whiskers indicate min to max. (G) Average H3K27me3 signal at genes up- or downregulated in T2D and equally expressed genes. TSS, transcription start site; TES, transcription end. (H) Boxplot of gene expression changes at H3K27me3 marked (+) and non-marked (−) genes in human T2D islets. (I and J) H3K27me3 immunostaining intensity in β cells of pancreatic sections from T2D donors (n = 11, blue) relative to healthy donors (n = 11, black), normalizing to H3 intensity from the same nuclei (I) and normalizing against same image acinar nuclei (J). T2D donors are combined (All) or stratified by insulin treatment dependency (Non Ins. Dep. or Ins. Dep.). (K) Representative images of a pancreatic islet (outlined) from a healthy (bottom) and T2D (top) donor pancreas sections. Zoomed-in areas are outlined in boxes. All data represent mean ± SEM, unless otherwise stated. Boxplot whiskers indicate 1.5 interquartile range, unless otherwise stated. p < 0.05, ∗∗p < 0.01, ∗∗∗∗p < 0.0001. ns, not significant. See also Figure S2.
Figure 3
Figure 3
Eed/PRC2 Deficiency Triggers Progressive β Cell Dedifferentiation and Diabetes (A) Schematic of the Eed targeting scheme. Light gray boxes depict exons (Xie et al., 2014). (B) Immunofluorescence staining for H3K27me1, H3K27me2, and H3K27me3 (gray), insulin (magenta), and glucagon (green) in Ctrl and βEedKO. Yellow arrows indicate β cell nuclei. (C) Representative images for H3K27me3 staining (gray) in Ctrl and βEedKO at the indicated ages. Insulin in magenta and glucagon in green. Yellow arrows indicate β cell nuclei. (D) Quantification of H3K27me3-positive β cell number in pictures of βEedKO islets versus control immunofluorescence stainings. (E) Mean β cell H3K27me3 fluorescence signals in βEedKO islets at different ages. (F) Quantification of total β cell mass (left) and insulin area (right) per islet in Ctrl and βEedKO animals. Data represent mean ± SEM of n = 4–5 mice per genotype for each experiment. Scale bars, 25 μM. See also Figure S3.
Figure 4
Figure 4
Eed/PRC2 Deficiency Triggers Progressive β Cell Dedifferentiation and Diabetes (A–C) Blood glucose (top) and insulin (bottom) levels during oral glucose tolerance test (1 g/kg) in βEedKO, control and heterozygote mice from 8 to 25 weeks of age. (D) Immunofluorescence staining for H3K27me3 (gray), insulin (magenta), and glucagon (green) in βEedKO and control islets. Yellow arrows indicate Ctrl and βEedKO cells harboring or lacking H3K27me3. (E) Immunofluorescence staining for insulin (magenta) and glucagon (green) on βEedKO islets from 8 to 25 weeks of age. (F) Representative image of βEedKO islets harboring an RIP-cre-inducible YFP lineage tracer (yellow) stained for insulin (magenta) and glucagon (green). Small white arrow indicates insulin and YFP-positive β cell; large white arrow indicates insulin-negative YFP-positive cell. White dotted line outlines the islet. (G) Immunofluorescence staining of βEedKO islets for Pdx1, Mafa, Nkx2-2, and Nkx6-1. White dashed lines outline the islets. (H) Scatterplot of mRNA-seq expression data from βEedKO and control islets. GSEA leading edge gene sets of “Progenitor” (green), “Immature” (magenta), and “Mature” (yellow) pathways are depicted (FDR < 0.05). Embryonic stem cell markers (violet) are not expressed. Dotted lines indicate fragments per kilobase of transcript per million mapped reads = 1. (I) GSEA analysis of mRNA-seq expression data of all Progenitor (green), Immature (magenta), and Mature (yellow) gene sets in βEedKO versus Ctrl islets. Dotted line indicates FDR-q < 0.05. (J) Immunofluorescence staining of βEedKO islets for chromogranin-A (green). (K) Representative immunostaining images for insulin (magenta) and glucagon (green) of βEedKO islets from animals treated with insulin pellet or sham controls for 7 weeks from 18 weeks of age. (L) Blood glucose levels during oral glucose tolerance test (1 g/kg) of 12-week-old Pdx1-Cre; EedKO (n = 6) or littermate control (n = 5). Each curve represent a single mouse. (M) Representative image of immunofluorescence staining of mosaic Eed/PRC2 loss-of-function deletion pattern in islets from the normoglycemic (no. 138, lower panel) and hyperglycemic (no. 77, upper panel) Pdx1-Cre; EedKO mice. Arrows indicate nuclei devoid of H3K27me3 signals. Data represent mean ± SEM. p < 0.05–0.0001. See also Figure S4.
Figure 5
Figure 5
Eed/PRC2 Maintains Global Transcriptional Silencing in Terminally Differentiated β Cells (A) Clustered heatmap showing log2 fold changes for significantly up- and downregulated genes of βEedKO islet gene expression at both 8 and 25 weeks of age. Samples 1–5 refer to individual βEedKO RNA-seq samples (n = 1–4 per sample). (B) Pie chart showing chromatin-state distribution of differentially expressed genes at both 8 and 25 weeks of age. Far right panel shows chromatin-state distribution of all genes. (C) Venn diagram indicating H3K27ac ChIP-seq peaks in βEedKO genome at either TSS (left) or non-TSS- (right) associated genomic loci in wild-type (WT) and βEedKO islets. (D) Genome browser view of histone mark occupancy and DNA methylation state at accessible promoter and enhancer regions (shaded gray). WT and KO tracks are overlaid for RNA and H3K27ac to facilitate comparison. (E) Scatterplot of H3K27ac ChIP-seq enrichment signal versus gene expression log2FC of βEedKO versus WT islets. H3K27ac ChIP-seq enrichment signal calculated as area under curve at TSS ± 100 nt (see the STAR Methods). MβTFs are depicted as blue circles. (F and G) H3K27ac and H3K4me3 ChIP enrichment peak breadth (TSS) rankings in both mouse and human. MβTFs are depicted in blue. See also Figure S5.
Figure 6
Figure 6
ETF Expression Drives Loss of Cell Identity in Min6 Cells (A) ETF expression experiment design. (B) t-SNE representation of control, GFP, and ETF overexpressing cells from scRNA-seq experiment (upper left panel). Four clusters identified by RaceID2 are depicted with a red color gradient (upper right panel). tSNE map superimposed by a color scheme, representing mean ETF expression (lower left panel) and MβTF expression (lower right panel). (C) Pseudo-temporal ordering of cells along the dedifferentiation trajectory (x axis) and their respective expression levels of ectopic transcription factors (top), MβTFs (second from top), Ins1 (middle); MA-DM, mature gene set from Melton group; IM-DM, immature gene set from Melton group (second from bottom) (Blum et al., 2012), and the top 2% H3K27ac-broad genes (excludes expression outliers Ins1 and Ins2) (bottom). (D) Mean expression (counts) of ETFs in human islet mRNA sequencing versus Hba1C index. Linear regression (solid line) and 95% confidence interval (dash lines) are shown. (E) tSNE representation of cells from scRNA-seq experiments on 14-week-old βEedKO (circles) and WT (triangles) islet cells, superimposed by a color scheme, representing mean expression of the depicted gene(sets).
Figure 7
Figure 7
PRC2-Associated Epigenome Regulation Is Therapeutically Targetable (A) Blood glucose levels during oral glucose tolerance test (1 g/kg) of 25-week-old βEedKO mice treated orally for 8 weeks with SAHA (2 mg/day) or vehicle control (n = 4–6 mice per group). (B) Blood glucose levels during oral glucose tolerance test (1 g/kg) of 24-week-old HFD-mice treated orally for 8 weeks with SAHA (2 mg/day) or vehicle control (n = 10 mice per group). (C) Blood glucose levels during oral glucose tolerance test (1 g/kg) of 25- to 30-week-old control, βEedKO, and βEedKO; βMllKO double knockout mice (DKO). Animals were sex-matched littermates (n = 3–4 mice per group). Statistical analysis indicated refers to βEedKO and βEedKO; βMllKO DKO mice comparisons. (D) Representative immunofluorescence images of Ctrl, βEedKO, and βEedKO; βMllKO DKO mice islets stained for insulin and DAPI at 25 weeks of age. Data are mean ± SEM. p < 0.05, ∗∗∗p < 0.001, ∗∗∗∗p < 0.0001.

Comment in

  • PRC2 in β-cell function.
    Leong I. Leong I. Nat Rev Endocrinol. 2018 Aug;14(8):441. doi: 10.1038/s41574-018-0039-8. Nat Rev Endocrinol. 2018. PMID: 29875378 No abstract available.

References

    1. Arda H.E., Benitez C.M., Kim S.K. Gene regulatory networks governing pancreas development. Dev. Cell. 2013;25:5–13. - PMC - PubMed
    1. Arrigoni L., Richter A.S., Betancourt E., Bruder K., Diehl S., Manke T., Bönisch U. Standardizing chromatin research: a simple and universal method for ChIP-seq. Nucleic Acids Res. 2015;44:e67. - PMC - PubMed
    1. Avrahami D., Li C., Zhang J., Schug J., Avrahami R., Rao S., Stadler M.B., Burger L., Schübeler D., Glaser B. Aging-dependent demethylation of regulatory elements correlates with chromatin state and improved β cell function. Cell Metab. 2015;22:619–632. - PMC - PubMed
    1. Benayoun B.A., Pollina E.A., Ucar D., Mahmoudi S., Karra K., Wong E.D., Devarajan K., Daugherty A.C., Kundaje A.B., Mancini E. H3K4me3 breadth is linked to cell identity and transcriptional consistency. Cell. 2014;158:673–688. - PMC - PubMed
    1. Benito E., Urbanke H., Ramachandran B., Barth J., Halder R., Awasthi A., Jain G., Capece V., Burkhardt S., Navarro-Sala M. HDAC inhibitor-dependent transcriptome and memory reinstatement in cognitive decline models. J. Clin. Invest. 2015;125:3572–3584. - PMC - PubMed

MeSH terms